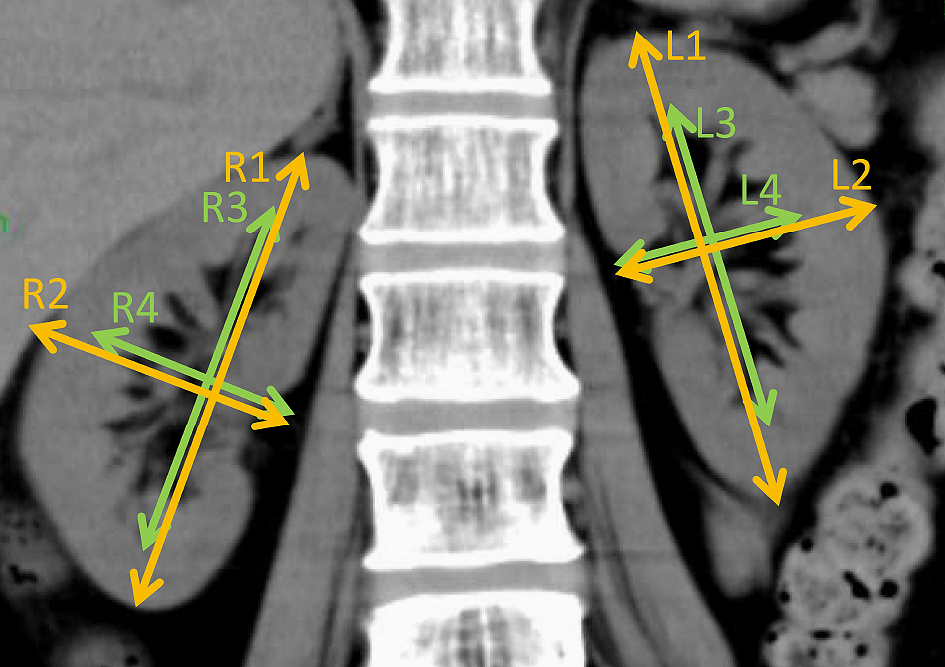
Figure 1. Coronal computed tomography image used to obtain total kidney volume. The maximum length of the kidney (R1-2, L1-2) and renal pelvis (R3-4, R3-4) was measured in the longitudinal and transverse axes. Using these lengths, the kidney volume was calculated by the equation described in the Methods section.
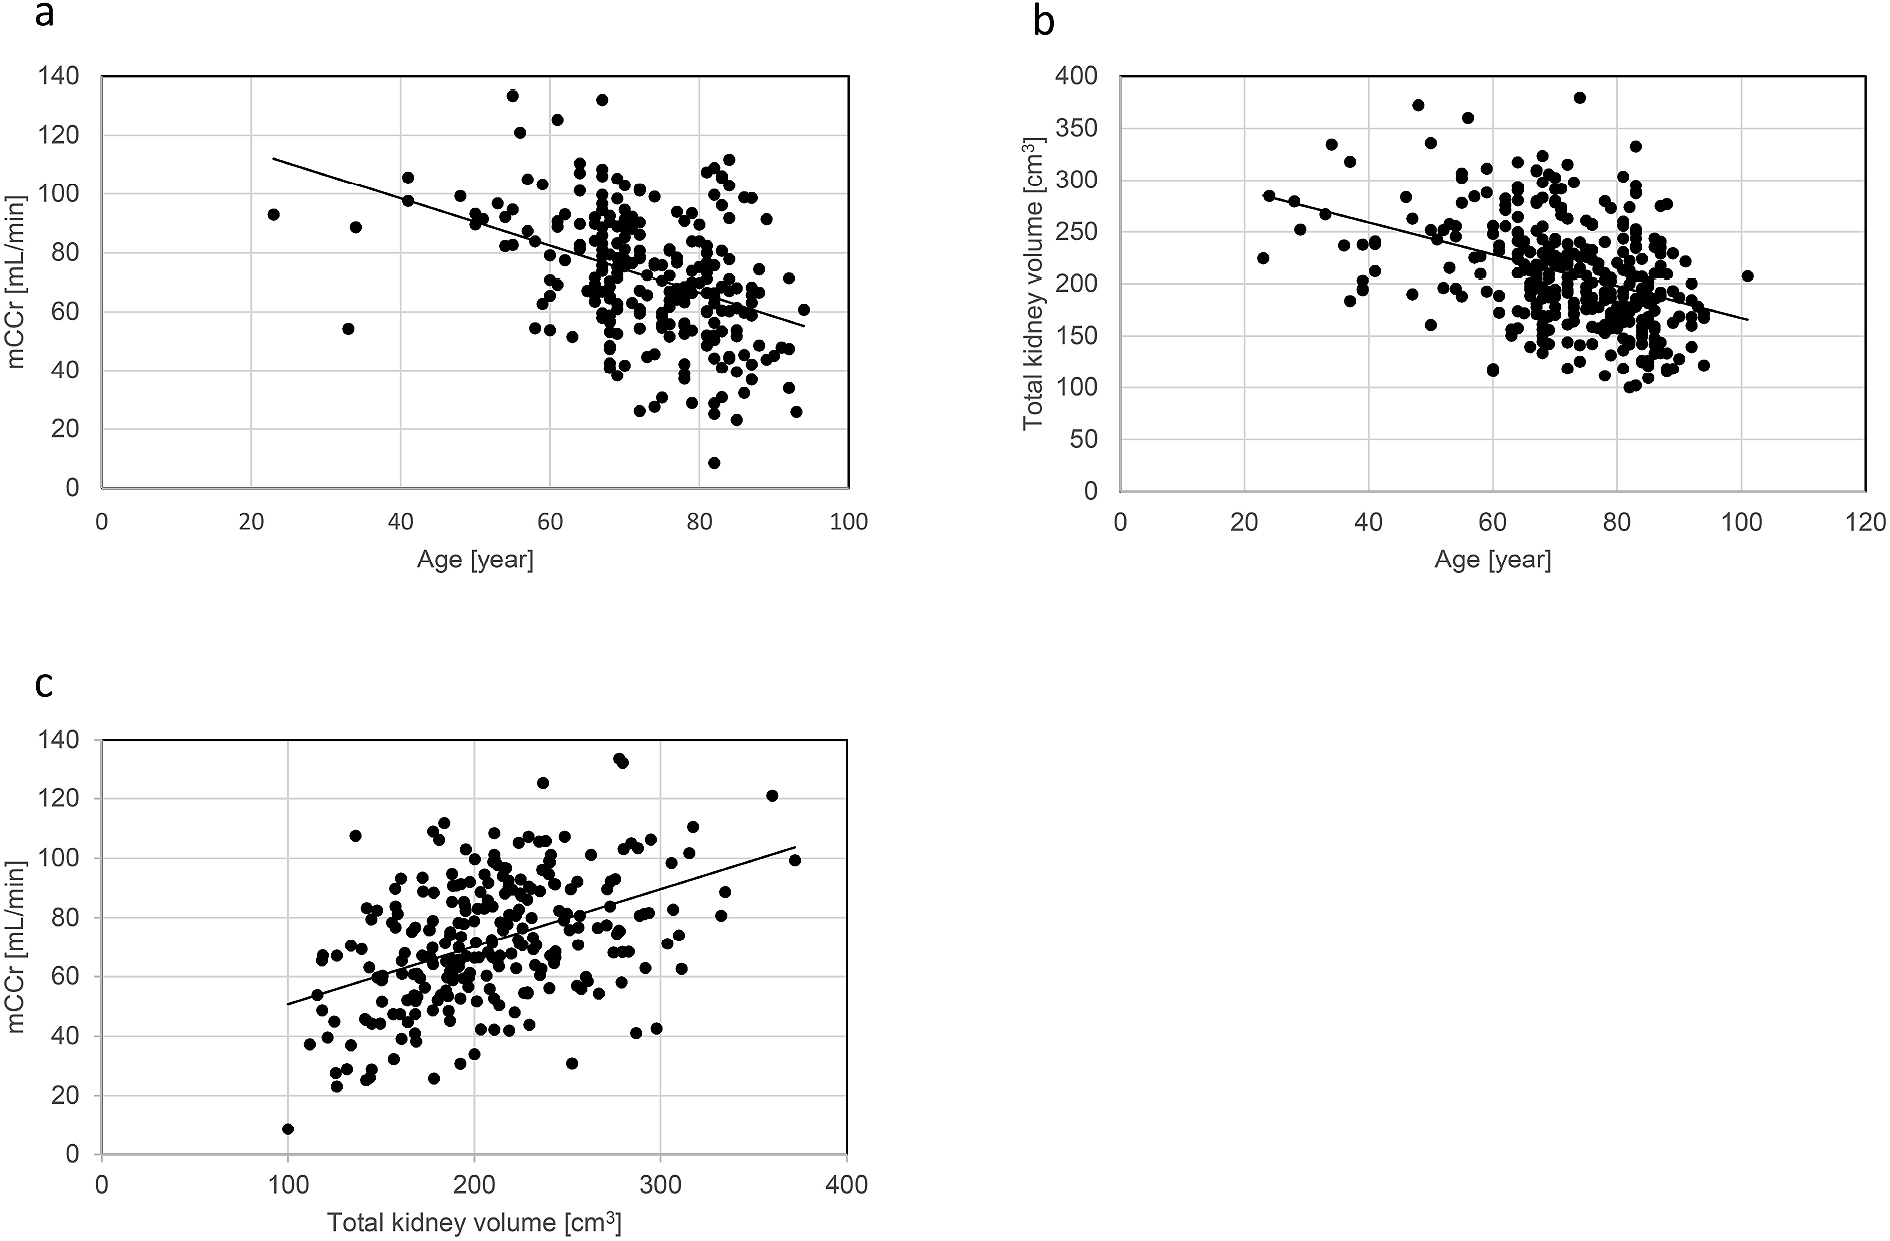
Figure 2. Correlations among age, mCCr, and total kidney volume. Scatter plots showed a significant negative correlation of age with (a) mCCr (r = −0.408, 95% CI = −0.506 to −0.300) and (b) total kidney volume (r = −0.387, 95% CI = −0.474 to −0.292). (c) The scatter plots showed a significant positive correlation of total kidney volume with mCCr (r = 0.445, 95% CI =0.341–0.538). mCCr, measured creatinine clearance; CI, confidence interval.
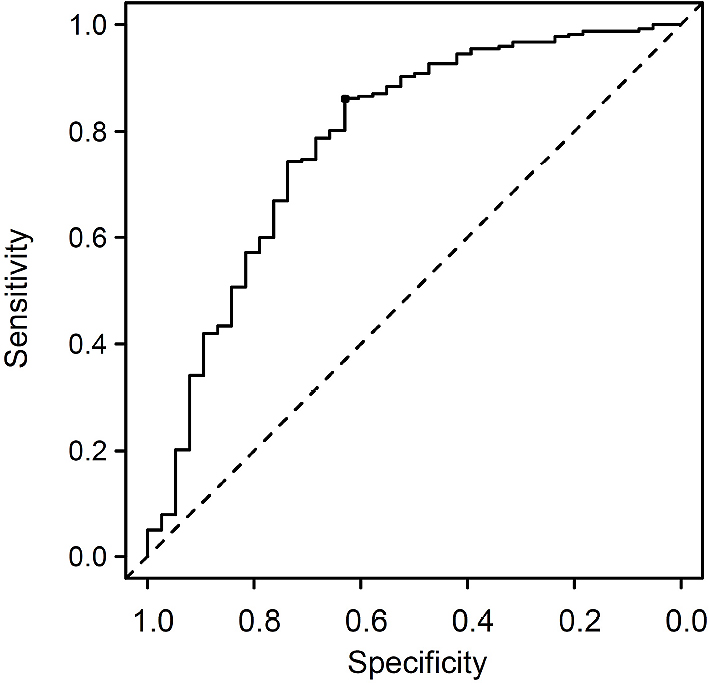
Figure 3. Receiver operating characteristic curves of total kidney volume to discriminate mCCr of ≥ 50 mL/min. The optimal cutoff value of the total kidney volume was 169.2 cm3 with a sensitivity of 86.2% and specificity of 63.2%. mCCr, measured creatinine clearance.