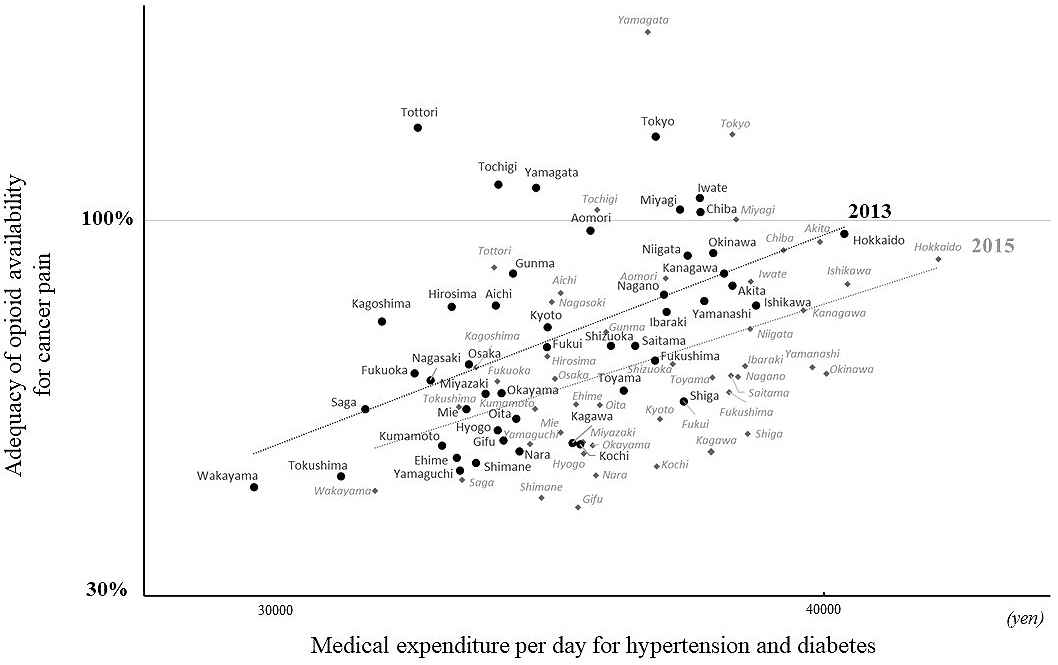
Figure 2. Scatterplots showing the relationship in individual prefectures between the adequacy of opioid availability for cancer pain and outpatient medical expenditure per day for hypertension and diabetes in 2013 and 2015.
The adequacy indicates the opioids required for pain relief in terminal cancer patients in mg per capita. The medical expenditure represents primary care practice in local healthcare institutes. Black diamonds and gray circles represent the adequacy and expenditure of individual prefectures in 2013 and 2015, respectively. Spearman’s correlation analyses reveal the linear associations between them in 2013 (black line; p < 0.001, R = 0.50) and 2015 (gray dotted line; p = 0.006, R = 0.40).
From: Prefectural Adequacy of Opioid Availability for Cancer Pain and Its Determinants in Japan: A Preliminary Study