Figure 1. Change of triglyceride, serum creatinine, and eGFR in fibrate-naïve patients with CKD.
Fibrates-naïve patients with hypertriglyceridemia were treated with pemafibrate. Baseline and 2-3 months after treatment with pemafibrate, blood sampling was performed in non-fasting condition at clinic visit. Data are shown in mean ± SD or the median [25%, 75%].
From: Effect of Pemafibrate on Serum Creatinine in Patients with Chronic Kidney Disease
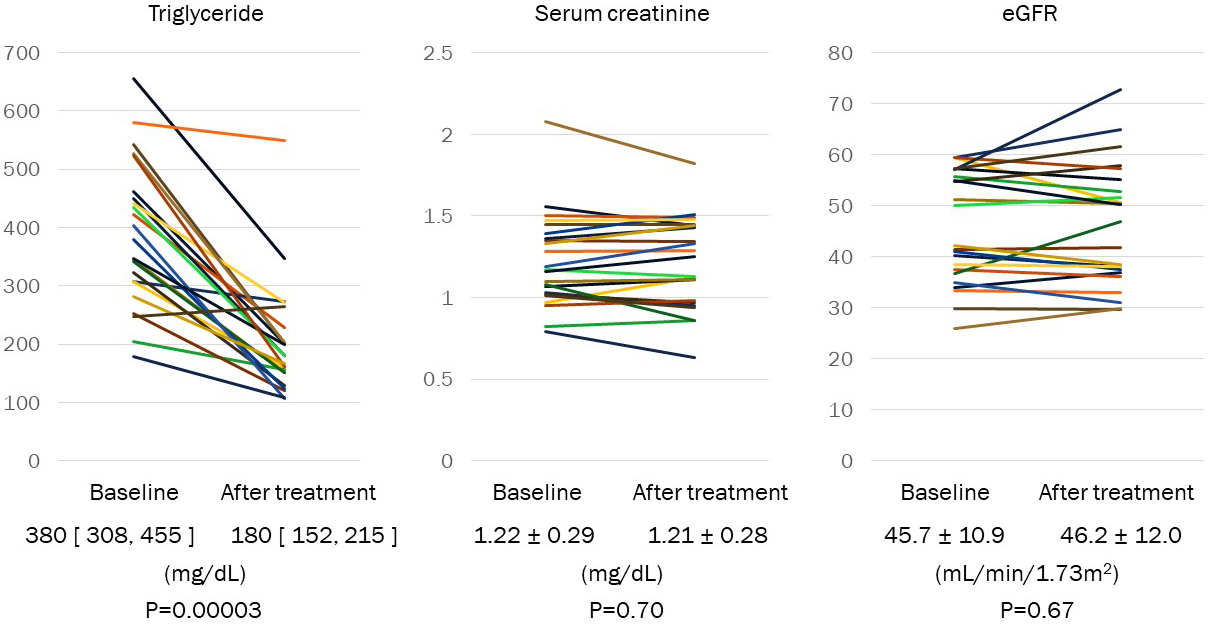
Figure 2. Change of triglyceride, serum creatinine, and eGFR in patients with CKD treated with 200-400 mg of bezafibrate or 80-100 mg of fenofibrate.
Fibrate-treated patients with hypertriglyceridemia were shifted to pemafibrate. Baseline and 2-3 months after treatment with pemafibrate, blood sampling was performed in non-fasting condition at clinic visit. Data are shown in mean ± SD or the median [25%, 75%].
From: Effect of Pemafibrate on Serum Creatinine in Patients with Chronic Kidney Disease
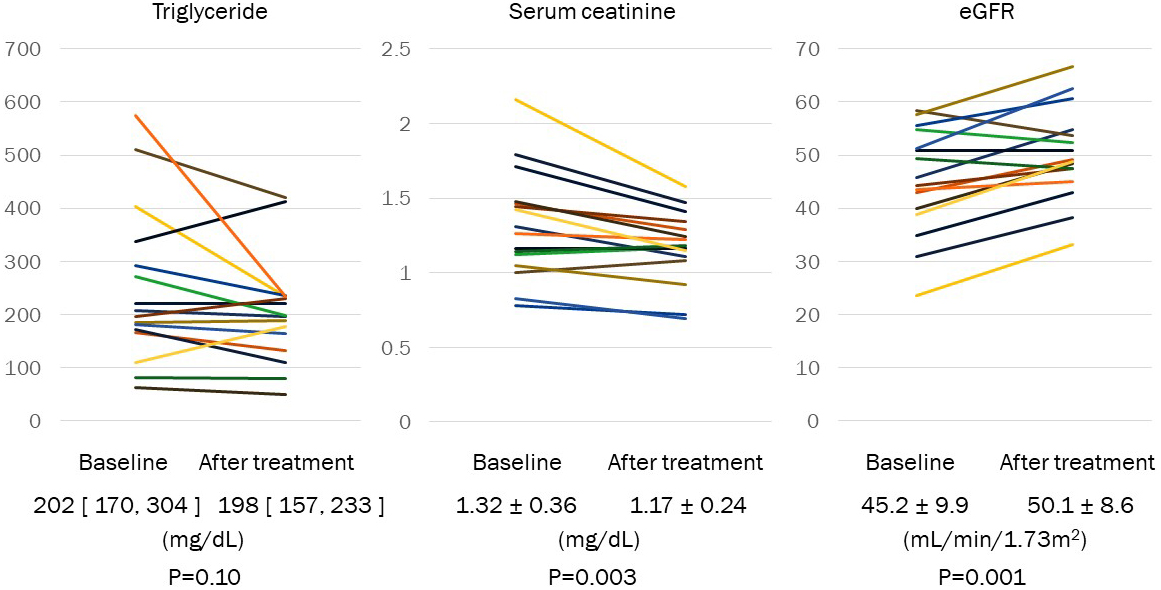
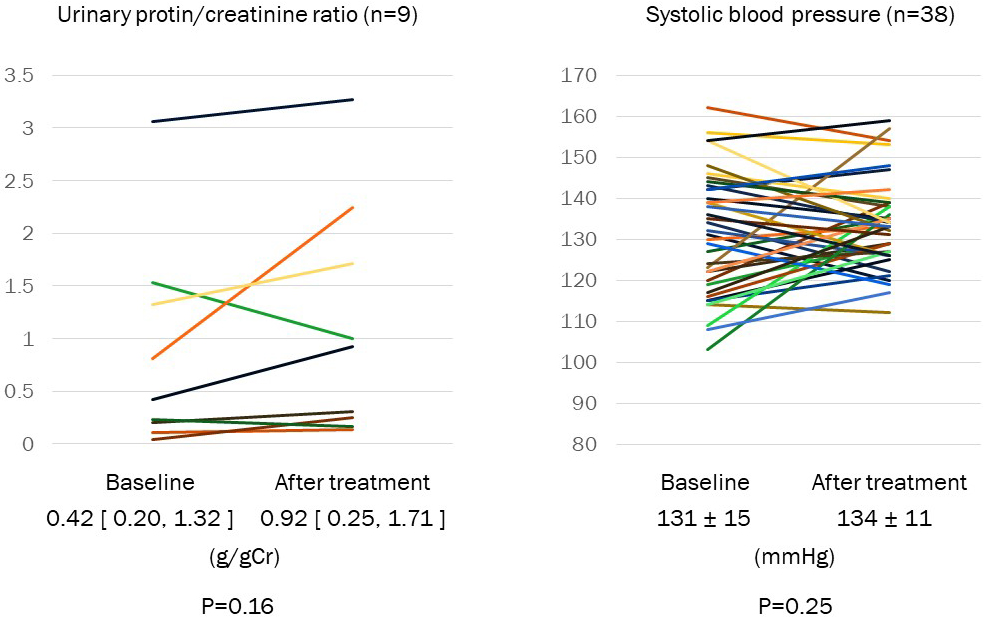
Figure 3. Change of urinary protein/creatinine ratio and systolic blood pressure.
Urinary protein/creatinine ratio was measured at baseline and after treatment with pemafibrate in patients with proteinuria (n = 9). Systolic blood pressure was shown at baseline and after treatment (n = 38). Data were shown in mean ± SD or the median [25%, 75%].
From: Effect of Pemafibrate on Serum Creatinine in Patients with Chronic Kidney Disease