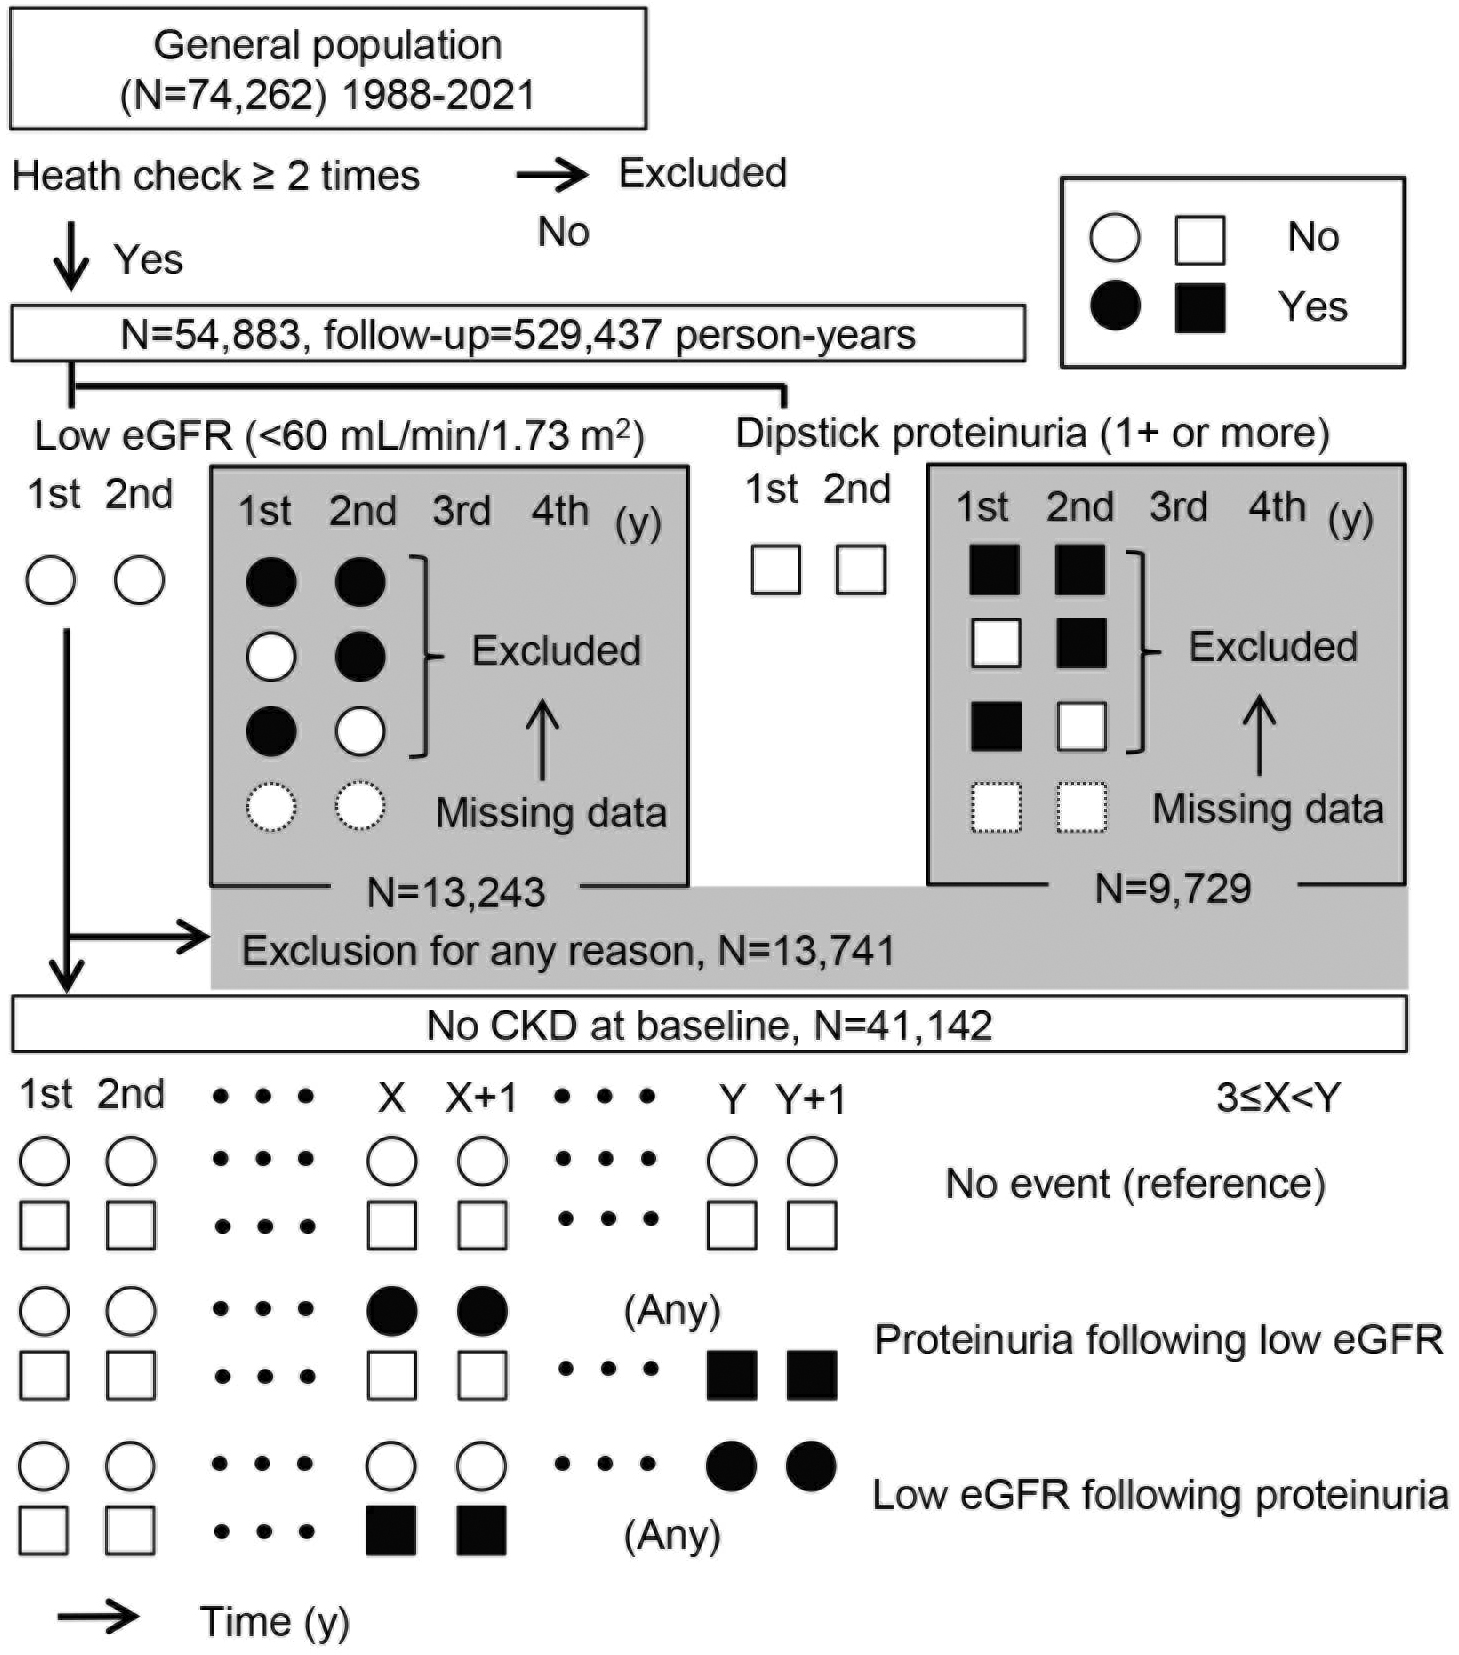
Figure 1. Design of the observational study over 30 years: 1988-2021. Participants in more than two annual health checkups were selected. Among them, subjects with any positive results in the first and second years were excluded. To determine the incidence of persistent proteinuria and a low estimated glomerular filtration rate (eGFR), persistency was judged based on consecutive positive results in the following years.
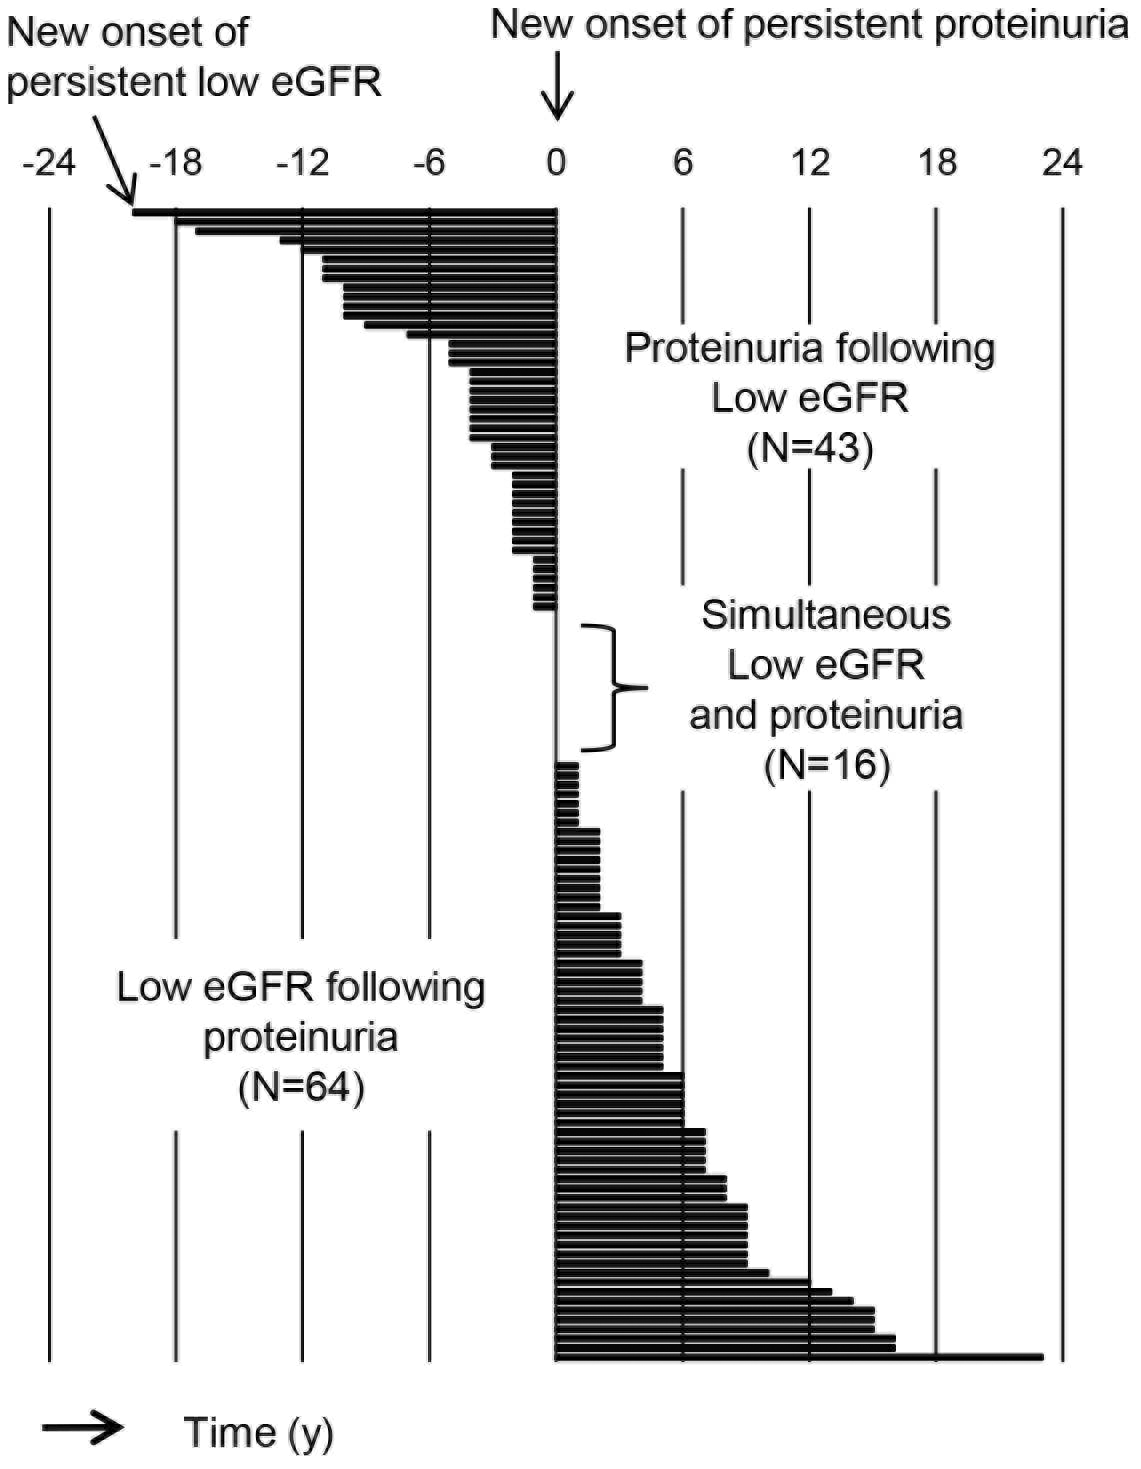
Figure 2. Time course of 123 subjects with both persistent proteinuria and persistent low eGFR. Proteinuria was defined as 1+ or more on dipstick urine test results, while low estimated glomerular filtration rate (eGFR) was defined as less than 60 mL/min/1.73 m2. A bar represents time (years) between new onset of persistent proteinuria and that of persistent low eGFR in each individual.