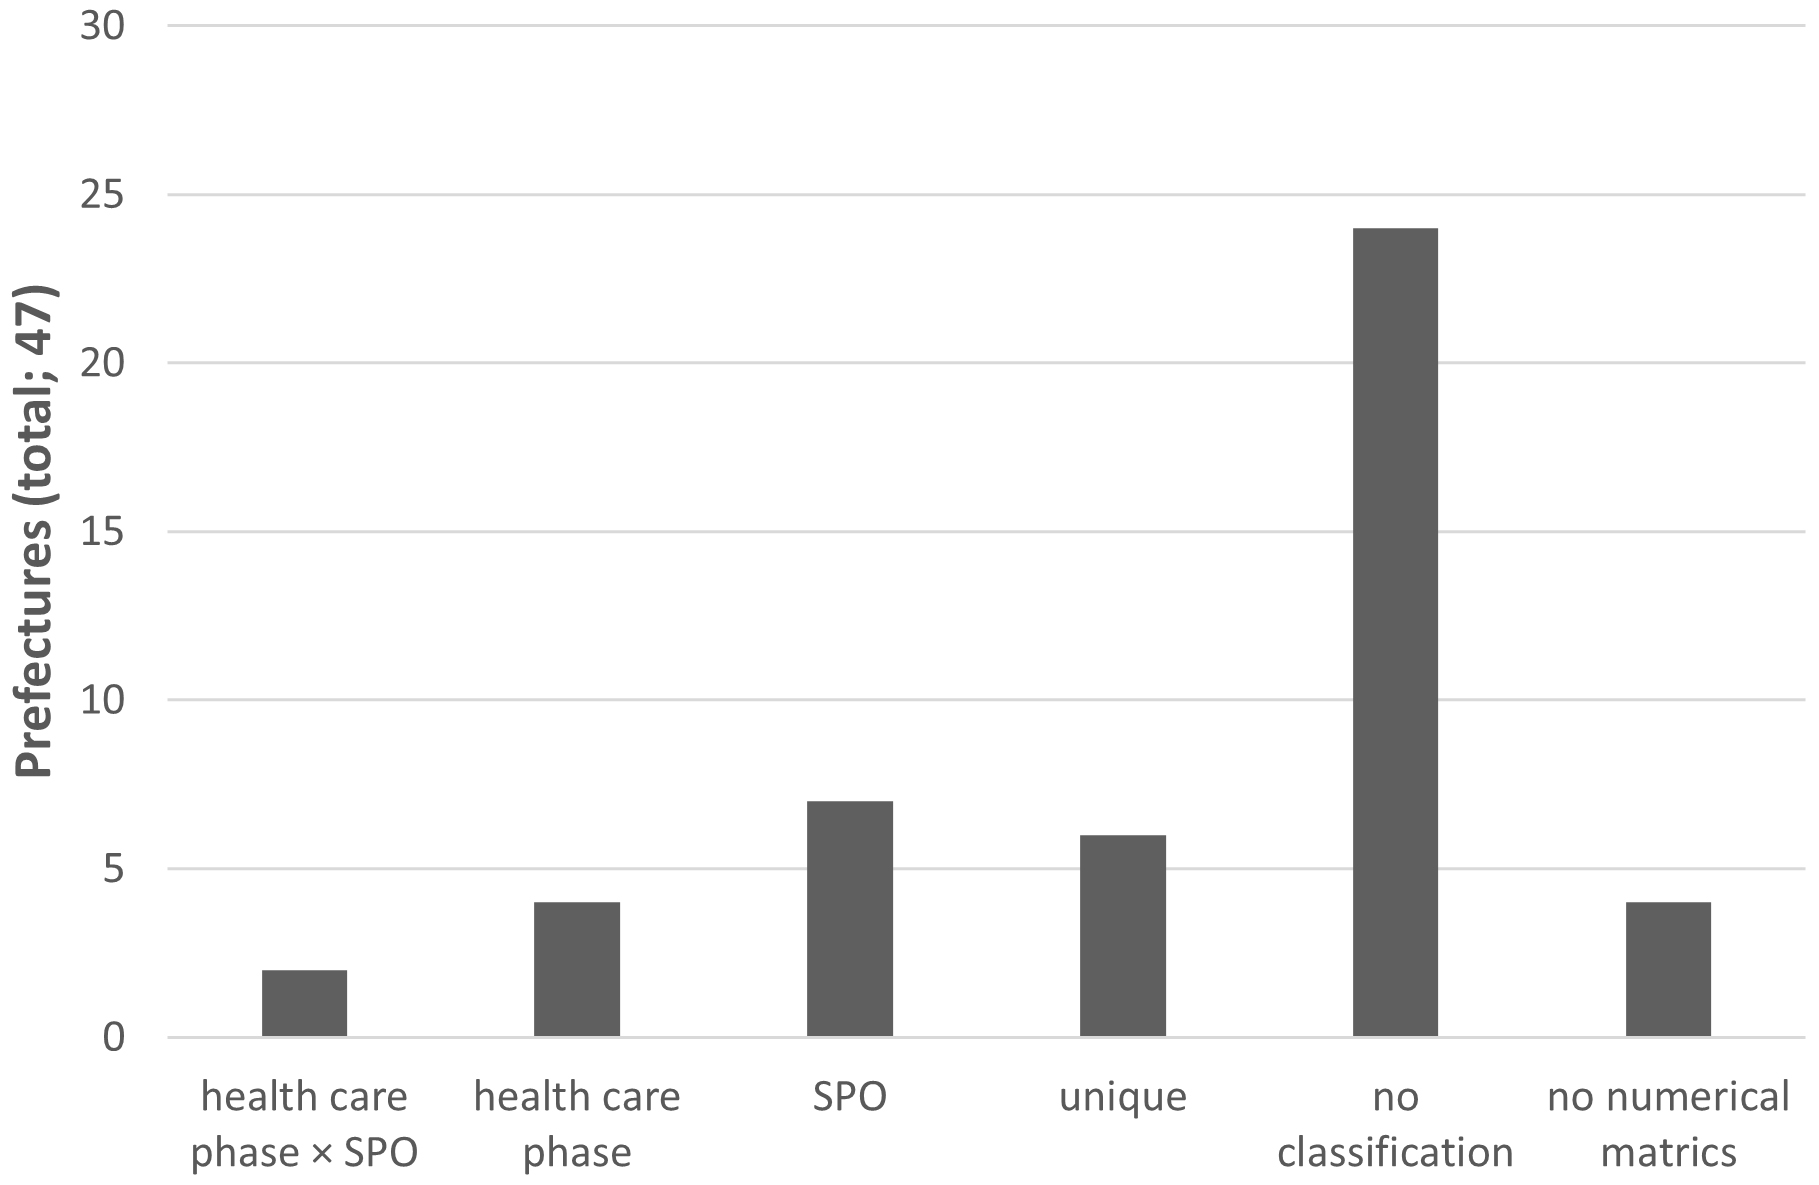
Figure 2. Distribution of the prefecture’s metric classification method
Two prefectural governments used a contingency table of health care phase classification and SPO classification, seven used only SPO classification, and four used only health care phase classification.
Six prefectural governments had their own unique classification. Twenty-four prefectural governments did not indicate any classification of their own numerical metrics.
From: Transversal Survey of Emergency Medicine Policy and Quality Metrics in Japan’s Regional Health Care Plans