Corresponding author: Hideaki Jinnouchi, hideaki@jinnouchi.or.jp
DOI: 10.31662/jmaj.2024-0366
Received: November 15, 2024
Accepted: January 16, 2025
Advance Publication: March 28, 2025
Published: April 28, 2025
Cite this article as:
Kurinami N, Takada M, Ashida K, Sugiyama S, Yoshida A, Hieshima K, Suzuki T, Miyamoto F, Kajiwara K, Jinnouchi K, Nomura M, Jinnouchi H. Clinical Factors Associated with Body-weight Reduction Induced by Semaglutide 1.0 mg Weekly in Patients with Type 2 Diabetes Mellitus. JMA J. 2025;8(2):526-532.
Introduction: We examined the clinical factors associated with a decrease in weight induced by weekly semaglutide in patients with type 2 diabetes mellitus (T2DM).
Methods: Patients with T2DM who visited the Diabetes Care Center of Jinnouchi Hospital between June 2020 and October 2023 and were treated with semaglutide, 1.0 mg weekly, in addition to their ongoing medications were retrospectively registered. We measured body weight both before weekly administration of 1.0 mg semaglutide and 180 days after treatment and calculated the change in weight.
Results: A total of 96 patients with T2DM were enrolled, with a mean body weight of 87.2 ± 17.1 kg and mean HbA1c of 7.3 ± 1.7% at baseline. The greater response group, defined as having 1.0 mg weekly semaglutide treatment-related weight reduction of more than 7.0%, comprised 23 patients (24.0%). Weekly 1.0 mg semaglutide treatment for 180 days significantly reduced body weight (−3.1 ± 4.8 kg, p < 0.001) and glycated hemoglobin (−0.39% ± 1.23%, p = 0.003). Multivariable logistic regression analysis found that pretreatment high-density lipoprotein (HDL)-cholesterol levels per 1.0 mg/dL (odds ratio [OR] 1.05; 95% confidence interval [CI] 1.01-1.09, p = 0.02) were independently and significantly associated with greater weight reduction after weekly 1.0 mg semaglutide treatment, while a switch from other glucagon-like peptide-1 receptor agonists (OR 0.31; 95% CI 0.11-0.87; p = 0.03) was independently and significantly associated with lesser weight reduction after weekly 1.0 mg semaglutide treatment. In receiver-operator characteristic analysis, the cutoff value of pretreatment HDL-cholesterol levels for the presence of greater response in weight reduction was 46 mg/dL (sensitivity 61%, specificity 62%; p = 0.03).
Conclusions: Pretreatment HDL-cholesterol levels serve as important information for weekly treatment with 1.0 mg semaglutide in patients with T2DM and expectation of weight reduction.
Key words: type 2 diabetes mellitus, obesity, glucagon-like peptide-1, weight reduction
Obesity is closely involved in the pathogenesis of type 2 diabetes mellitus (T2DM). The accumulation of visceral adipose tissue is a well-known risk factor for the development of insulin resistance, T2DM, and cardiovascular disease (1). The incidence of obesity is continually increasing and is recognized globally as an important clinical problem (2). In patients with T2DM, the treatment of diabetes accompanied by reduction of body fat and weight is potentially a valuable strategy that can lead to additional beneficial effects on the fundamental pathophysiology of T2DM.
Glucagon-like peptide-1 (GLP-1) reduces food intake via three pathways: the hypothalamus, the medullary area postrema, and afferent sensory neurons (3). Among GLP-1 receptor agonists (RAs), weekly semaglutide in particular has been reported to be effective in improving glucose metabolism and weight loss (4), (5). Weekly semaglutide treatment also induces early improvements in body composition in patients with T2DM (6). Thus, GLP-1 RAs are considered a suitable therapy for obese patients with T2DM. However, clinical factors associated with effective weight reduction remain unknown. To determine the efficacy of GLP-1 RA antidiabetic treatment in T2DM patients, we need to know the baseline clinical factors associated with GLP-1 RA in body-weight reduction.
In this study, based on results obtained from weekly treatment with 1.0 mg semaglutide for glucose reduction in T2DM, we examined the clinical factors associated with the decrease in weight induced by weekly semaglutide in patients with T2DM.
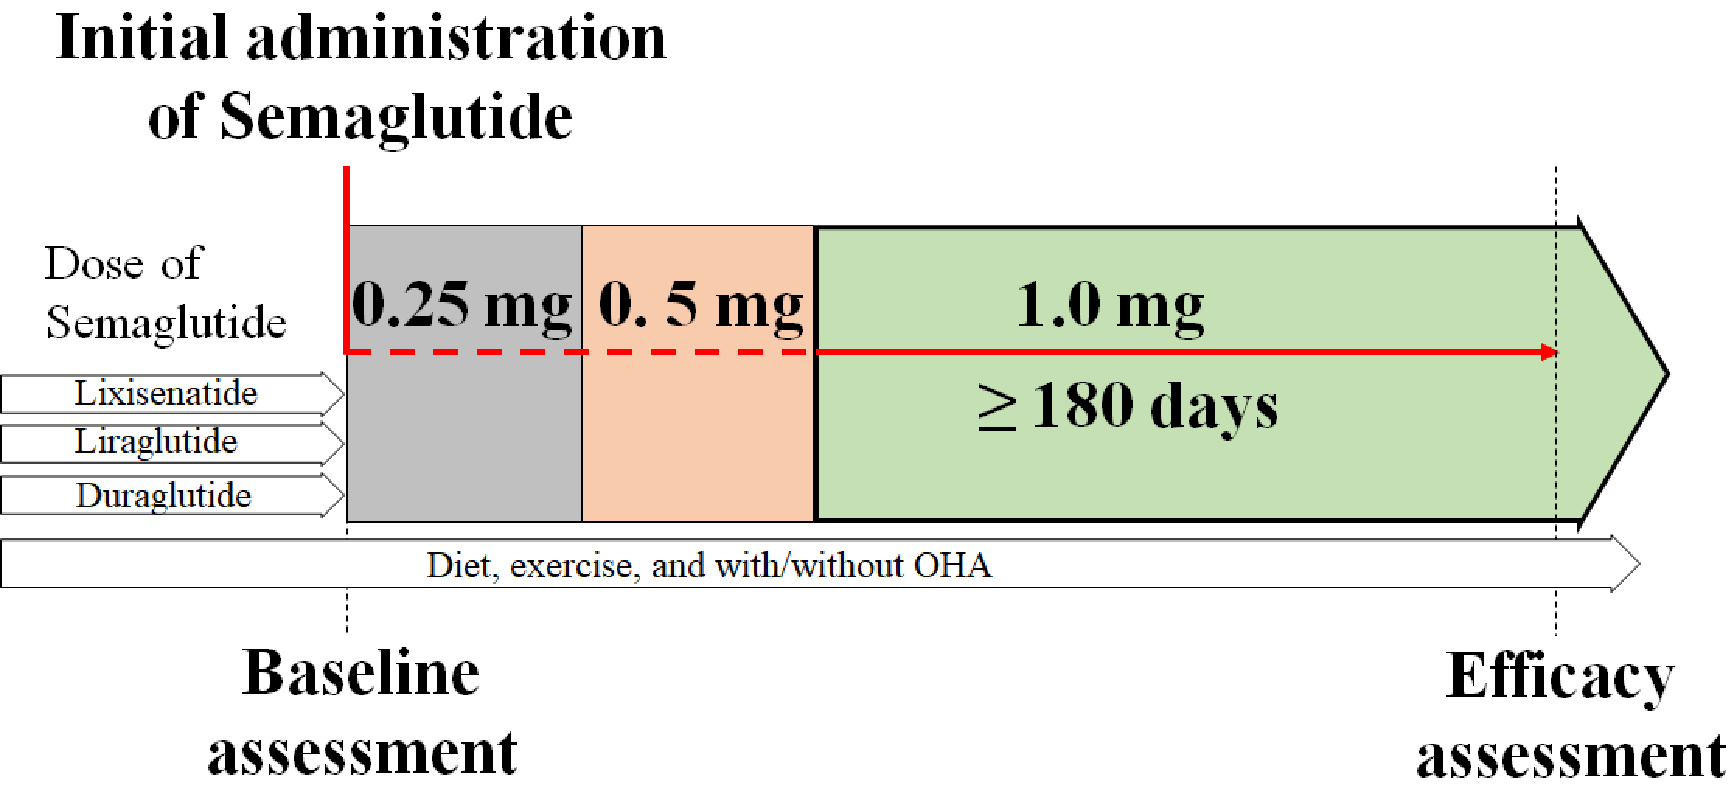
Patients with T2DM who visited the Diabetes Care Center at Jinnouchi Hospital between June 2020 and October 2023, and who initiated treatment with a weekly dose of 1.0 mg semaglutide in addition to their existing medications, were retrospectively registered. Baseline assessments were performed before the initial weekly administration of 0.25 mg semaglutide. After the patients had received 1.0 mg semaglutide weekly for 180 days, their weights were measured on day 180 and the change in levels from baseline was recorded (Figure 1). Semaglutide 1.0 mg had the highest weight-reduction effect among the available GLP-1 RAs in Japan (7), and we therefore proactively introduced semaglutide 1.0 mg for all patients who were deemed to require further dose reduction and who provided consent. Written informed consent was obtained from all patients. This study was conducted in accordance with the Declaration of Helsinki, and the study protocol was approved by the Human Ethics Review Committee of Jinnouchi Hospital, Kumamoto, Japan (2023-11-3). This study was registered in the UMIN protocol registration system (identification: UMIN000054704).
Measurement of glycated hemoglobin (HbA1c) and plasma glucose is routinely performed every month in patients with diabetes mellitus. Moreover, biochemical examinations of blood serum chemistry are usually performed before and after newly started medications, including GLP-1 RA, to determine drug-induced side effects. Blood samples for HbA1c, total cholesterol, low-density lipoprotein cholesterol, high-density lipoprotein (HDL) cholesterol, triglycerides, creatinine, estimated glomerular filtration rate, uric acid, aspartate aminotransferase, alanine aminotransferase, and γ-glutamyl transpeptidase were collected from the antecubital vein before GLP-1 RA therapy and analyzed in the Jinnouchi Hospital laboratory.
The Shapiro-Wilk test was used to assess the normal distribution of continuous data. Data were expressed as mean ± standard deviation, and data with skewed distributions are expressed as the median value with interquartile range. Categorical data are presented as frequencies and percentages. Differences between paired samples were analyzed by the t test or Wilcoxon signed-rank test; the differences between two groups were analyzed by the t test, Mann-Whitney U test, or Fisher’s exact test as appropriate. It has been reported that a 7% weight loss improves blood pressure, lipids, and blood sugar levels (8). We therefore defined a greater response in weight reduction following 1.0 mg semaglutide per week as a >7.0% reduction in weight at 180 days from initiation of treatment. We analyzed this by simple logistic regression analysis, with greater weight reduction as the dependent variable and various parameters as independent variables. We investigated the factors clinically associated with greater body fat reduction following weekly 1.0 mg semaglutide using multivariate logistic regression analysis including significant factors in univariate logistic regression analysis. The Hosmer-Lemeshow test was conducted to investigate the goodness of fit of the logistic regression model. A receiver-operating characteristic (ROC) curve analysis was conducted to calculate a cutoff value of pretreatment levels of HDL-cholesterol for greater body-weight reduction. Statistical significance was set at p value < 0.05. Statistical analyses were performed by using SPSS version 23 (SPSS Inc., Chicago, IL, USA).
Of 250 patients with T2DM who were adequately managed with the administration of weekly semaglutide (0.25 mg in 61 patients; 0.5 mg in 93 patients; 1.0 mg in 96 patients), 96 patients managed with 1.0 mg semaglutide weekly were enrolled in this study. Table 1 shows the baseline characteristics of the participants, aged 56.7 ± 9.5 years, 58 of whom (60.4%) were male. Height was 164.9 ± 8.9 cm, weight was 82.7 (75.9-97.6) kg, body mass index was 30.8 (28.7-34.5) kg/m2, and HbA1c was 7.0 (6.3-7.8). Seventy patients (72.2%) switched from other GLP-1 RAs. Details of the switched GLP-1 RAs included three cases of lixisenatide 20 μg/day, two cases of liraglutide 0.6 mg/day, one case of liraglutide 0.9 mg/day, 12 cases of liraglutide 1.8 mg/day, and 52 cases of dulaglutide 0.75 mg/week.
Table 1. Clinical Characteristics of the Study Participants.
| Overall (N=96) | greater response group (N=23) | none-greater response group (N=73) | P value | |
|---|---|---|---|---|
| Age (year) | 56.7±9.5 | 59.2±10.7 | 55.9±9.0 | 0.1512 |
| Male (%) | 58 (60.4%) | 13 (56.5%) | 45 (61.6%) | 0.8073 |
| Height (cm) | 164.9±8.9 | 163.8±7.7 | 165.2±9.2 | 0.5064 |
| Weight (kg) | 82.7 (75.9-97.6) | 81.2 (71.9-89.6) | 83.5 (77.6-98.1) | 0.3846 |
| BMI (kg/m2) | 30.8 (28.7-34.5) | 30.1 (28.1-31.9) | 31.7 (28.9-34.7) | 0.4783 |
| Hemoglobin A1c (%) | 7.0 (6.3-7.8) | 6.6 (6.0-7.2) | 7.1 (6.4-8.3) | 0.0666 |
| Aspartate aminotransferase (IU/L) | 25 (19-35) | 25 (20-36) | 26 (19-35) | 0.6619 |
| Alanine aminotransferase (IU/L) | 28 (20-42) | 27 (17-37) | 28 (23-43) | 0.1955 |
| γ-glutamyl transpeptidase (IU/L) | 28 (20-49) | 26 (23-51) | 30 (20-48) | 0.3606 |
| Total cholesterol (mg/dL) | 150 (132-182) | 144 (132-188) | 150 (131-181) | 0.3936 |
| HDL-cholesterol (mg/dL) | 45 (38-51) | 47 (43-58) | 44 (37-51) | 0.0058 |
| LDL-cholesterol (mg/dL) | 75 (59-91) | 72 (58-97) | 75 (59-87) | 0.4271 |
| Triglycerides (mg/dL) | 141 (98-216) | 130 (98-176) | 141 (98-220) | 0.2486 |
| eGFR (ml/min/1.73 m2) | 73.0 (61.0-83.3) | 76.2 (53.2-83.8) | 72.4 (61.4-83.3) | 0.8153 |
| Antidiabetic medicines (%) | ||||
| Insulin (combined) | 37 (47.4%) | 8 (34.8%) | 29 (39.7%) | 0.8072 |
| Sulfonylureas (combined) | 24 (24.7%) | 4 (17.4%) | 20 (27.3%) | 0.4161 |
| Glinides (combined) | 4 (4.1%) | 2 (8.7%) | 2 (2.7%) | 0.2417 |
| DPP-4 inhibitor (switched) | 7 (7.2%) | 2 (8.7%) | 5 (6.8%) | 0.6715 |
| GLP-1 receptor agonists (switched) | 70 (72.2%) | 12 (52.2%) | 58 (79.5%) | 0.0154 |
| SGLT-2 inhibitor (combined) | 81 (83.5%) | 20 (87.0%) | 61 (83.6%) | 1.0000 |
| Metformin (combined) | 56 (57.7%) | 15 (65.2%) | 41 (56.2%) | 0.4779 |
| Thiazolidinedione (combined) | 8 (8.2%) | 1 (4.3%) | 7 (9.6%) | 0.6752 |
| Alpha-glucosidase inhibitor (combined) | 5 (5.2%) | 3 (13.0%) | 2 (2.7%) | 0.0873 |
| Data are represented as the mean ± SD, median [25th to 75th percentile range] BMI, body mass index; HDL, high-density lipoprotein; LDL, low-density lipoprotein; eGFR, estimated glomerular filtration rate; DPP-4, dipeptidyl peptidase-4; GLP-1 RA, glucagon-like peptide-1 receptor agonists; SGLT2, sodium glucose co-transporter 2 |
||||
Weekly treatment with 1.0 mg semaglutide for 180 days significantly reduced body weight (−3.1 ± 4.8 kg, −2.7 [−5.5 to −0.6], p < 0.001) and HbA1c (−0.39% ± 1.23%, −0.1 [−0.8 to 0.2], p = 0.003).
We defined the greater response group as having a weight reduction of more than 7.0% in relation to weekly treatment with 1.0 mg semaglutide. The number of patients in this greater response group was 23 (24.0%). The results of baseline clinical characteristics of the greater response group and non-greater-response group are shown in Table 1. The HDL-cholesterol level was significantly higher in the greater response group than in the non-greater-response group. Patients who switched from other GLP-1 RAs were significantly less frequent in the greater response group than in the non-greater-response group.
Logistic regression analyses were performed to determine the presence of a greater response in weight reduction after weekly 1.0-mg semaglutide treatment (Table 2). A simple logistic regression analysis found pretreatment HDL-cholesterol levels (odds ratio [OR] 1.05; 95% confidence interval [CI] 1.01-1.10; p = 0.01) and presence of switch from other GLP-1 RAs (OR 0.28; 95% CI 0.10-0.76; p = 0.01) to be significantly related factors. Multivariable logistic regression analysis revealed that the pretreatment HDL-cholesterol level (OR 1.05; 95% CI 1.01-1.09; p = 0.02) was independently and significantly associated with greater weight reduction after weekly 1.0 mg semaglutide treatment, while a switch from other GLP-1 RAs (OR 0.31; 95% CI 0.11-0.87; p = 0.03) was independently and significantly associated with lesser weight reduction after weekly 1.0 mg semaglutide treatment.
Table 2. Logistic Regression Analysis for Presence of Greater Response in Weight Reduction after Weekly Treatment with Semaglutide.
| Simple regression | Multivariate regression | |||||
|---|---|---|---|---|---|---|
| OR | 95%CI for Odds ratio | P-value | OR | 95%CI for Odds ratio | P-value | |
| Age (per 1.0year) | 1.0381 | 0.9862 - 1.0928 | 0.1527 | |||
| Sex (male) | 1.2363 | 0.4782 - 3.1961 | 0.6616 | 1.1255 | 0.4016 - 3.1544 | 0.8221 |
| Height (per 1.0 cm) | 0.9818 | 0.9304 - 1.0360 | 0.5022 | |||
| Weight (per 1.0 kg) | 0.9870 | 0.9584 - 1.0164 | 0.3816 | |||
| BMI (per 1.0 kg/m2) | 0.9613 | 0.8629 - 1.0710 | 0.4744 | |||
| Hemoglobin A1c (per 1.0 %) | 0.7091 | 0.4861 - 1.0344 | 0.0744 | |||
| Aspartate aminotransferase (per 1.0 IU/L) | 0.9935 | 0.9651 - 1.0227 | 0.6589 | |||
| Alanine aminotransferase (per 1.0 IU/L) | 0.9811 | 0.9530 - 1.0101 | 0.1994 | |||
| γ-glutamyl transpeptidase (per 1.0 IU/L) | 1.0064 | 0.9926 - 1.0203 | 0.3656 | |||
| Total cholesterol (per 1.0 mg/dL) | 1.0054 | 0.9931 - 1.0178 | 0.3907 | |||
| HDL-cholesterol (per 1.0 mg/dL) | 1.0522 | 1.0103 - 1.0959 | 0.0140 | 1.0472 | 1.0059 - 1.0902 | 0.0248 |
| LDL-cholesterol (per 1.0 mg/dL) | 1.0067 | 0.9904 - 1.0232 | 0.4240 | |||
| Triglycerides (per 1.0 mg/dL) | 0.9963 | 0.9902 - 1.0023 | 0.2270 | |||
| eGFR (per 1.0 ml/min/1.73 m2) | 0.9977 | 0.9790 - 1.0168 | 0.8130 | |||
| Insulin (versus no use) | 0.8092 | 0.3044 - 2.1513 | 0.6713 | |||
| Sulfonylureas (versus no use) | 0.5579 | 0.1689 - 1.8423 | 0.3383 | |||
| Glinides (versus no use) | 3.3810 | 0.4487 - 25.4747 | 0.2371 | |||
| DPP-4 inhibitor (versus no use) | 1.2952 | 0.2340 - 7.1704 | 0.7670 | |||
| GLP-1 RA (versus no use) | 0.2821 | 0.1042 - 0.7637 | 0.0128 | 0.3105 | 0.1106 - 0.8718 | 0.0264 |
| SGLT-2 inhibitor (versus no use) | 1.3115 | 0.3359 - 5.1211 | 0.6964 | |||
| Metformin (versus no use) | 1.4634 | 0.5522 - 3.8786 | 0.4439 | |||
| Thiazolidinedione (versus no use) | 0.4286 | 0.0499 - 3.6797 | 0.4399 | |||
| Alpha-glucosidase inhibitor (versus no use) | 5.3250 | 0.8317 - 34.0942 | 0.0775 | |||
|
Hosmer-Lemeshow goodness-of-fit χ2 for multivariate regression model was 4.58 with a P value of 0.810 OR, odds ratio; CI, confidence interval; BMI, body mass index; HDL, high-density lipoprotein; LDL, low-density lipoprotein; eGFR, estimated glomerular filtration rate; DPP-4, dipeptidyl peptidase-4; GLP-1 RA, glucagon-like peptide-1 receptor agonists; SGLT2, sodium glucose co-transporter 2 |
||||||
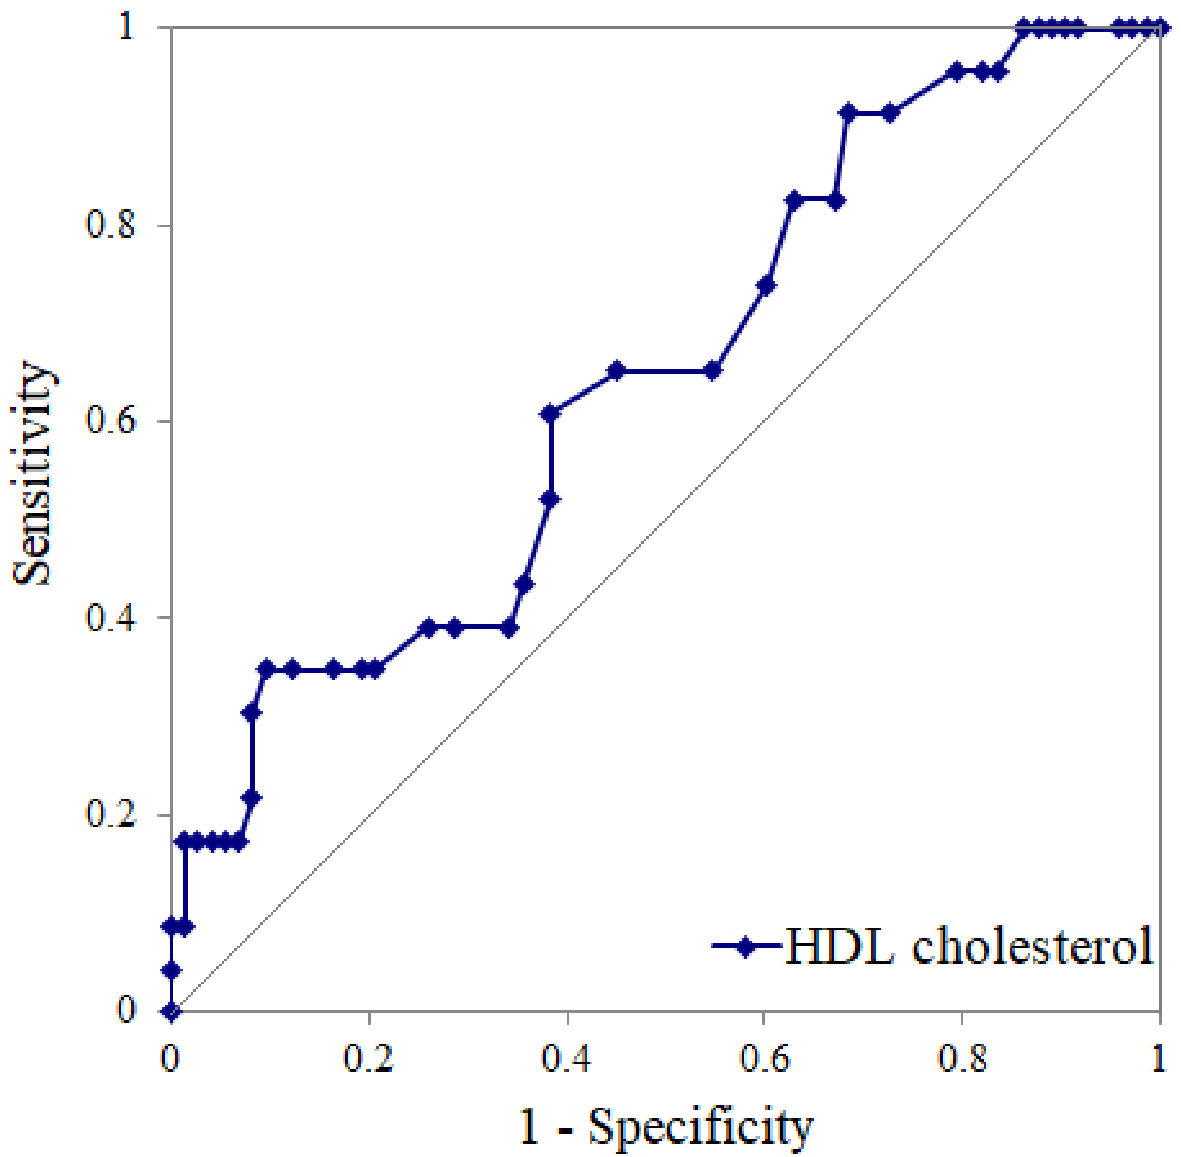
We conducted a ROC curve analysis to calculate a cutoff value of pretreatment HDL-cholesterol levels for the presence of greater response in weight reduction after weekly treatment with 1.0 mg semaglutide, whereby we determined a cutoff of 46 mg/dL (area under the curve = 0.64; sensitivity, 61%; specificity, 62%; p = 0.03) (Figure 2). Among the greater responders (those with >7% body-weight reduction), a high OR of 2.5 was observed in patients with high HDL-cholesterol levels compared with those with low HDL-cholesterol levels (14 greater responders among 42 patients in the high HDL-cholesterol subgroup vs. 9 greater responders among 54 patients in the low HDL-cholesterol subgroup).
We investigated the percentage weight change after switching from all-GLP-1 RAs, liraglutide, and non-liraglutide GLP-1 RAs to weekly semaglutide 1.0 mg. Weight was significantly decreased in the all-GLP-1 RAs (−3.0 ± 5.1%, p < 0.01) and the non-liraglutide groups (−3.9 ± 4.8%, p < 0.01); however, there was no significant change in the liraglutide group (−0.1 ± 4.9%, p = 0.98). Significant weight reduction was observed in the group without prior GLP-1 RA treatment (−5.2 ± 5.5%, p < 0.01).
In the present study, pretreatment levels of HDL-cholesterol and switching from other GLP-1 RAs were significantly associated with weekly semaglutide-induced greater reduction in weight after 180 days of treatment with 1.0 mg semaglutide per week. We determined that the optimal HDL-cholesterol cutoff value for predicting weekly semaglutide-induced greater reduction in weight was 46 mg/dL.
Semaglutide may reduce body weight more effectively than the other GLP-1 RAs; only the group that switched from liraglutide to semaglutide showed no significant weight reduction. Semaglutide and liraglutide have similar peptide structures (9), and both have long half-lives and are considered more effective at suppressing appetite than other GLP-1 RAs (10). Regarding GLP-1 RAs other than liraglutide, switching to weekly semaglutide improved hyperglycemia and overweight (11), (12). Furthermore, semaglutide administration resulted in the greatest weight reduction, even compared with other glucose-lowering medications (13). Switching to weekly semaglutide may be beneficial when other GLP-1 RAs are unable to achieve sufficient weight reduction, given that further management of obesity is recommended to achieve better cardiovascular and renal outcomes (14).
HDL-cholesterol levels were significantly associated with weight reduction after GLP1-RA administration. Several factors and mechanisms are involved in the regulation of HDL-cholesterol levels and obesity, high leptin concentrations (15), and low adiponectin levels are closely related to low HDL-cholesterol levels and quality (16). Notably, leptin-deficient mice showed low serum HDL-cholesterol levels as a result of the downregulation of hepatic scavenger receptor class B member 1 (17). Regarding the relationship between leptin and GLP-1 RA, high plasma leptin concentrations weaken the effect of GLP-1 RA on food intake (18), and leptin-receptor-deficient obese and diabetic mice did not reduce their food intake after semaglutide administration. Leptin resistance, along with a high-fat diet, inhibits the effects of GLP-1 RA administration on food intake reduction (19). Conversely, the GLP-1 RA semaglutide enhances leptin sensitivity, although expression of the long-form leptin receptor is increased in obese animals (20). Notably, no previous studies have shown that HDL-cholesterol levels affect the weight-reduction effect of GLP-1 RAs, although the mechanism underlying this effect remains unclear. Measuring serum leptin concentrations and pretreatment HDL-cholesterol levels in clinical practice may help to predict the weight-reducing effects of semaglutide administration.
This study has several limitations. First, its retrospective design limited the ability of the study to establish causality and control for confounding factors. In addition, the study subjects were restricted to those who had adhered to semaglutide for 180 days. Second, no control group was included. Third, the sample size was relatively small, which may have limited the statistical power to detect any significant differences. Fourth, we were unable to consider any weight loss caused by GLP-1 RA used prior to switching. As a result, the mechanism underlying this relationship remains unclear and further prospective studies with larger sample sizes are needed. Fifth, this study did not measure blood leptin concentrations, although previous research has suggested that an increased blood leptin concentration may underlie GLP-1 resistance to body-weight reduction.
In conclusion, pretreatment HDL-cholesterol levels provide important information relating to weight-reduction expectations in patients with T2DM treated with weekly semaglutide 1.0 mg. Patients with T2DM who have never been administered GLP-1 RAs and have an HDL-cholesterol level of 46 mg/dL or higher may be the most suitable candidates for weight reduction with 1.0 mg semaglutide weekly.
HJ received honoraria from Novo Nordisk, Sanofi, Eli Lilly, Mitsubishi Tanabe Pharma, and Otsuka Pharmaceutical. SS has received honoraria from AstraZeneca Pharmaceuticals and Ono Pharmaceutical. The authors declare that no other potential conflicts of interest exist in relation to this study.
We thank Hugh McGonigle, from Edanz (https://www.jp.edanz.com/ac), for editing a draft of the manuscript.
Noboru Kurinami and Masafumi Takada contributed equally to the present study.
The study protocol was approved by the Human Ethics Review Committee of Jinnouchi Hospital on November 6, 2023 (approval number: 2023-11-3).
Heymsfield SB, Wadden TA. Mechanisms, pathophysiology, and management of obesity. N Engl J Med. 2017;376(15):1492.
Rabe K, Lehrke M, Parhofer KG, et al. Adipokines and insulin resistance. Mol Med. 2008;14(11-12):741-51.
Harada N, Inagaki N. Regulation of food intake by intestinal hormones in brain. J Diabetes Investig. 2022;13(1):17-8.
Pratley RE, Aroda VR, Lingvay I, et al. Semaglutide versus dulaglutide once weekly in patients with type 2 diabetes (SUSTAIN 7): a randomised, open-label, phase 3b trial. Lancet Diabetes Endocrinol. 2018;6(4):275-86.
Capehorn MS, Catarig AM, Furberg JK, et al. Efficacy and safety of once-weekly semaglutide 1.0mg vs once-daily liraglutide 1.2mg as add-on to 1-3 oral antidiabetic drugs in subjects with type 2 diabetes (SUSTAIN 10). Diabetes Metab. 2020;46(2):100-9.
Volpe S, Lisco G, Racaniello D, et al. Once-weekly semaglutide induces an early improvement in body composition in patients with type 2 diabetes: a 26-week prospective real-life study. Nutrients. 2022;14(12):2414.
Trujillo JM, Nuffer W, Smith BA. GLP-1 receptor agonists: an updated review of head-to-head clinical studies. Ther Adv Endocrinol Metab. 2021;12:2042018821997320.
Knowler WC, Barrett-Connor E, Fowler SE, et al. Reduction in the incidence of type 2 diabetes with lifestyle intervention or metformin. N Engl J Med. 2002;346(6):393-403.
Knudsen LB, Lau J. The discovery and development of liraglutide and semaglutide. Front Endocrinol (Lausanne). 2019;10:155.
Reddy IA, Stanwood GD, Galli A. Moving beyond energy homeostasis: new roles for glucagon-like peptide-1 in food and drug reward. Neurochem Int. 2014;73:49-55.
Lingvay I, Kirk AR, Lophaven S, et al. Outcomes in GLP-1 RA-experienced patients switching to once-weekly semaglutide in a real-world setting: the retrospective, observational EXPERT study. Diabetes Ther. 2021;12(3):879-96.
Iijima T, Shibuya M, Ito Y, et al. Effects of switching from liraglutide to semaglutide or dulaglutide in patients with type 2 diabetes: a randomized controlled trial. J Diabetes Investig. 2023;14(6):774-81.
Tsapas A, Karagiannis T, Kakotrichi P, et al. Comparative efficacy of glucose-lowering medications on body weight and blood pressure in patients with type 2 diabetes: a systematic review and network meta-analysis. Diabetes Obes Metab. 2021;23(9):2116-24.
Jain AB, Ali A, Gorgojo Martínez JJ, et al. Switching between GLP-1 receptor agonists in clinical practice: expert consensus and practical guidance. Int J Clin Pract. 2021;75(2):e13731.
Wu DM, Shen MH, Chu NF. Relationship between plasma leptin levels and lipid profiles among school children in Taiwan--the Taipei Children Heart Study. Eur J Epidemiol. 2001;17(10):911-6.
Stadler JT, Marsche G. Obesity-related changes in high-density lipoprotein metabolism and function. Int J Mol Sci. 2020;21(23):8985.
Lundåsen T, Liao W, Angelin B, et al. Leptin induces the hepatic high density lipoprotein receptor scavenger receptor B type I (SR-BI) but not cholesterol 7alpha-hydroxylase (Cyp7a1) in leptin-deficient (ob/ob) mice. J Biol Chem. 2003;278(44):43224-8.
Williams DL, Baskin DG, Schwartz MW. Leptin regulation of the anorexic response to glucagon-like peptide-1 receptor stimulation. Diabetes. 2006;55(12):3387-93.
Williams DL, Hyvarinen N, Lilly N, et al. Maintenance on a high-fat diet impairs the anorexic response to glucagon-like-peptide-1 receptor activation. Physiol Behav. 2011;103(5):557-64.
Martins FF, Santos-Reis T, Marinho TS, et al. Hypothalamic anorexigenic signaling pathways (leptin, amylin, and proopiomelanocortin) are semaglutide (GLP-1 analog) targets in obesity control in mice. Life Sci. 2023;313:121268.
