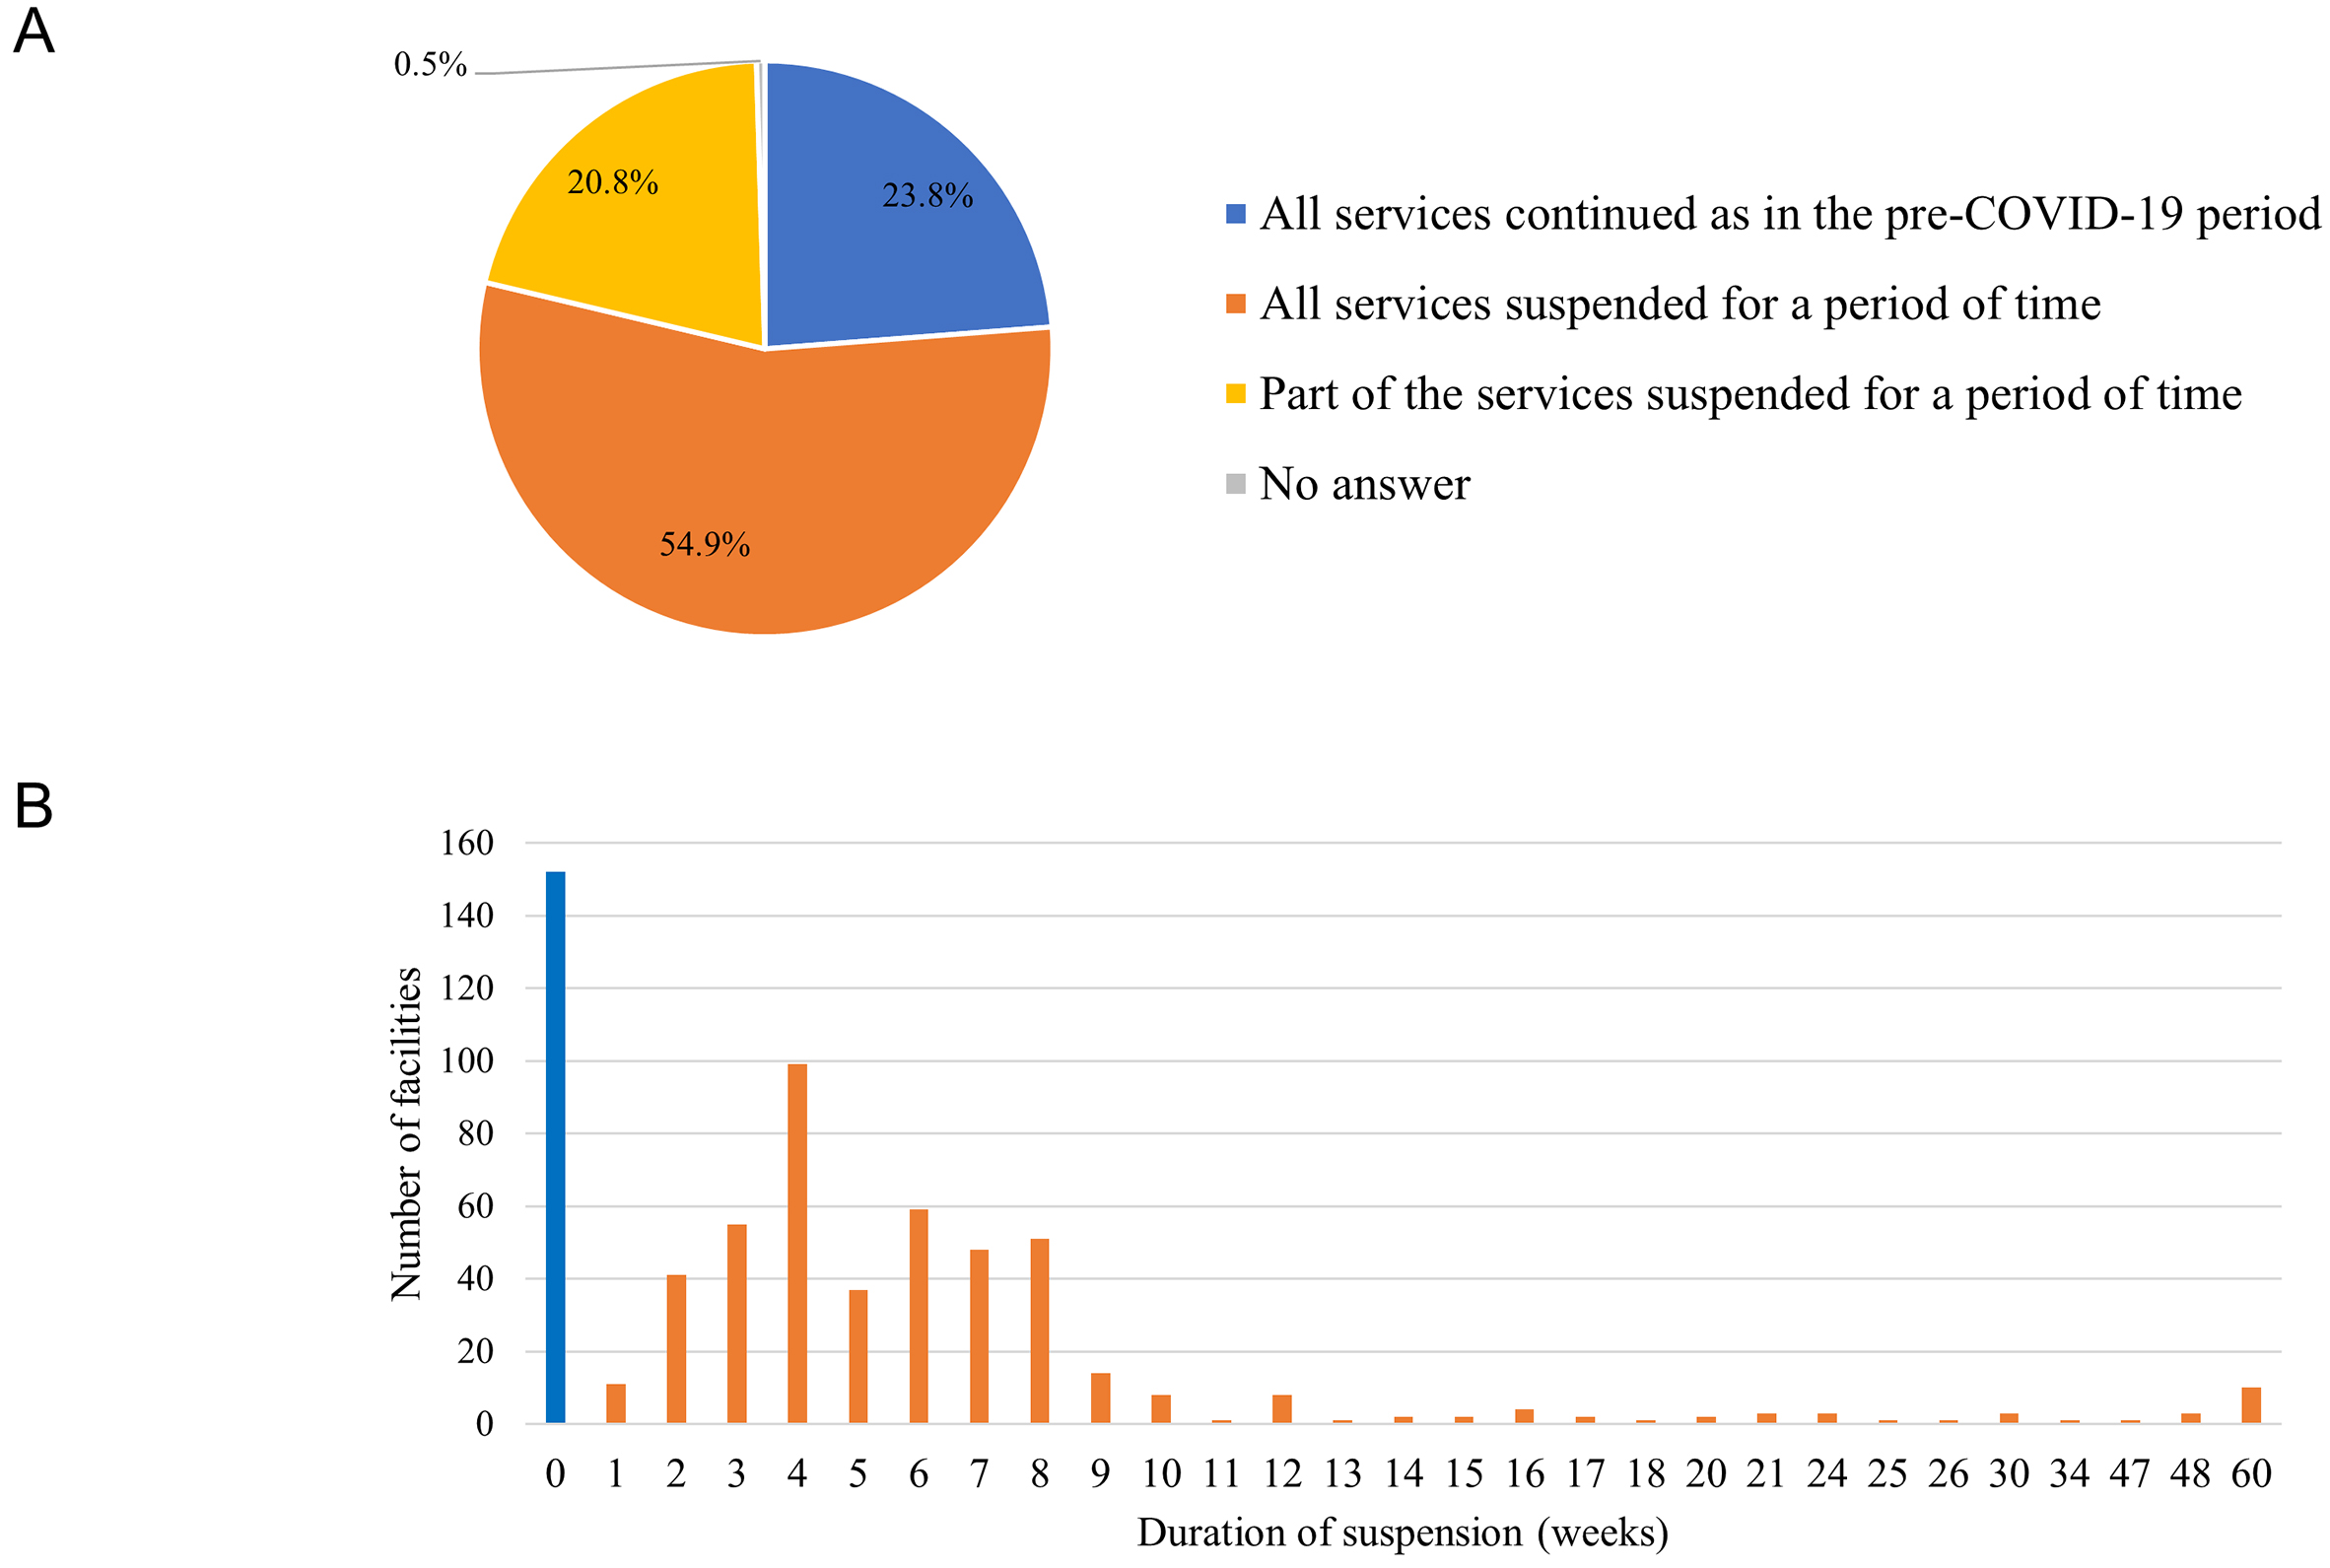
Figure 1. Suspension of health check-up services during the pandemic in healthcare facilities. (A) Facilities were asked whether they suspended all or part of the services (n = 639) (B) Duration of service suspension (n = 624).
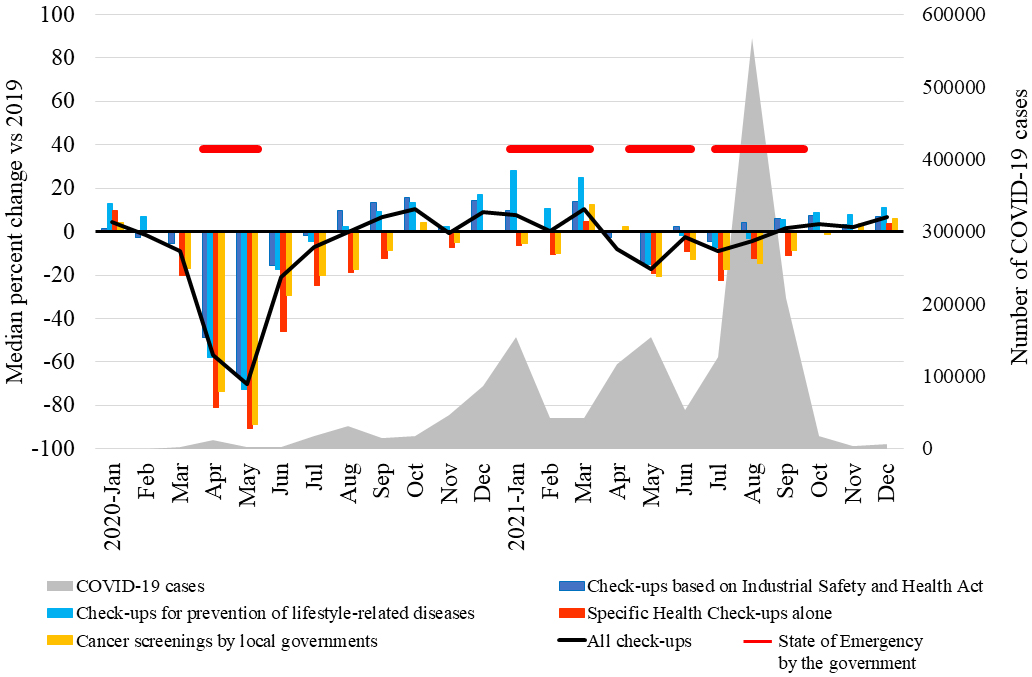
Figure 2. Changes in the monthly number of examinees undergoing health check-ups. Supplementary Table 2 shows the median percentage changes compared to that in the same month in 2019 and IQR
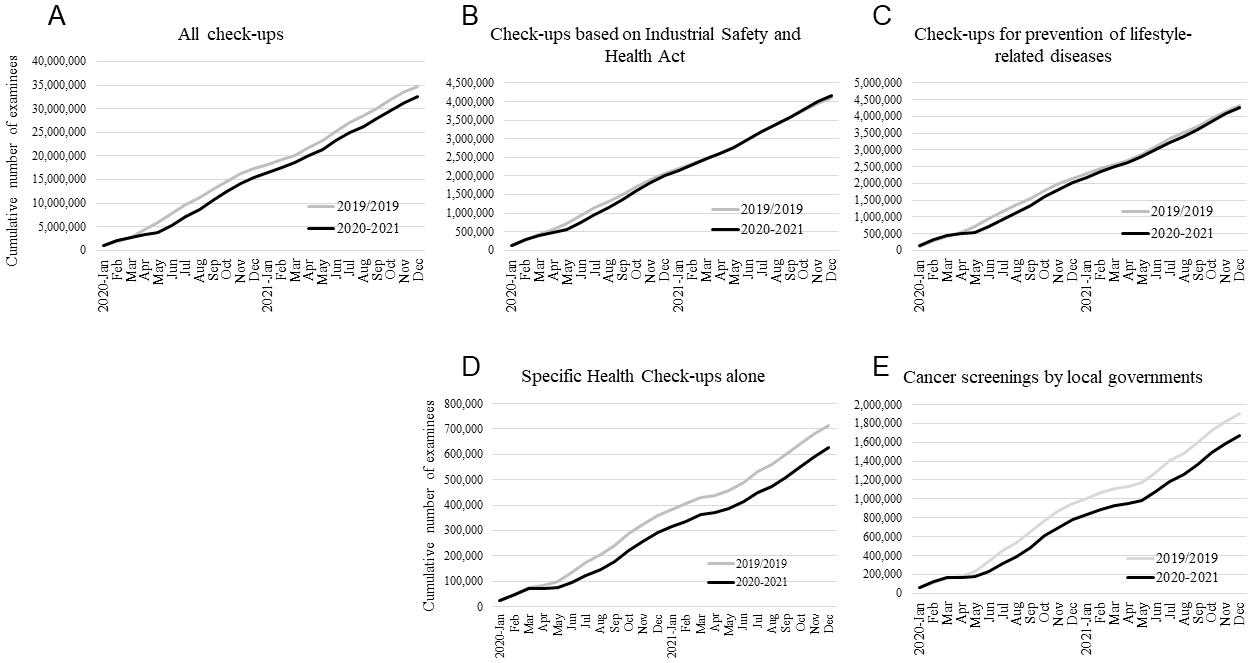
Figure 3. Cumulative numbers of examinees undergoing health check-ups between January 2020 and December 2021. Cumulative numbers of examinees in 2020 and 2021 (black lines) were compared to those in the pre-COVID-19 year (2019) (gray lines) for (A) all check-ups, (B) check-ups based on the Industrial Safety and Health Act, (C) check-ups for the prevention of lifestyle-related diseases, (D) specific health check-ups alone, and (E) cancer screenings by local governments.
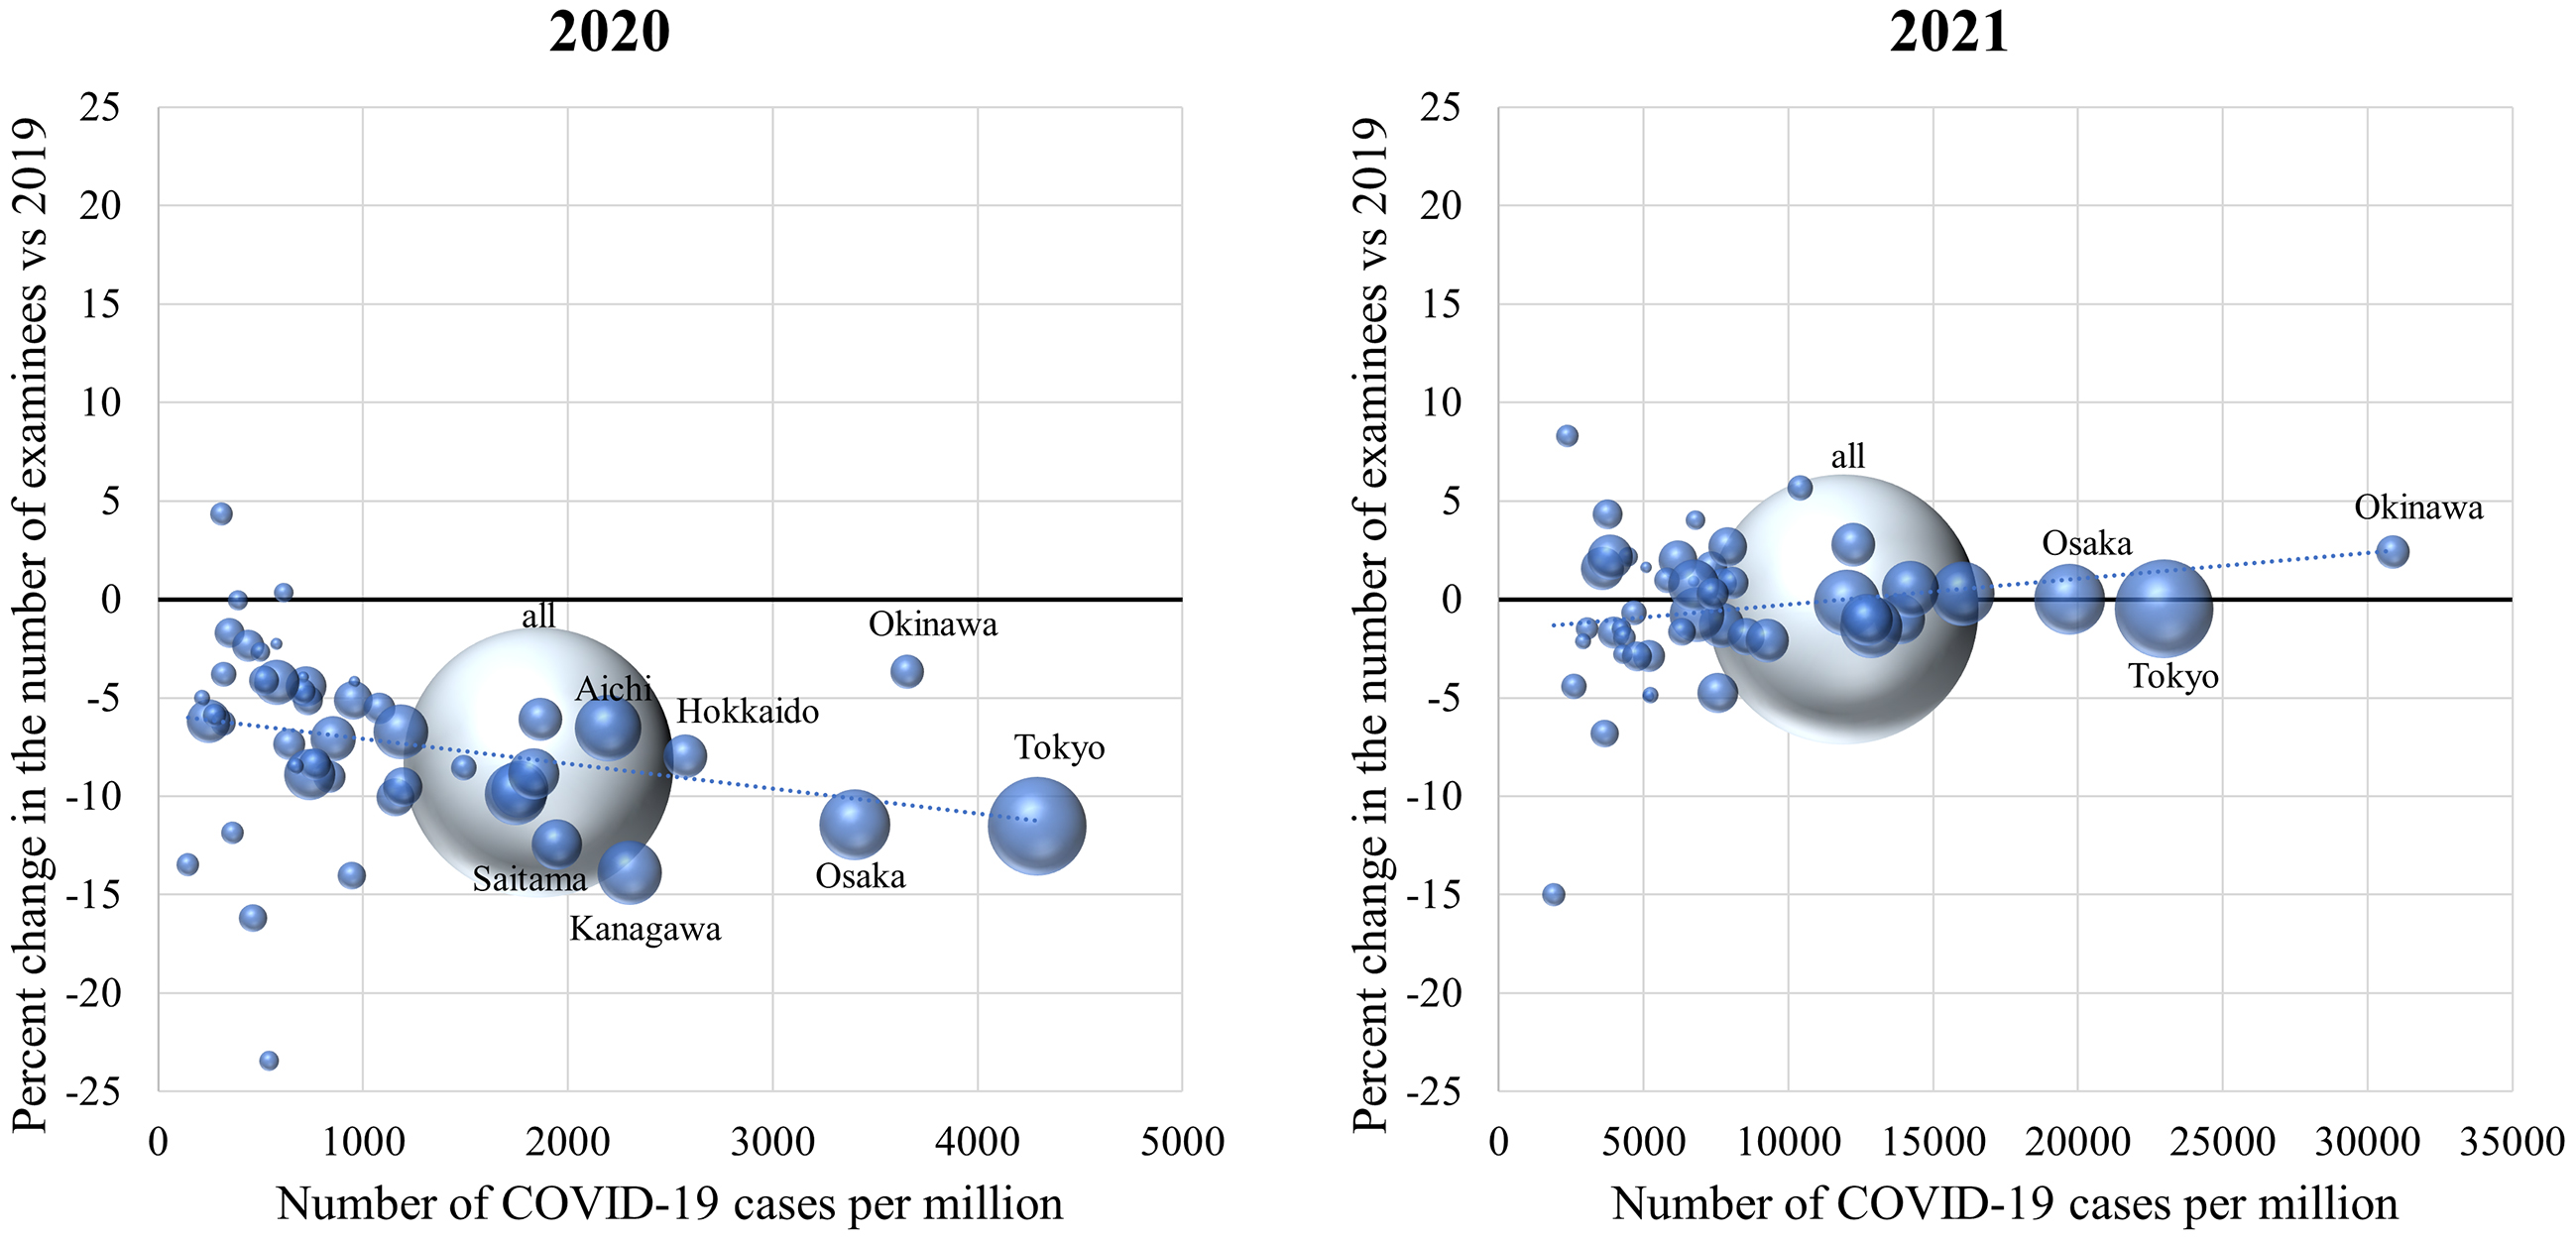
Figure 4. Regional differences in the magnitude of reduction in health check-ups. The magnitudes of reduction in the number of examinees and infection rates of COVID-19 in each prefecture in 2020 (left panel) and 2021 (right panel) are shown. The volume of each sphere represents the numbers of facilities that participated in the survey.