Figure 1. Time course of the COVID-19 infection rates and geographical relationship among Honshu, Awaji Island, and Shikoku.
Japan (fine dotted line), Hyogo Prefecture (coarse dotted line), and Awaji Island (solid line).

From: Impact of the Coronavirus Disease 2019 Pandemic on Medical Practices in Awaji Island
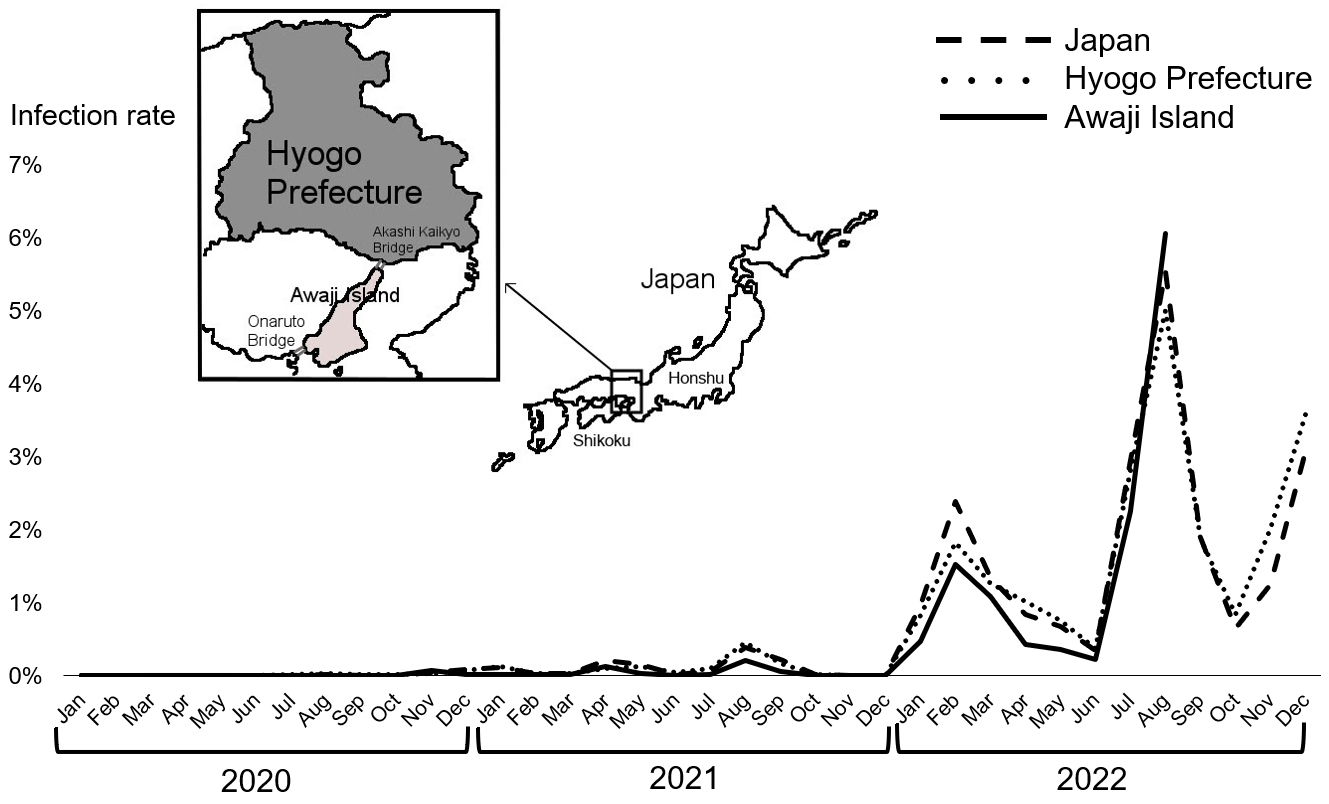
Figure 2. Changes in the number of outpatients.
Annual number of ordinary and emergency outpatients at our hospital in the pre- and during the pandemic periods.

From: Impact of the Coronavirus Disease 2019 Pandemic on Medical Practices in Awaji Island

Figure 3. Changes in the number of inpatients.
a. Annual number of total hospitalized patients in the pre- and during the pandemic periods.
b. Monthly number of hospitalized patients during the pandemic (total and COVID-19 hospitalizations and the restrictions in hospitalizations and surgeries).

From: Impact of the Coronavirus Disease 2019 Pandemic on Medical Practices in Awaji Island

Figure 4. Disease composition of hospitalized patients in the pre- and during the pandemic periods.
Diseases of patients treated in the hospital are represented with percentages. Note that the disease composition ratio did not show changes between the pre- and during the pandemic periods.

From: Impact of the Coronavirus Disease 2019 Pandemic on Medical Practices in Awaji Island
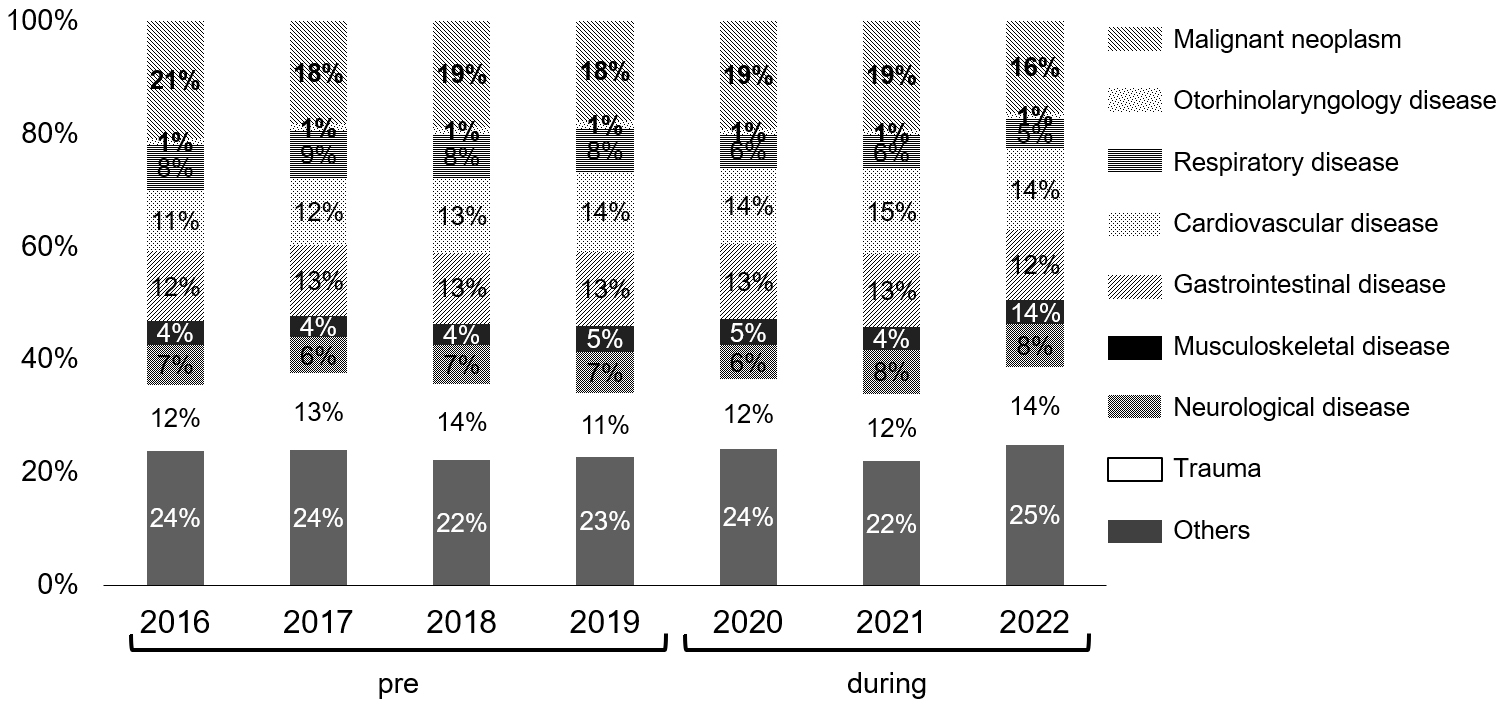
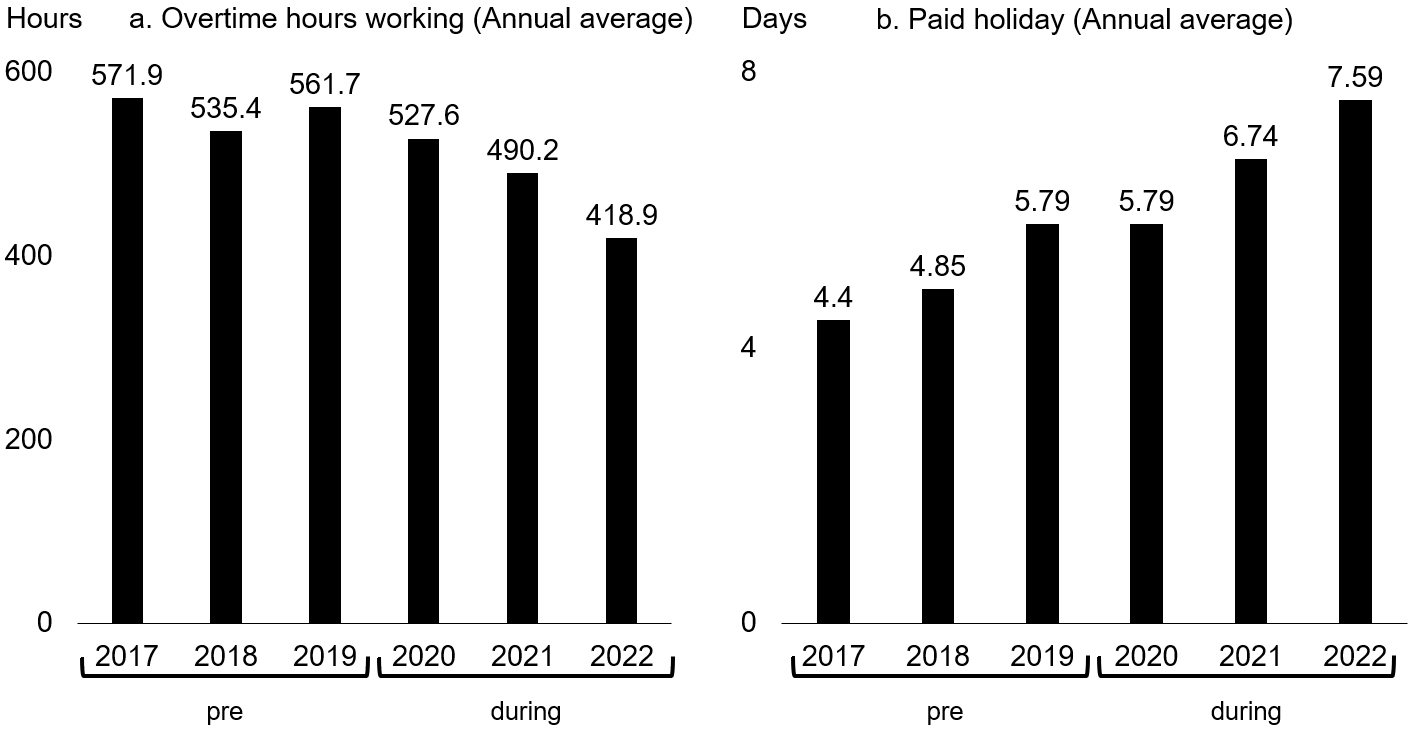
Figure 5. Changes in the work style of full-time doctors.
a. overtime hours (annual average)
b. paid holidays (annual average)

From: Impact of the Coronavirus Disease 2019 Pandemic on Medical Practices in Awaji Island
PAGE TOP