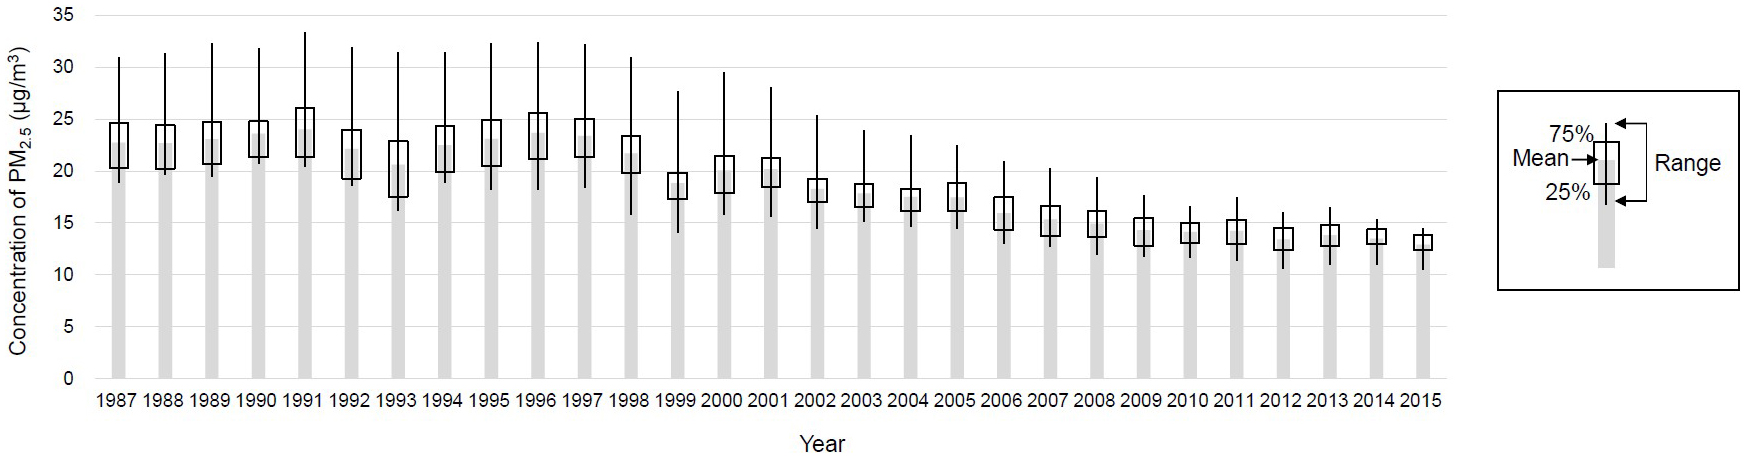
Figure 1. Ambient PM2.5 concentration in the study region
We previously developed a national-scale PM2.5 exposure model for Japan using measurements recorded between 2014 and 2016 to estimate means at a resolution of 1 × 1 km for the years 1987-2015. Data were reconstructed for suitability for the Ibaraki Prefectural Health Study, presenting a heat map for 1987-1995 as the exposure period. The original analytical methods and general results are described elsewhere (17).
From: Particulate Matter and Incident Chronic Kidney Disease in Japan: The Ibaraki Prefectural Health Study (IPHS)
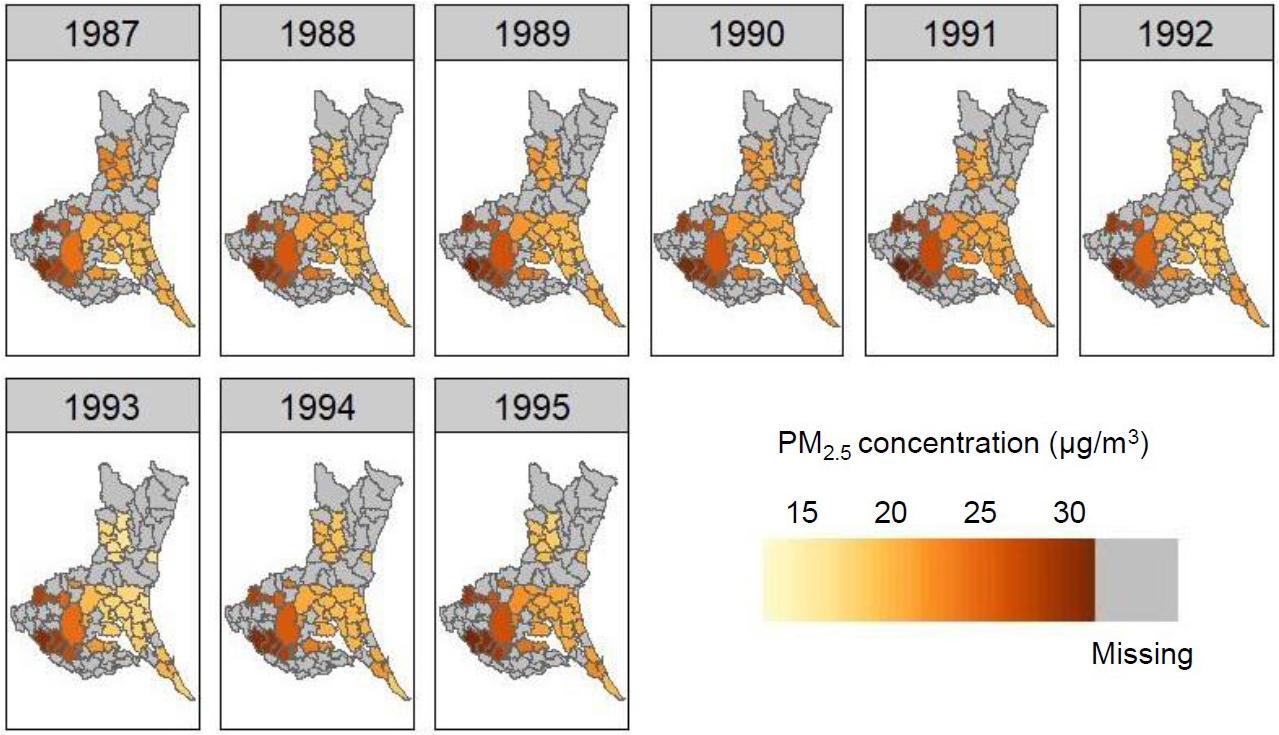
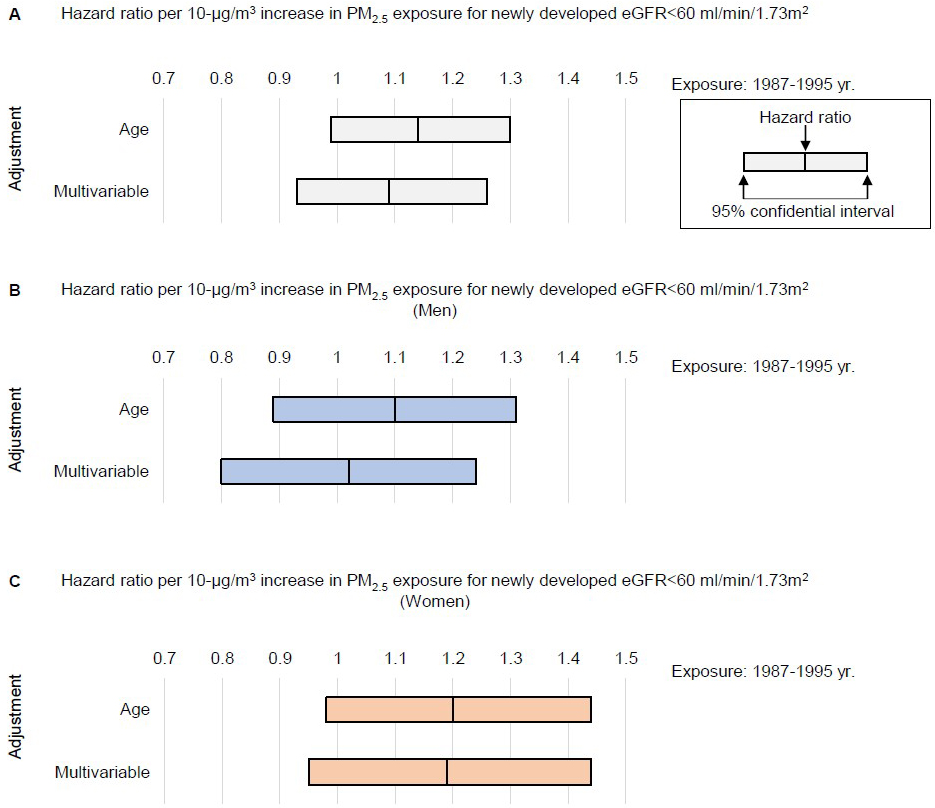
Figure 3. Hazard ratio of PM2.5 concentration for newly developed kidney dysfunction.
Age-adjusted and multivariable-adjusted hazard ratio per 10-μg/m3 increase in PM2.5 exposure for incidence of eGFR of <60 ml/min/1.73 m2 during follow-up (A). The model was adjusted for sex, age, body mass index, blood pressure, total cholesterol, high-density lipoprotein cholesterol, glucose, treatment for diabetes, treatment for hypertension, treatment for hyperlipidemia, current smoking habit, drinking habit, and dipstick proteinuria at the baseline year of 1993. Exposure information for means of 1987-1995 was employed. HRs were also evaluated in men (B) and in women (C).
From: Particulate Matter and Incident Chronic Kidney Disease in Japan: The Ibaraki Prefectural Health Study (IPHS)