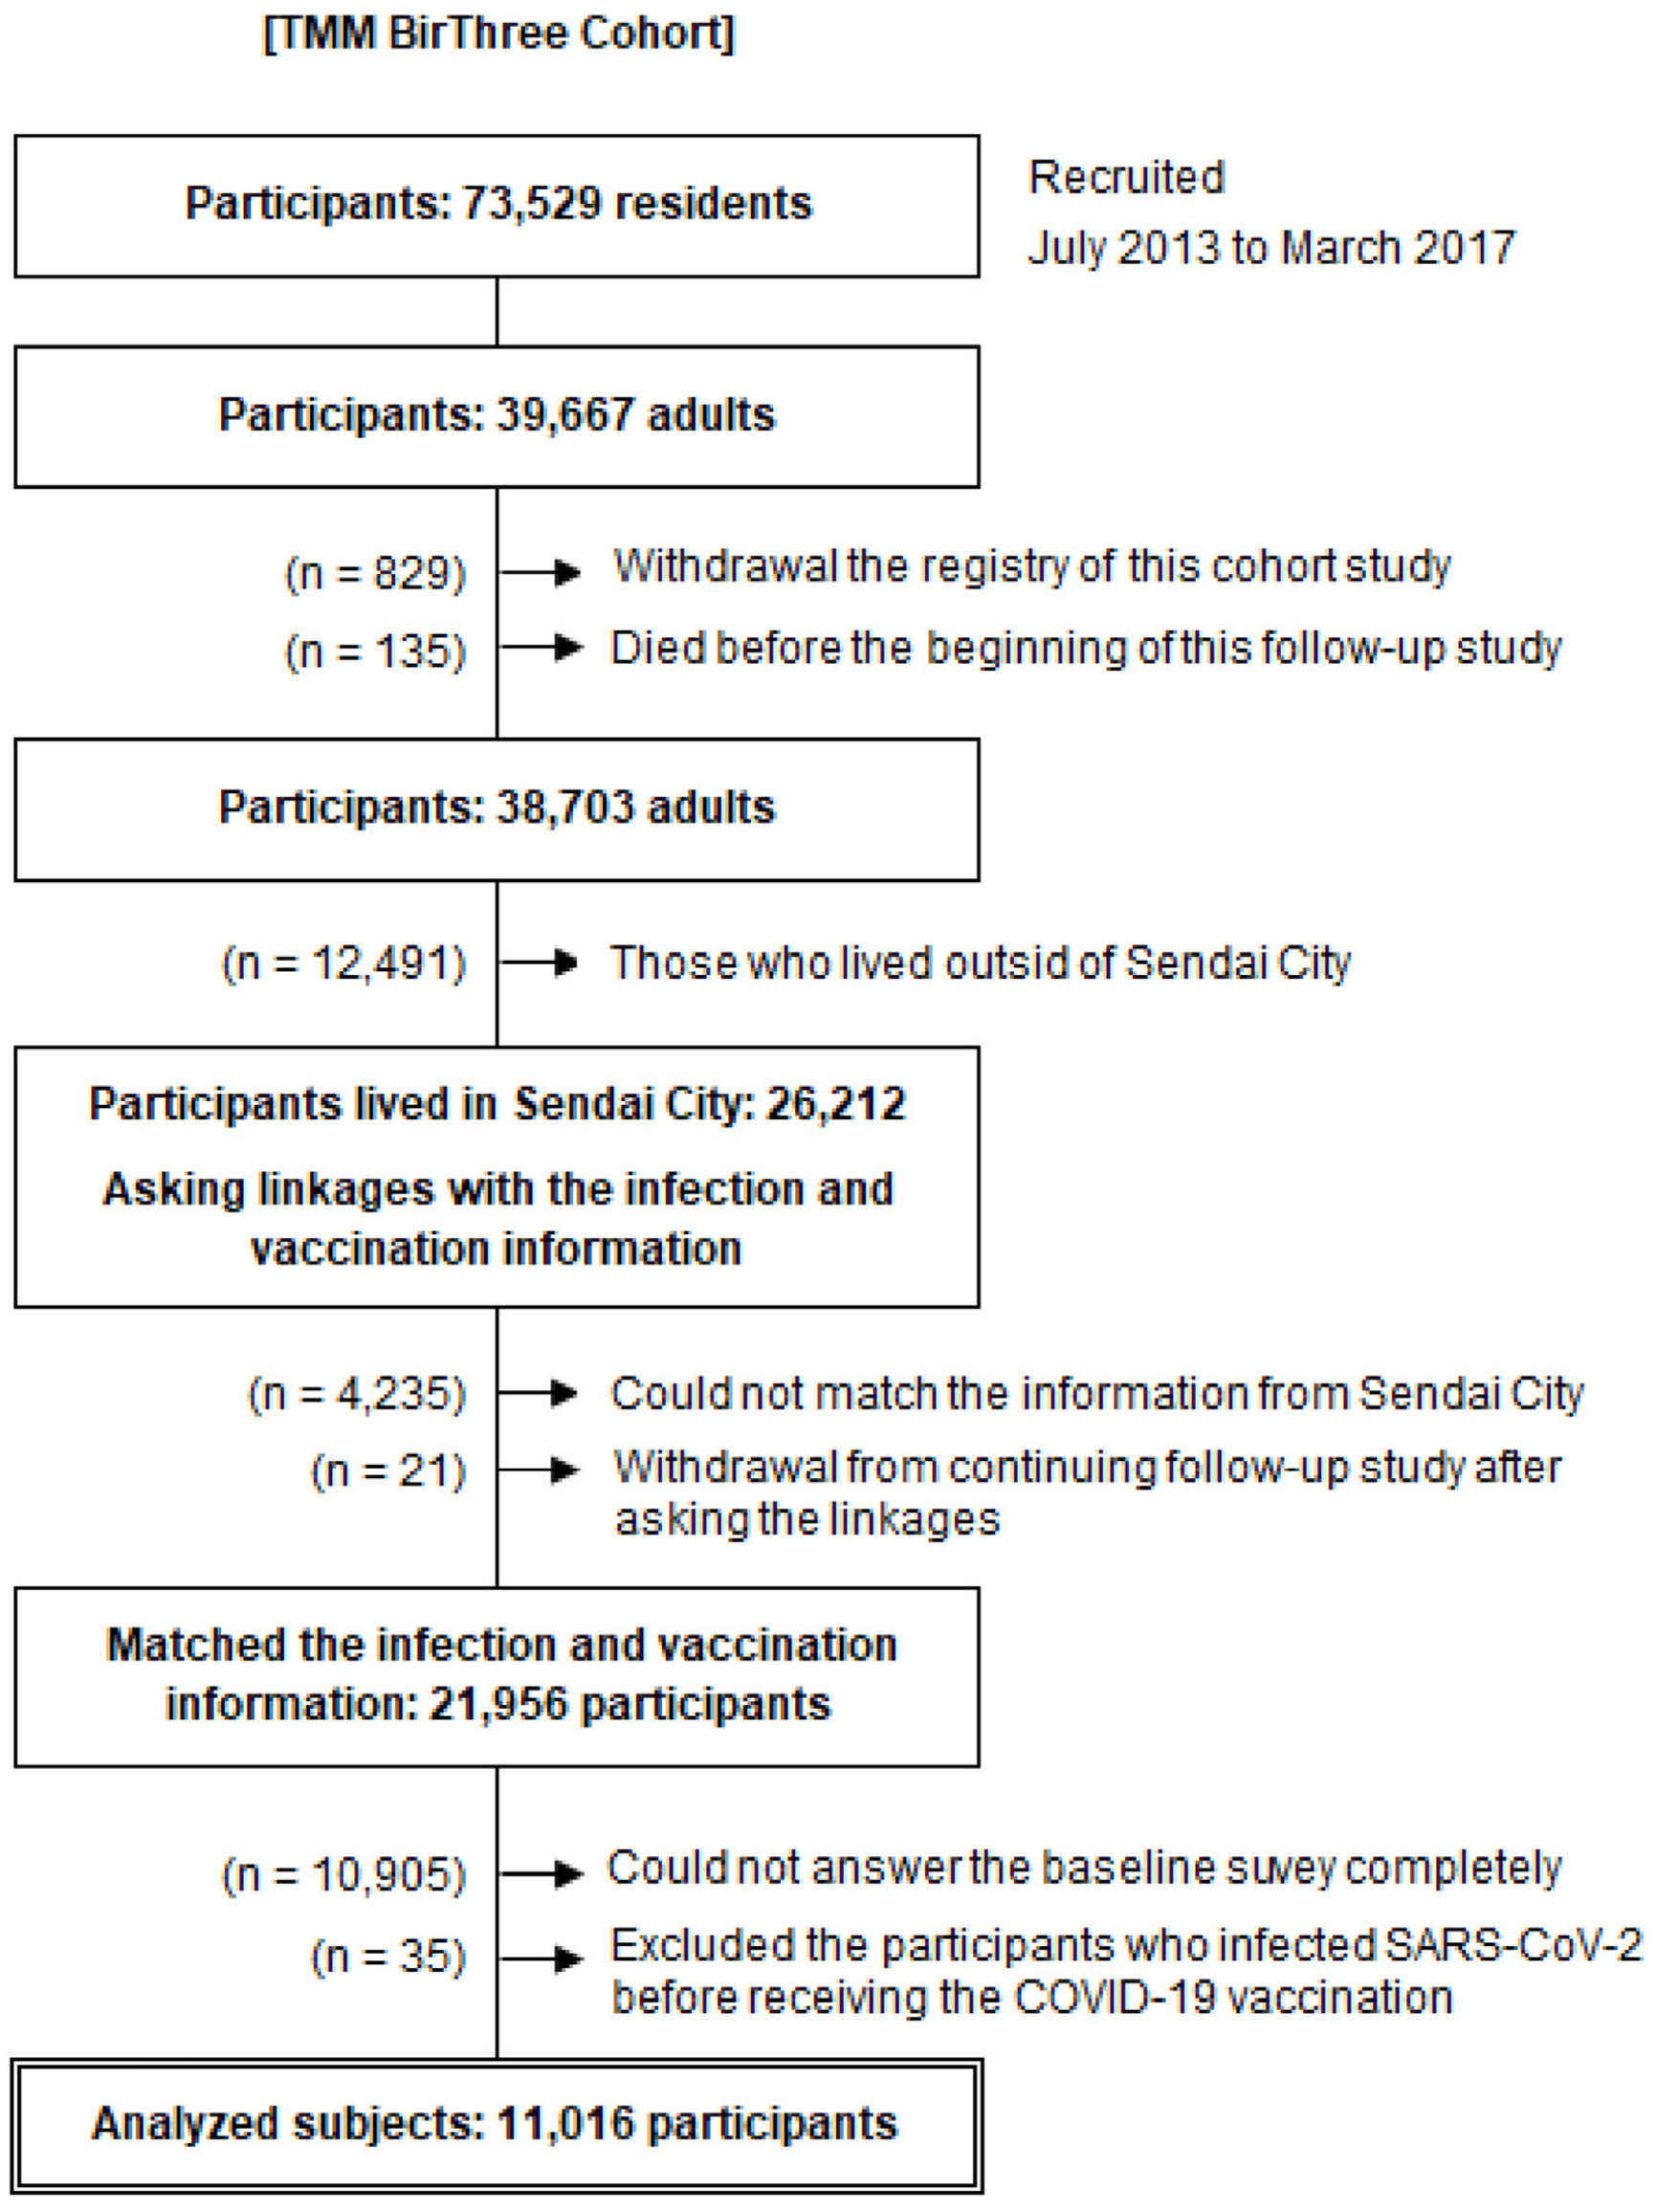
Figure 1. Participants of the TMM BirThree Cohort Study cohort and analyzed subjects The TMM BirThree Cohort Study recruited 73,529 participants from July 2013 to March 2017, of whom 39,667 were adults. Among the adult participants, 26,212 who were residing in Sendai City were linked to the information on the COVID-19 vaccination and SARS-CoV-2 infection. Finally, 11,016 adult participants who completed the questionnaire were analyzed.
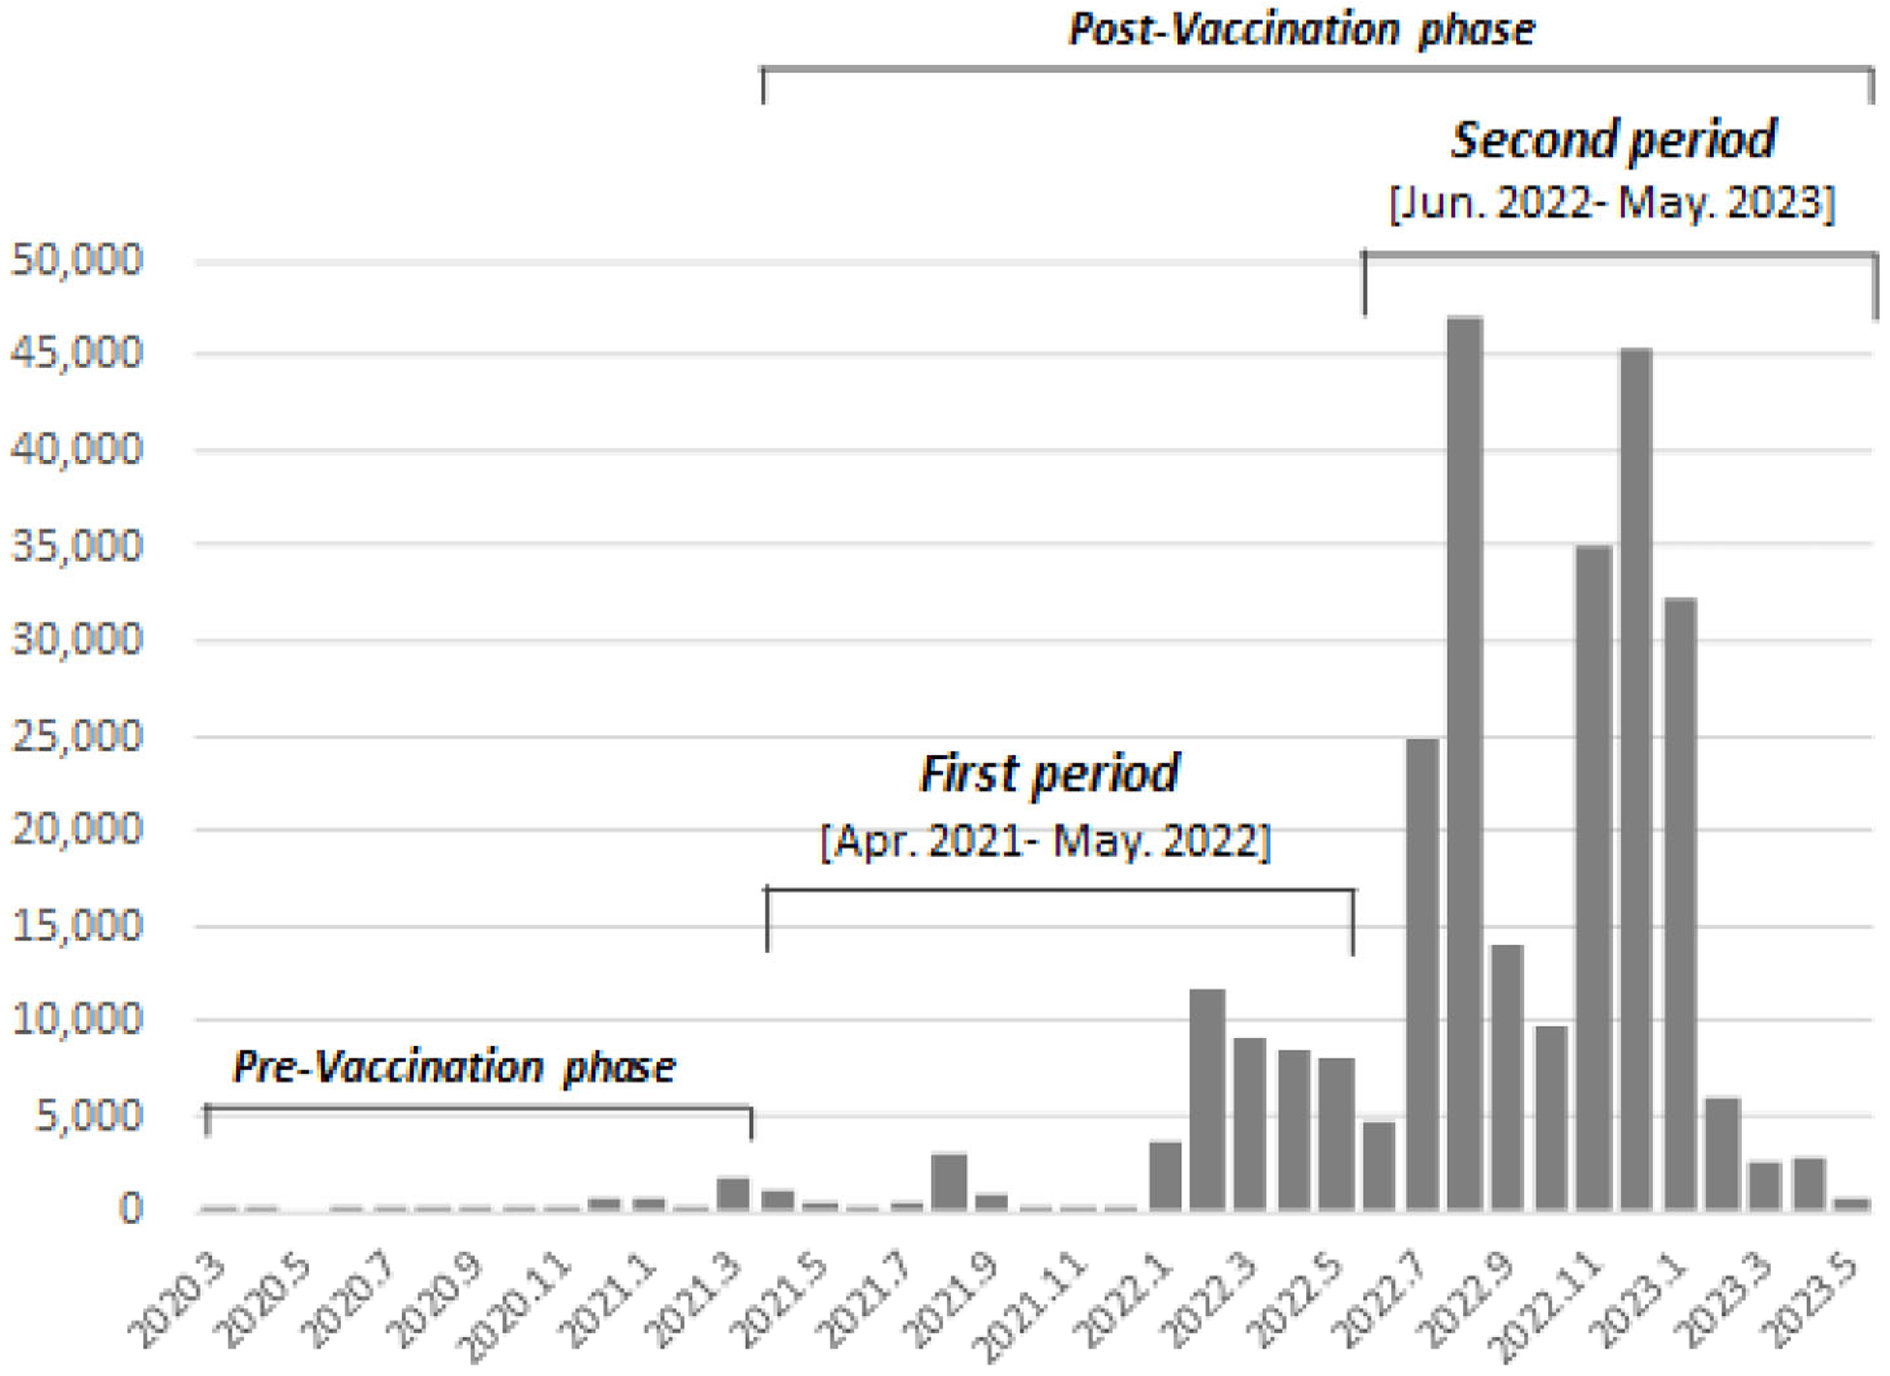
Figure 2. Number of SARS-CoV-2 cases and definition of the two periods The first period was from April 2021 to May 2022, which was the beginning phase of the COVID-19 vaccination program targeting the entire adult population. The second period was from June 2022 onward, which was initiated with a fourth shot targeting the elderly, those who have underlying health conditions, and healthcare professionals.
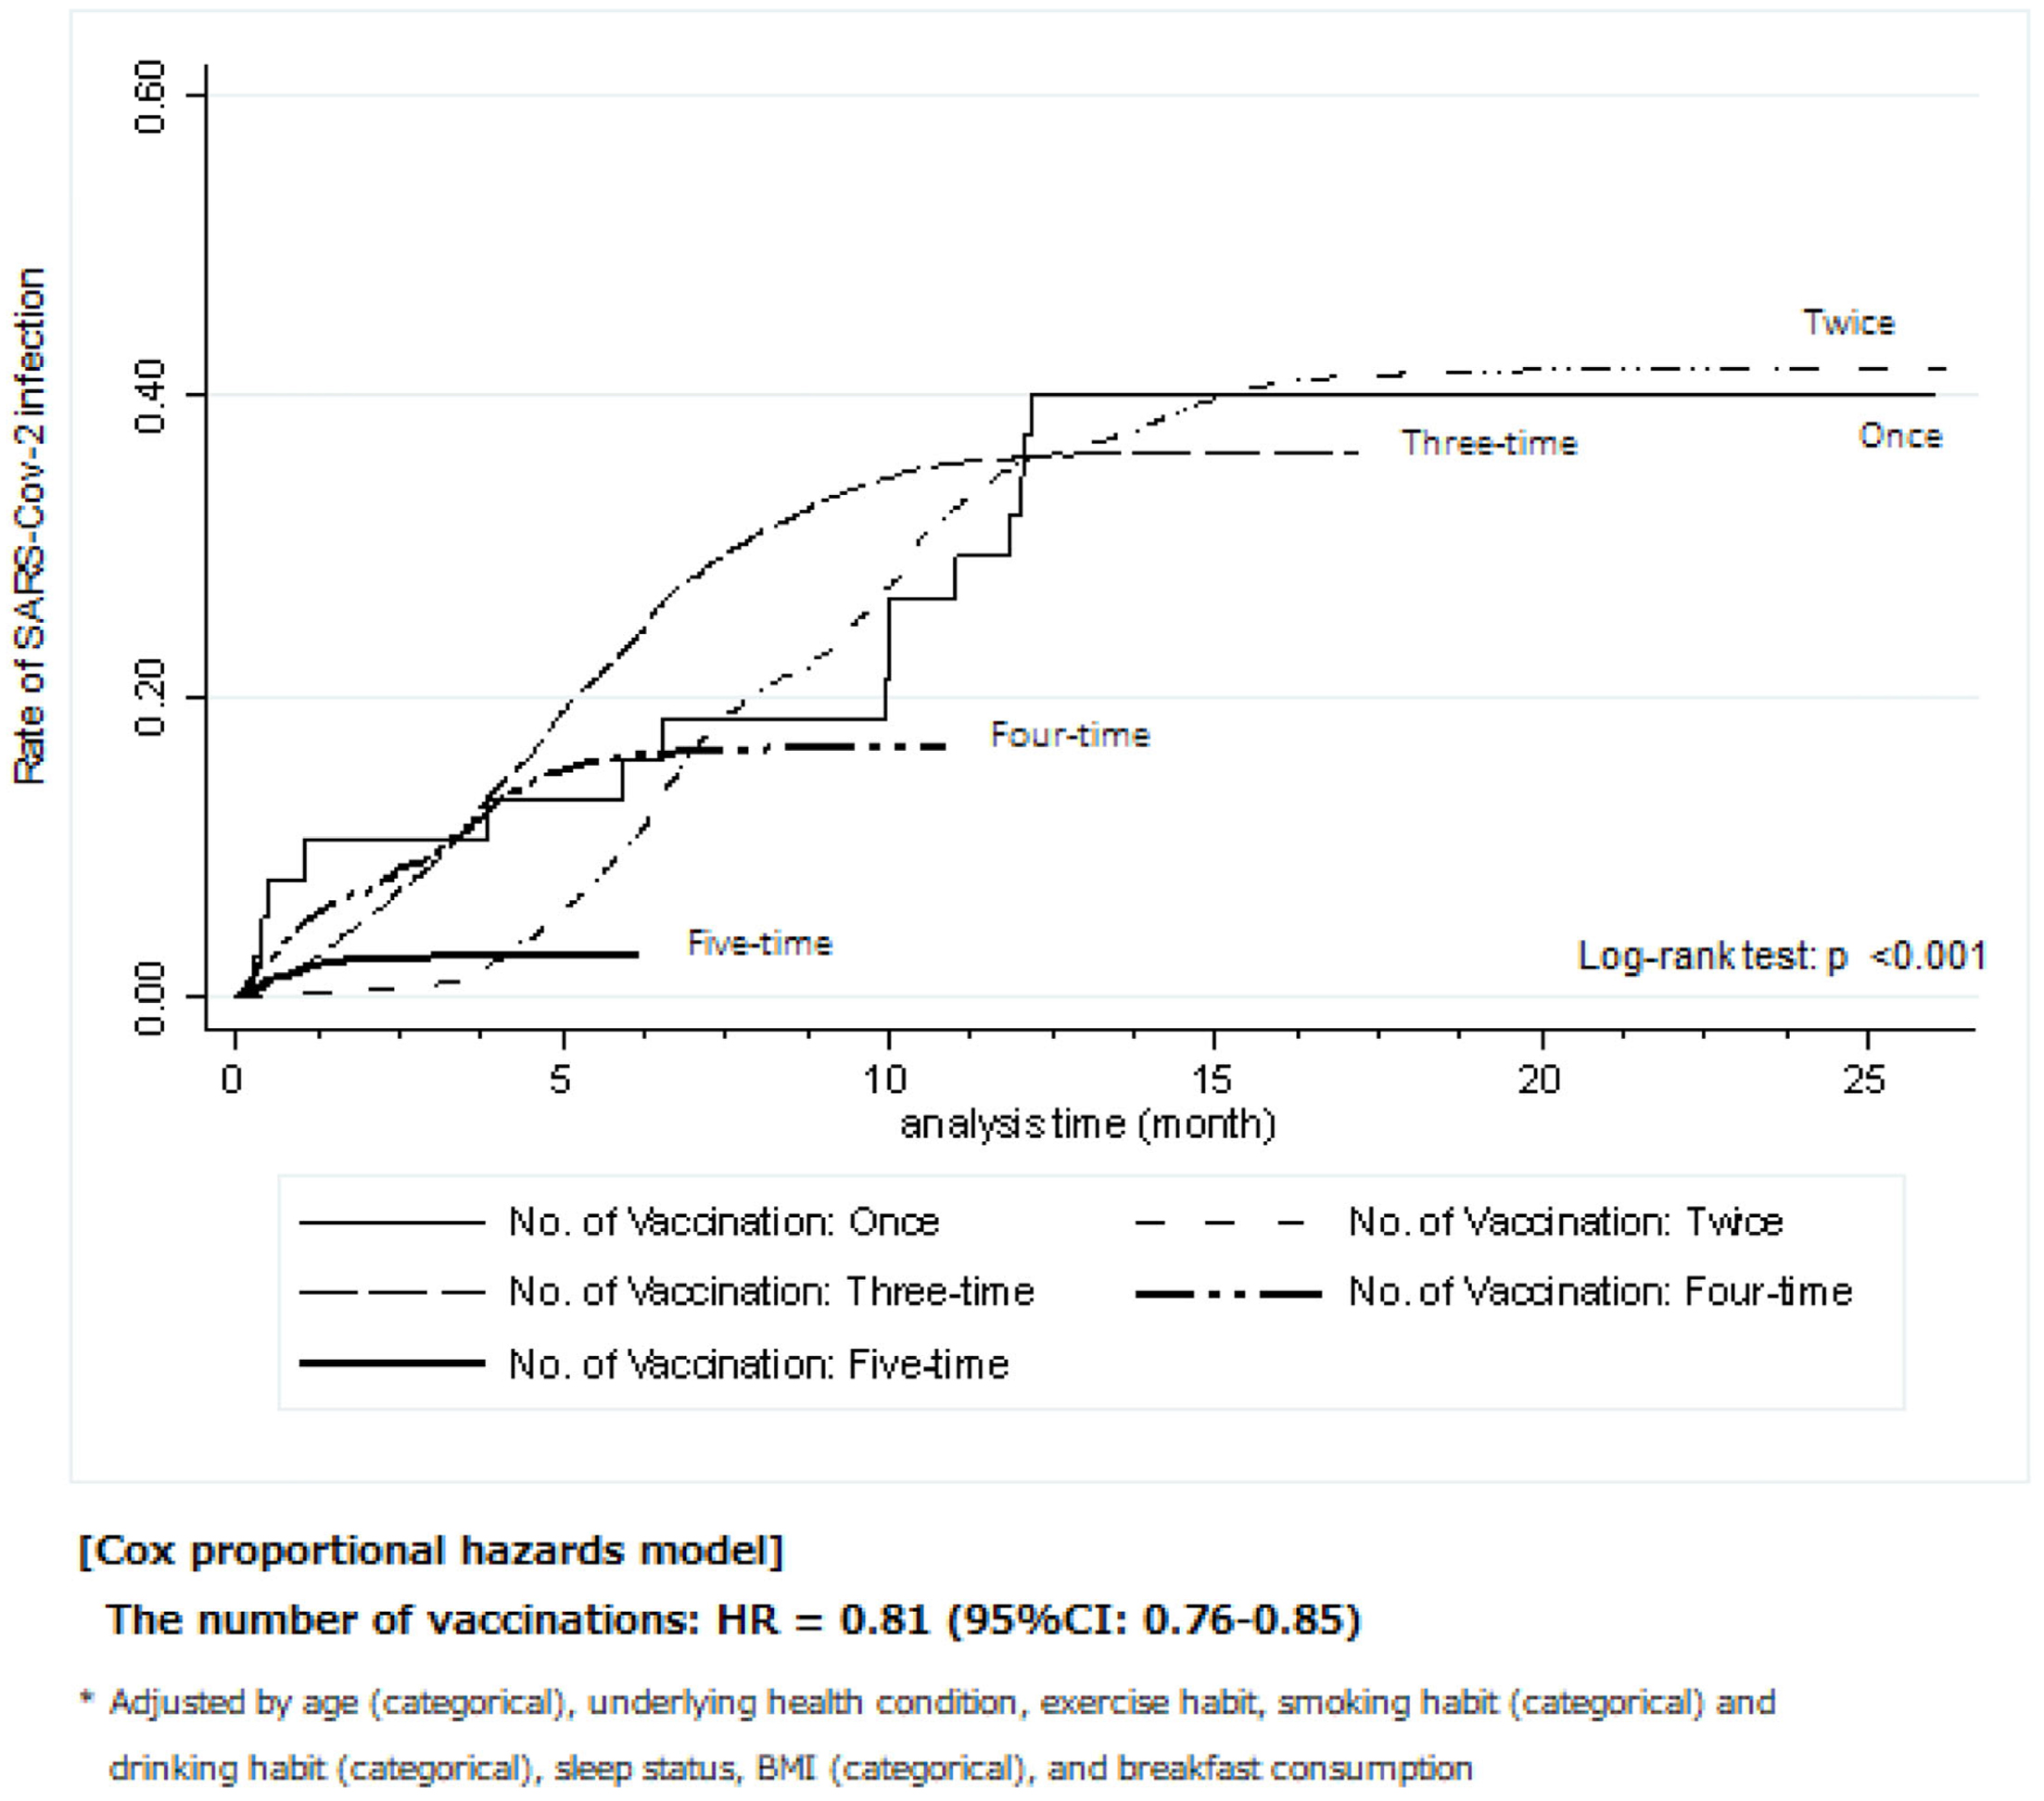
Figure 3. Time-dependent variables of the final date of vaccination and SARS-CoV-2 infection (first and second periods: 2021.4-2023.5) Vertical axis: Rate of SARS-CoV-2 infection. Horizontal axis: Analysis time (months). Cox proportional-hazards model analysis was conducted while adjusting for age (categorical), underlying health conditions, exercise habits, smoking and drinking habits (categorical), sleep status, body mass index (categorical), and breakfast consumption.
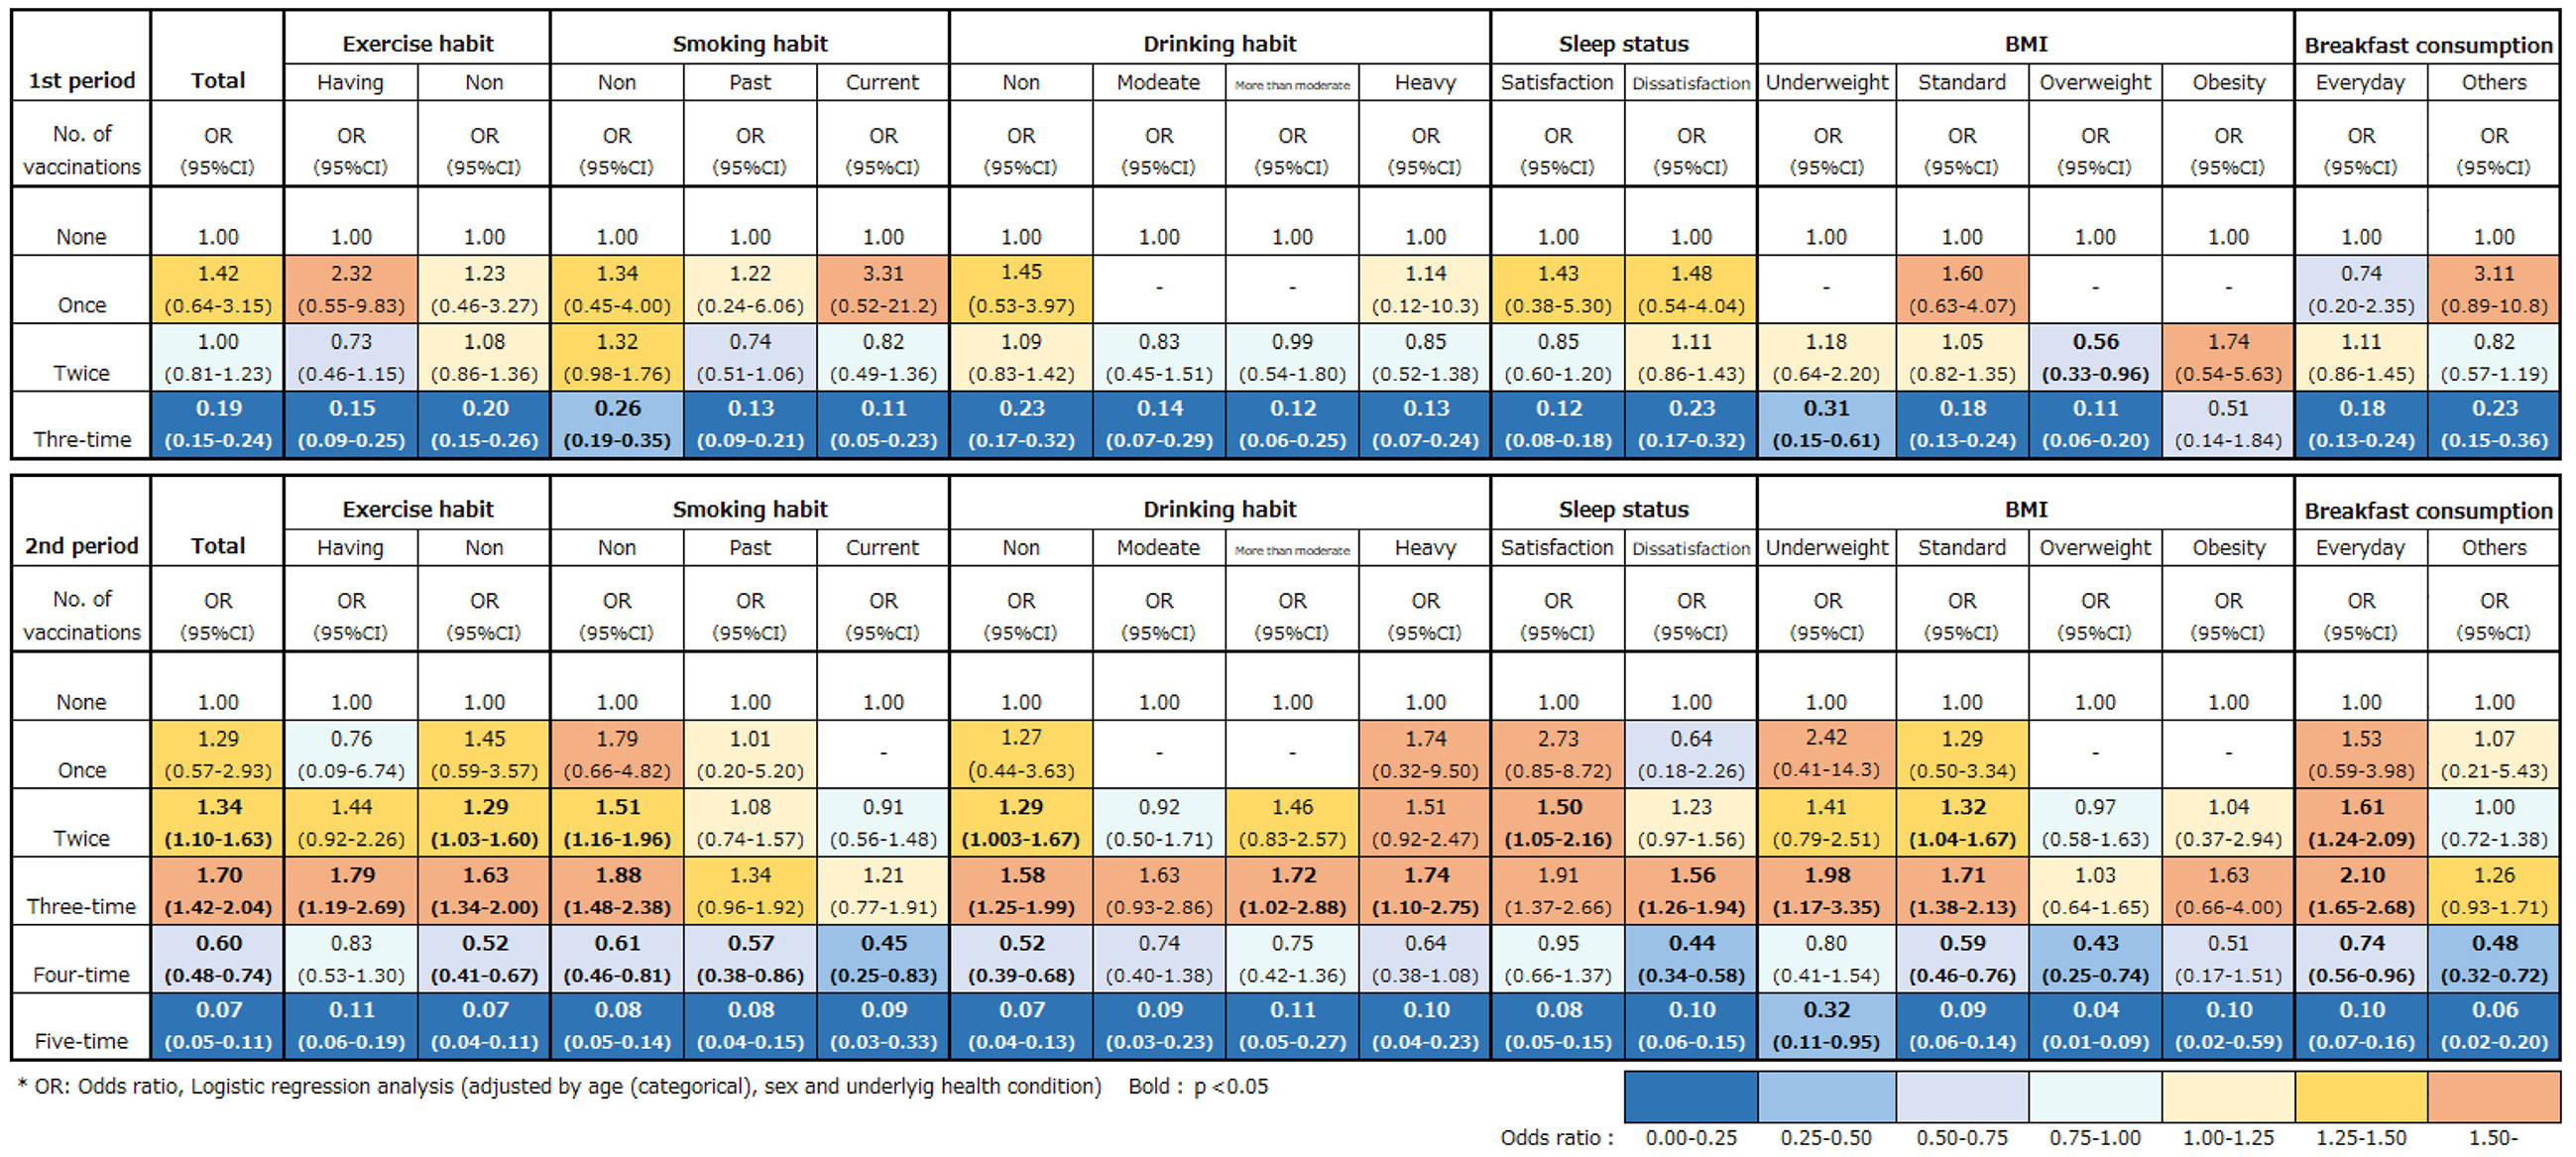
Figure 4. Visualization of interaction between lifestyle habits and the number of vaccinations against SARS-CoV-2 infection Logistic regression analyses were conducted stratifying the lifestyle variables. The figure in the upper portion illustrates the first period, whereas that in the lower portion shows the second period. Blue indicates lower risk of SARS-CoV-2 infection, whereas red indicates higher risk of infection.