Figure 1. Predicted probability distribution of CKD progression determined from changes in CKD severity classification.
The heat map shows the patient distribution according to CKD severity classification predicted by SVM, with blue representing high-probability distribution and red representing low-probability distribution.
A. Patient distribution prediction: The horizontal axis represents the 2009 CKD severity classification, and the vertical axis represents the expected CKD severity classification in 20xx.
B. Patient distributions in 2009 and 2015: The horizontal axis represents the 2009 CKD severity classification, and the vertical axis represents the 2015 CKD severity classification. Even if a patient was at low risk in 2009, they may become at high risk later (→ in Figure B).
From: Development of Artificial Intelligence Systems for Chronic Kidney Disease
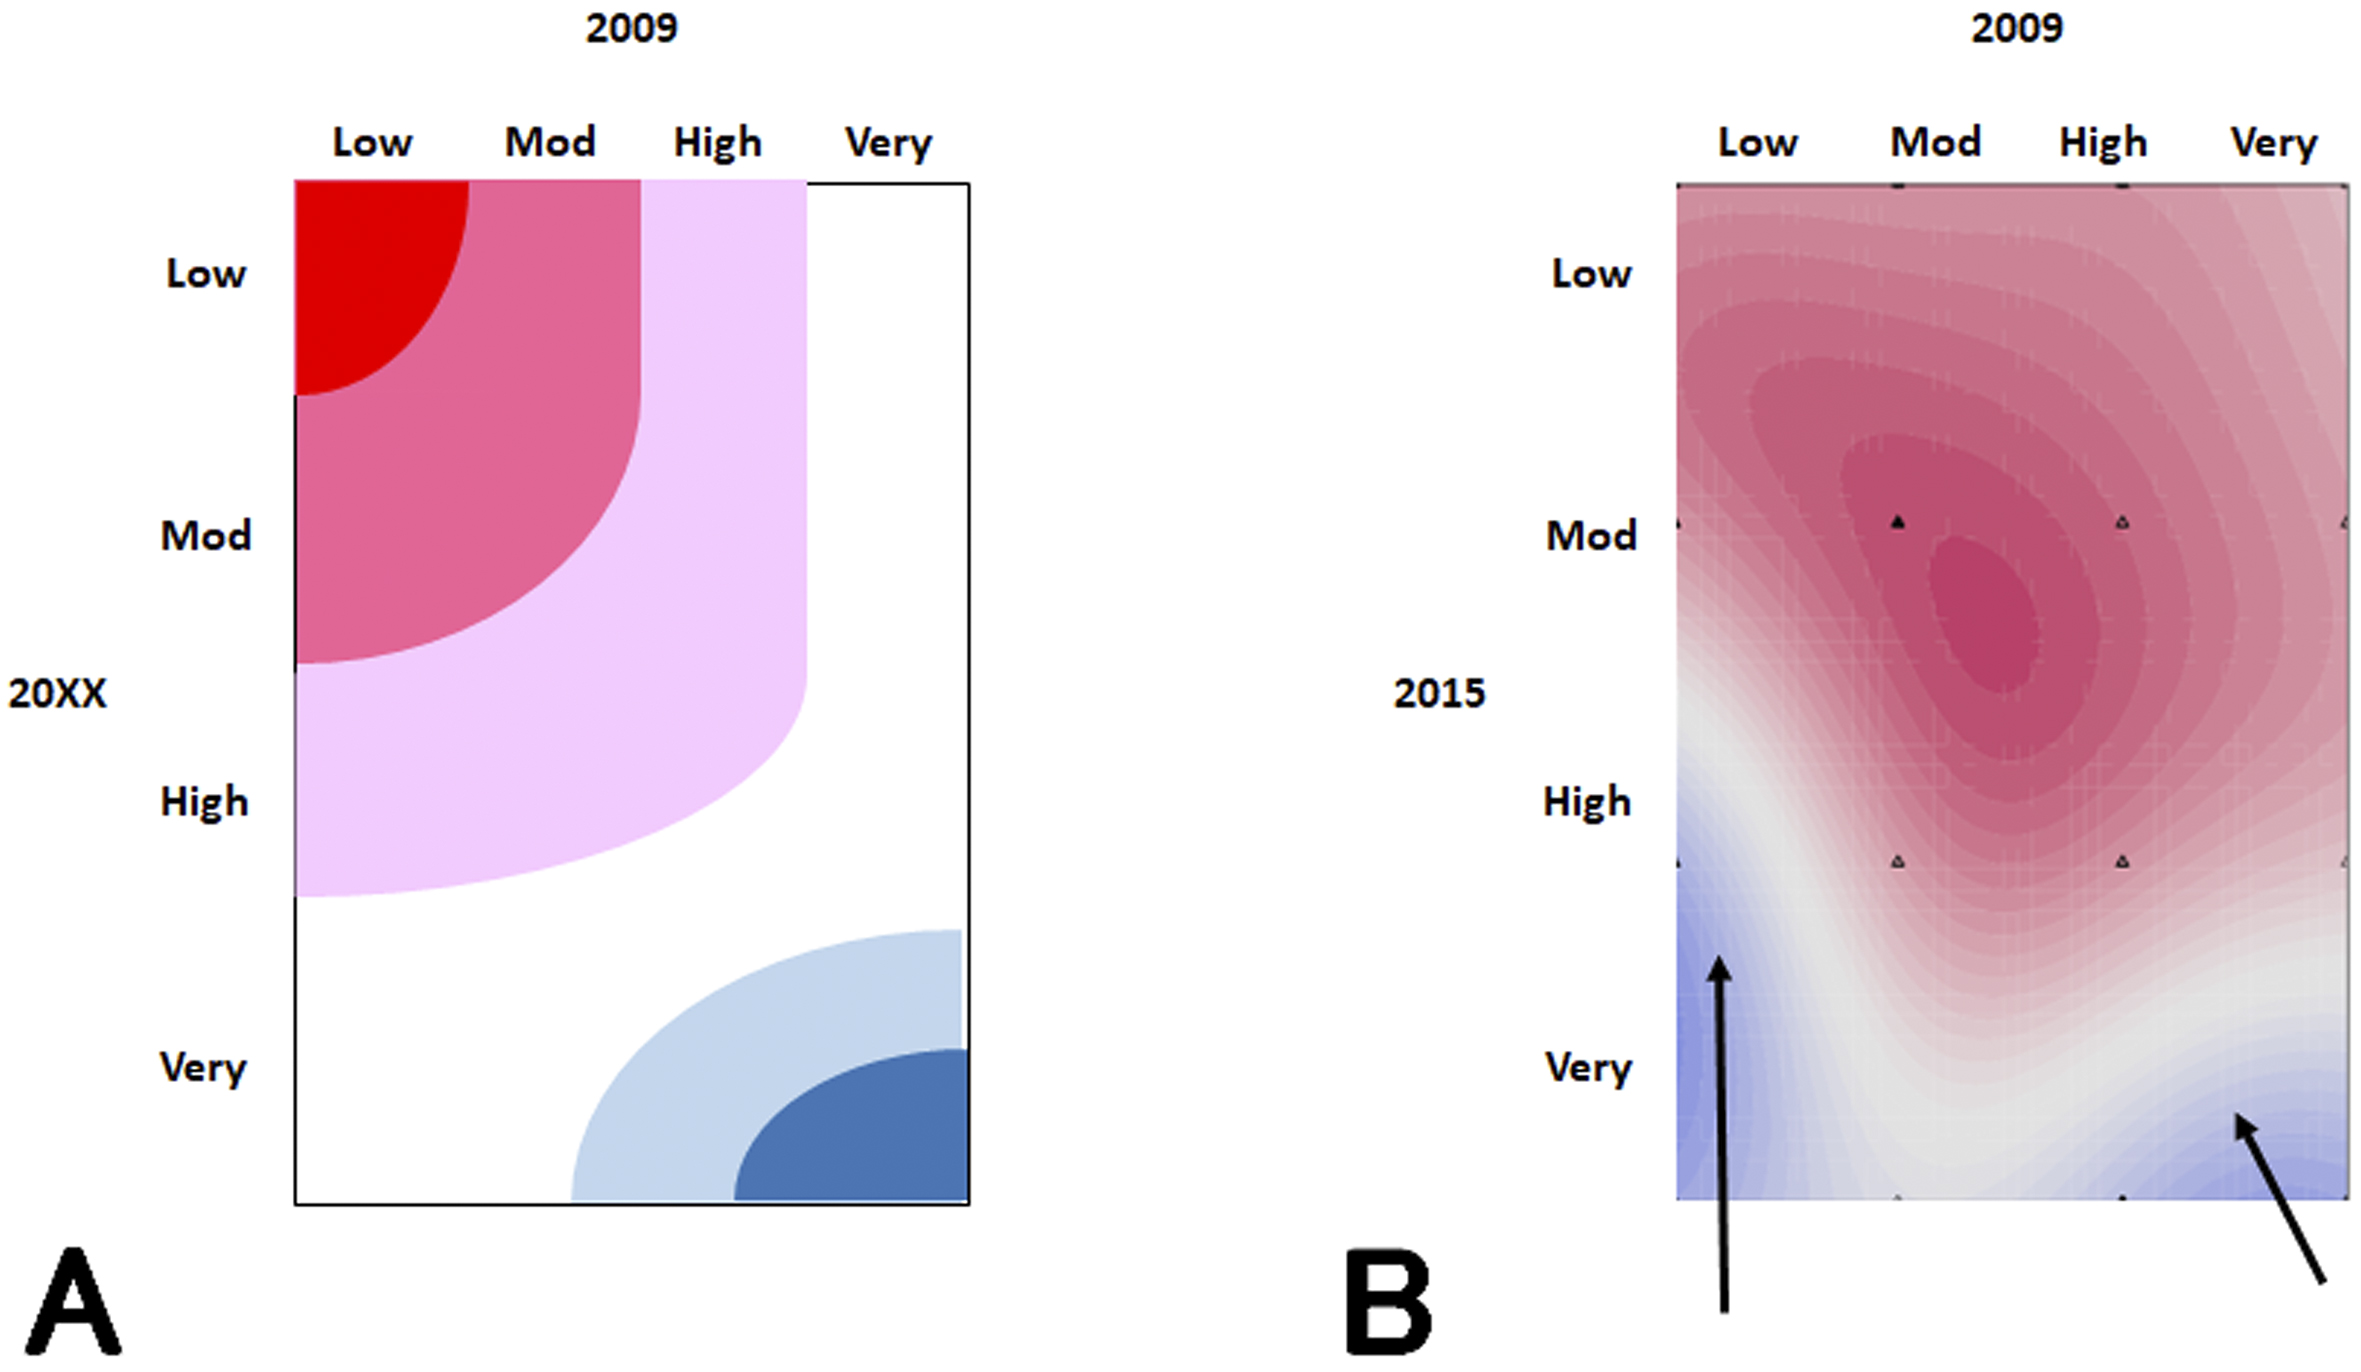
Figure 2. Ensemble model for prediction of prognoses of dialysis patients.
A. Model structure: The ensemble model created in this research study consists of five groups and an SVM for each. Patients are classified into one group using the k-means method and analyzed using SVM. Prognosis is predicted from the integrated results.
B. Relationship between cluster and 5-year survival rate: Group 1 had the best prognosis and Group 5 had the worst prognosis.
From: Development of Artificial Intelligence Systems for Chronic Kidney Disease
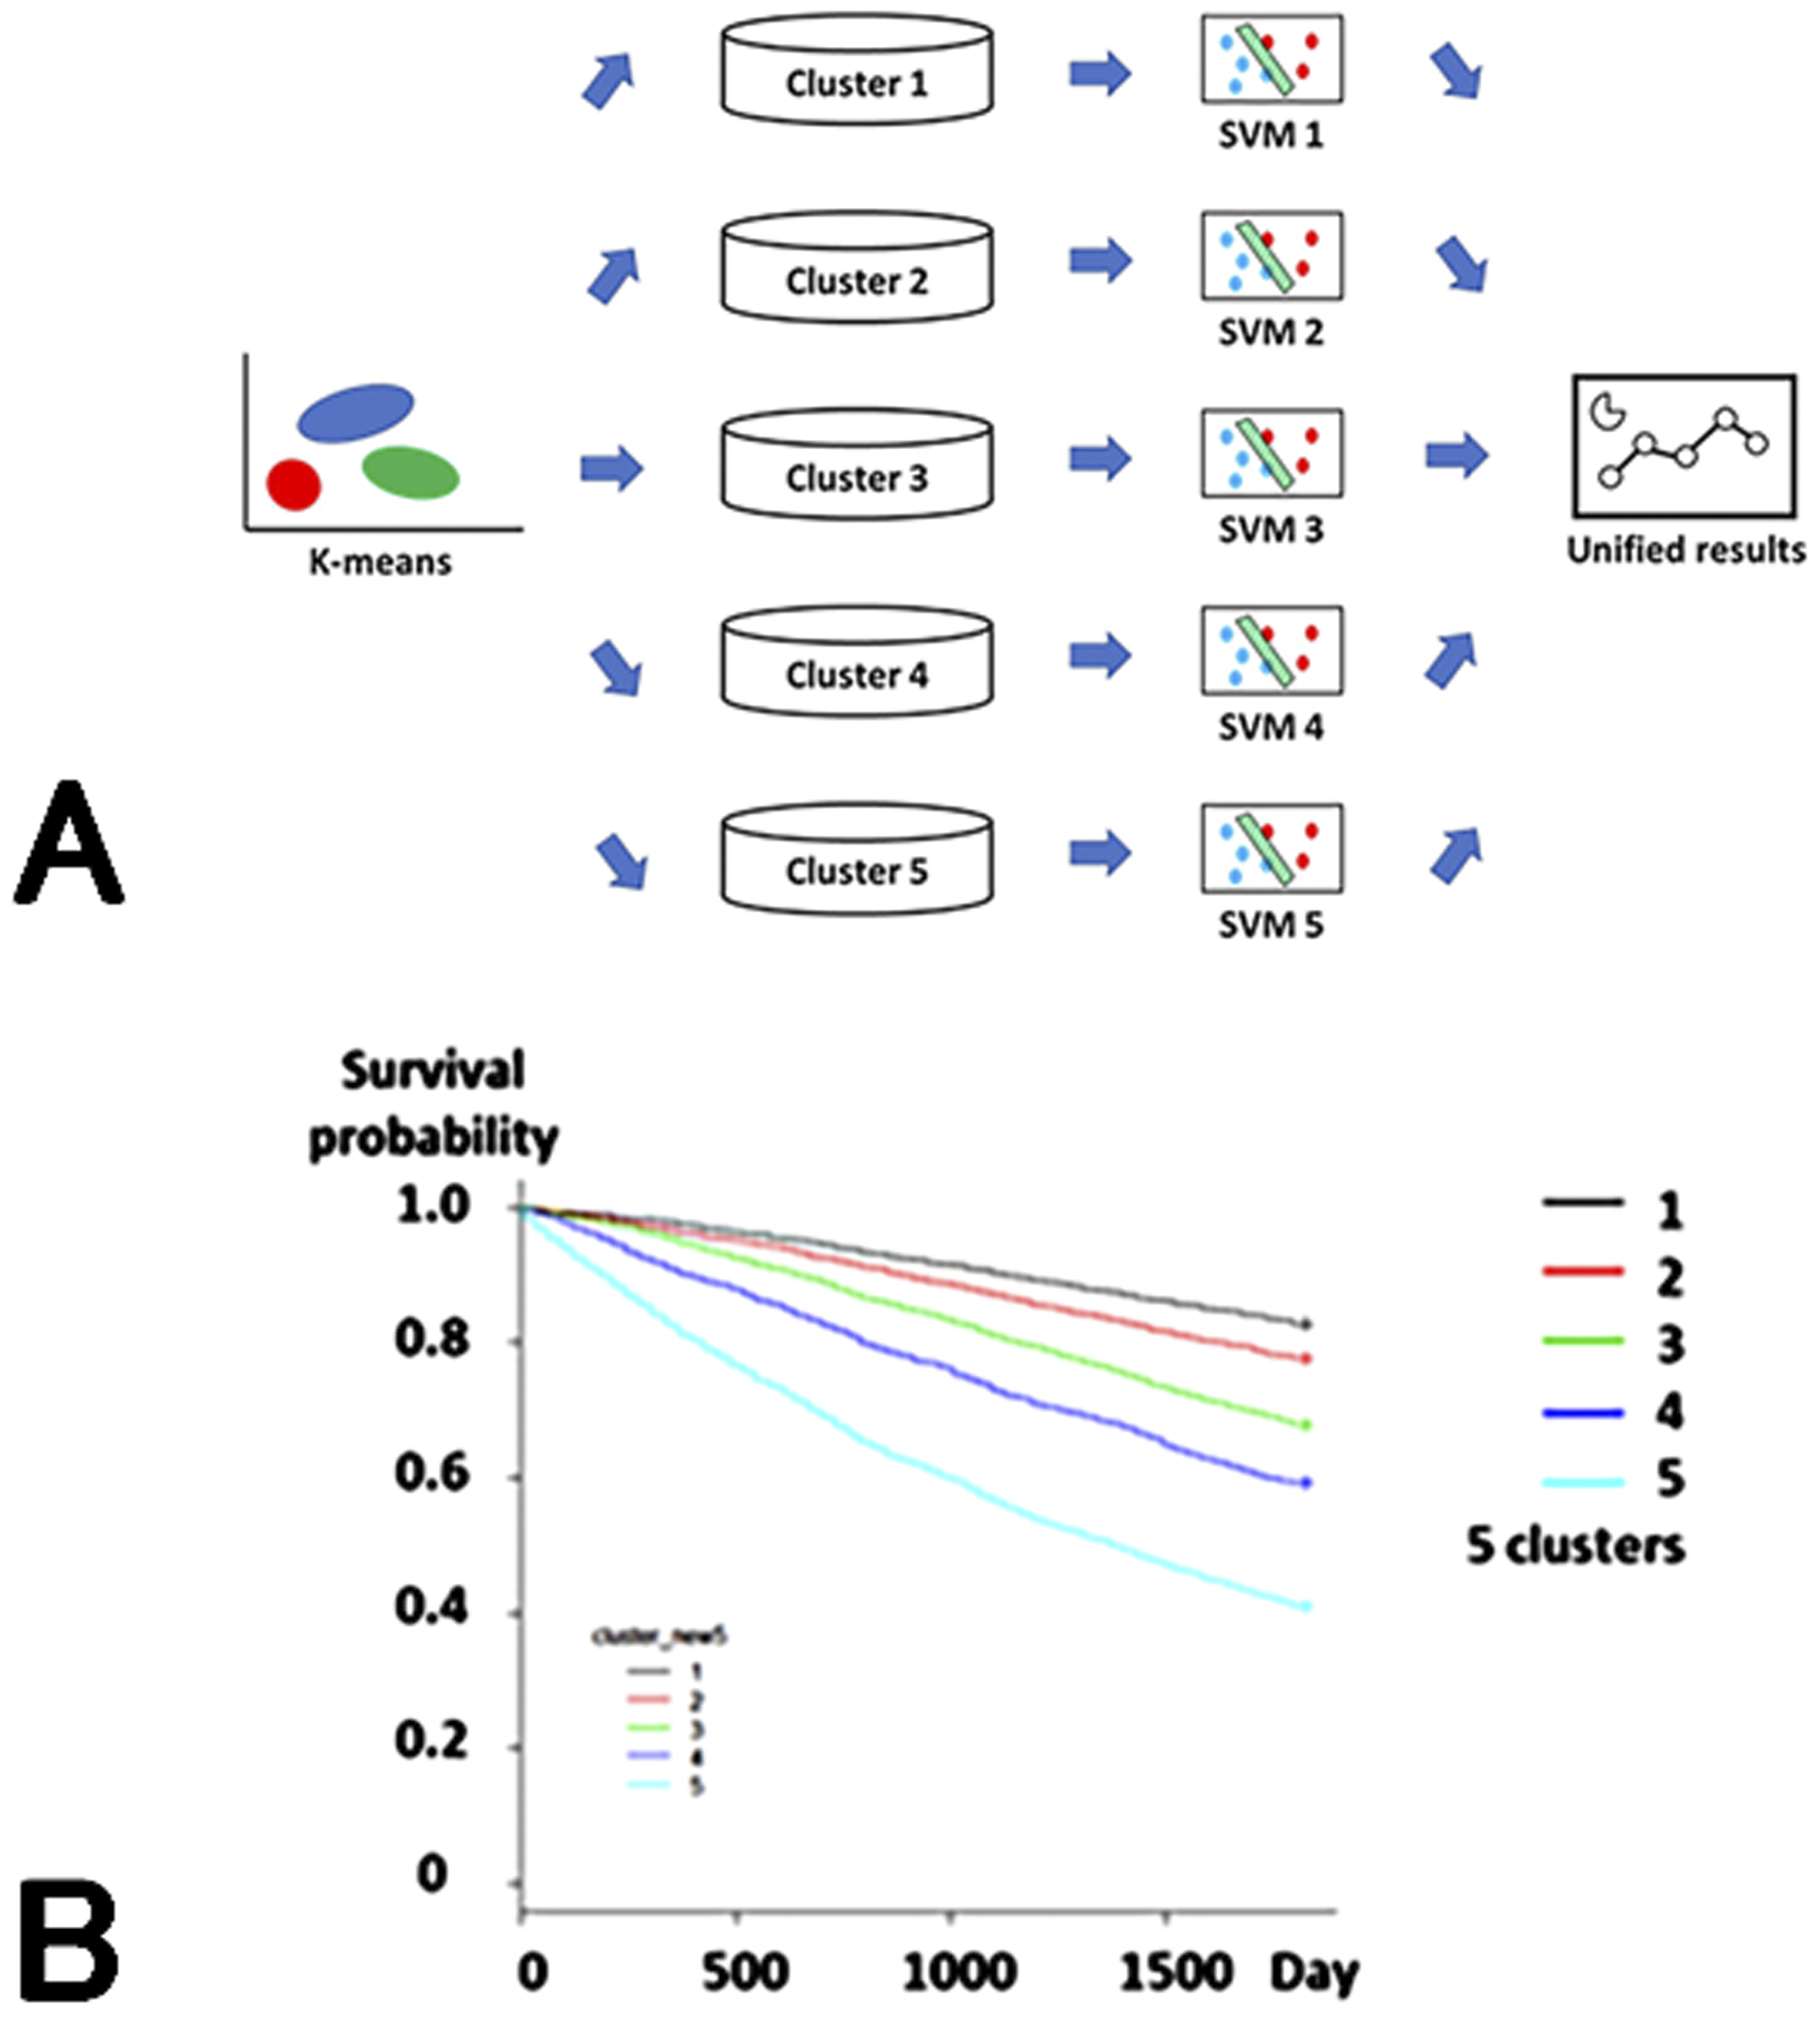
Figure 3. Mechanism of prognosis prediction system.
A. Relationship between probability predicted by machine learning model and risk of outcome occurrence: A Cox proportional hazards model adjusted for patient characteristics was used. The predicted probability of the RF_all model correlated well with the risk of occurrence of the outcome ( p < 0.0001).
B. System configuration: The input data is analyzed by a machine learning model via the server, and the results are displayed.
From: Development of Artificial Intelligence Systems for Chronic Kidney Disease
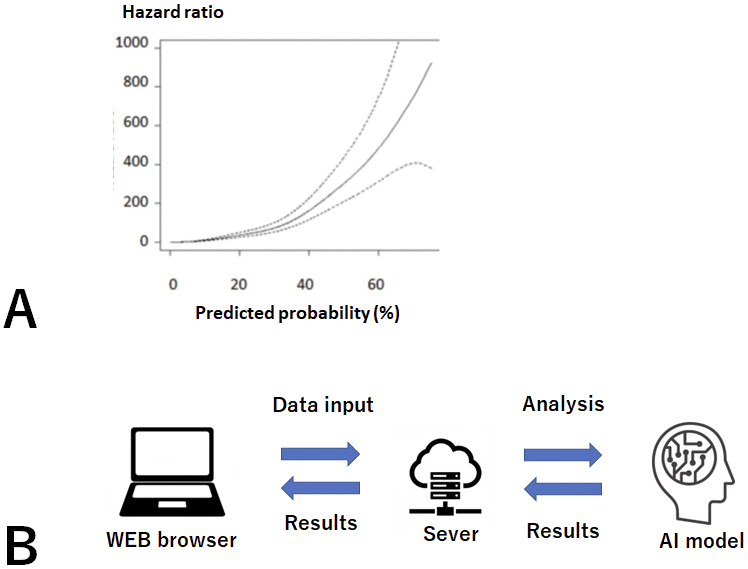
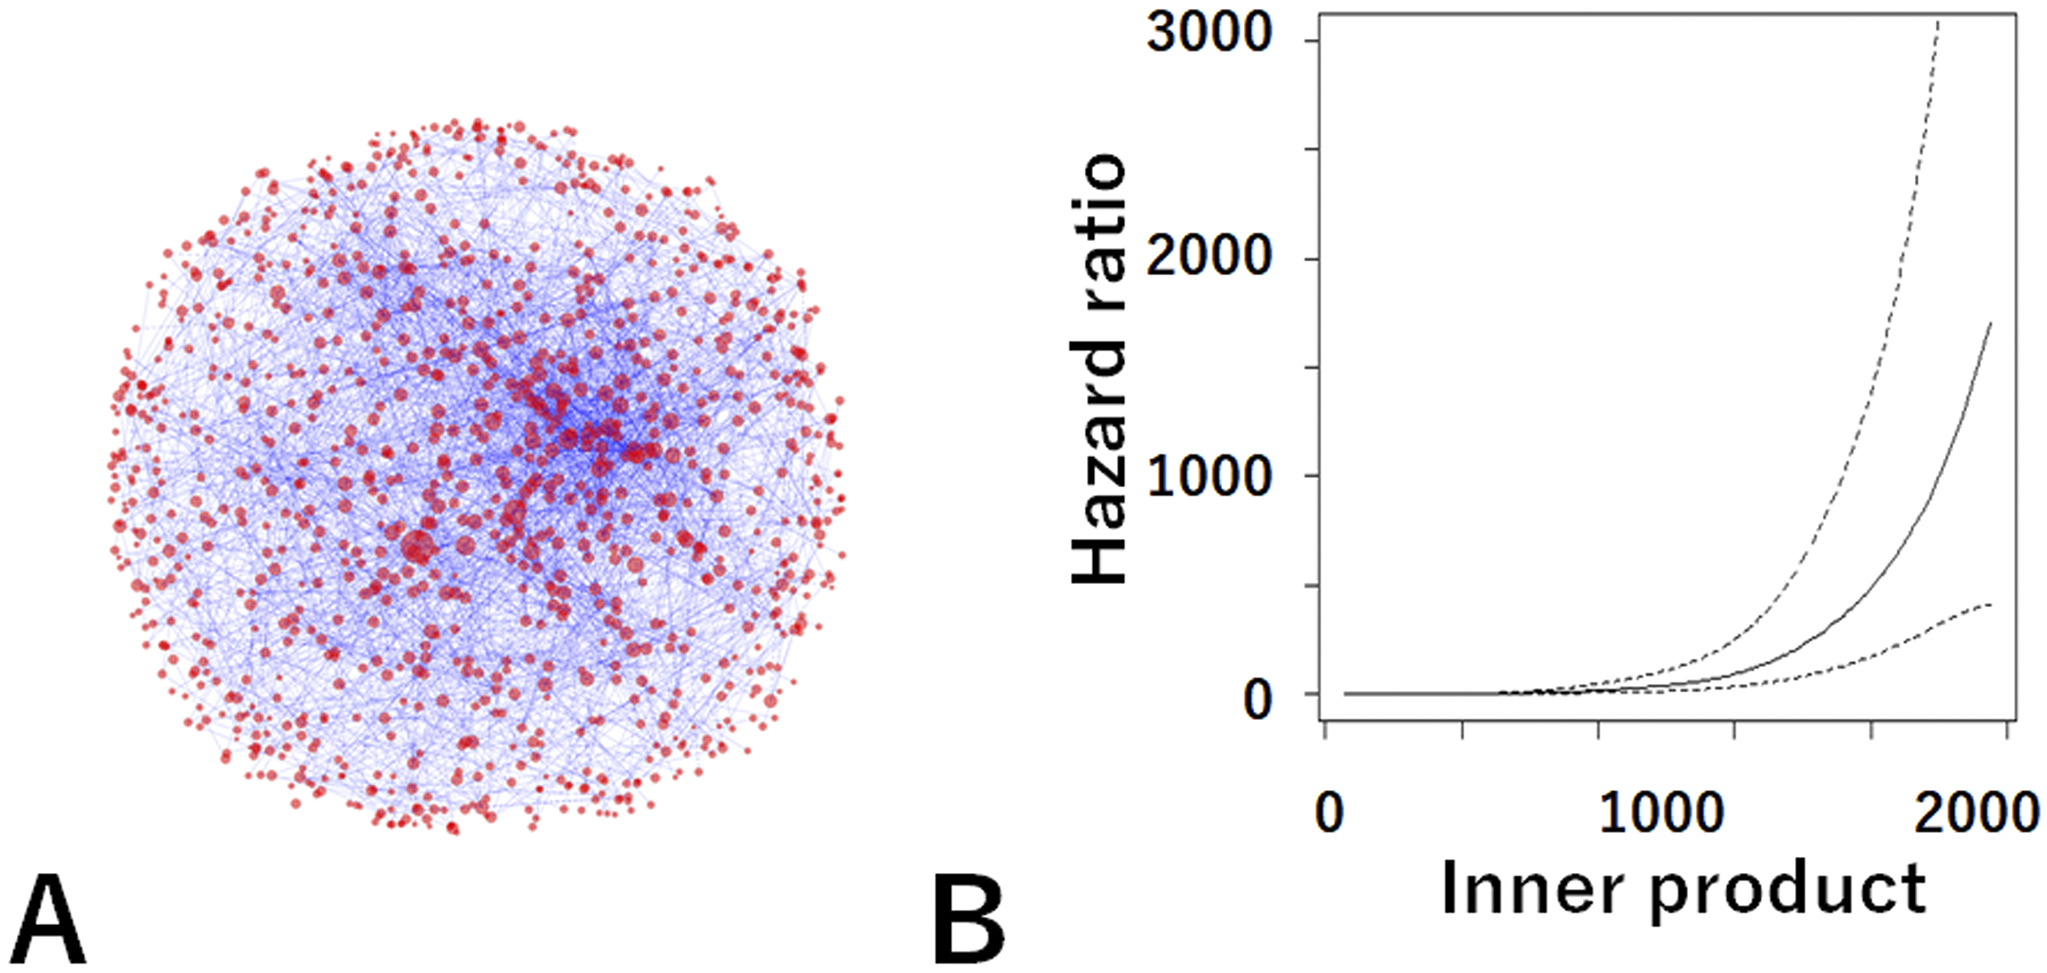
Figure 5. Medical word virtual space.
A. Network of medical words in a medical-word virtual space. Red dots represent medical words, and the importance of a medical word is indicated by the size of the dot. Relationships among medical words are indicated by blue lines.
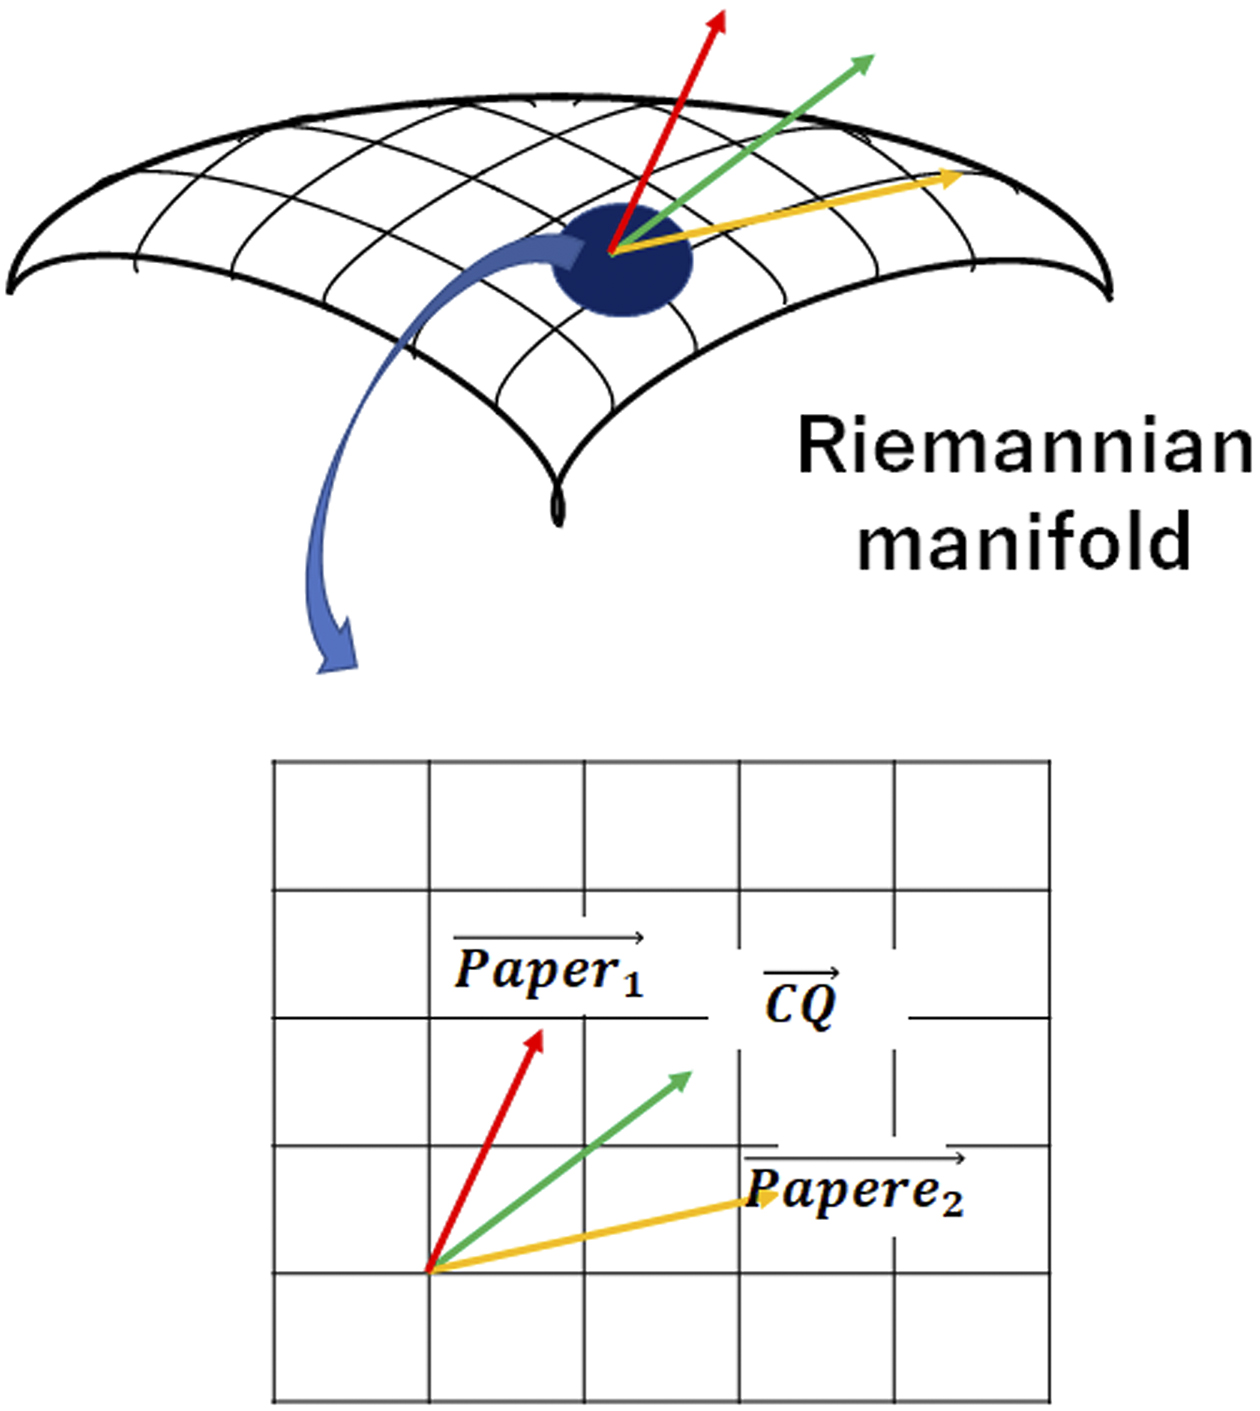
B. The relationship (inner product) between the patient vector and the ESKD vector is strongly correlated with the risk of ESKD (p < 0.0001).
From: Development of Artificial Intelligence Systems for Chronic Kidney Disease