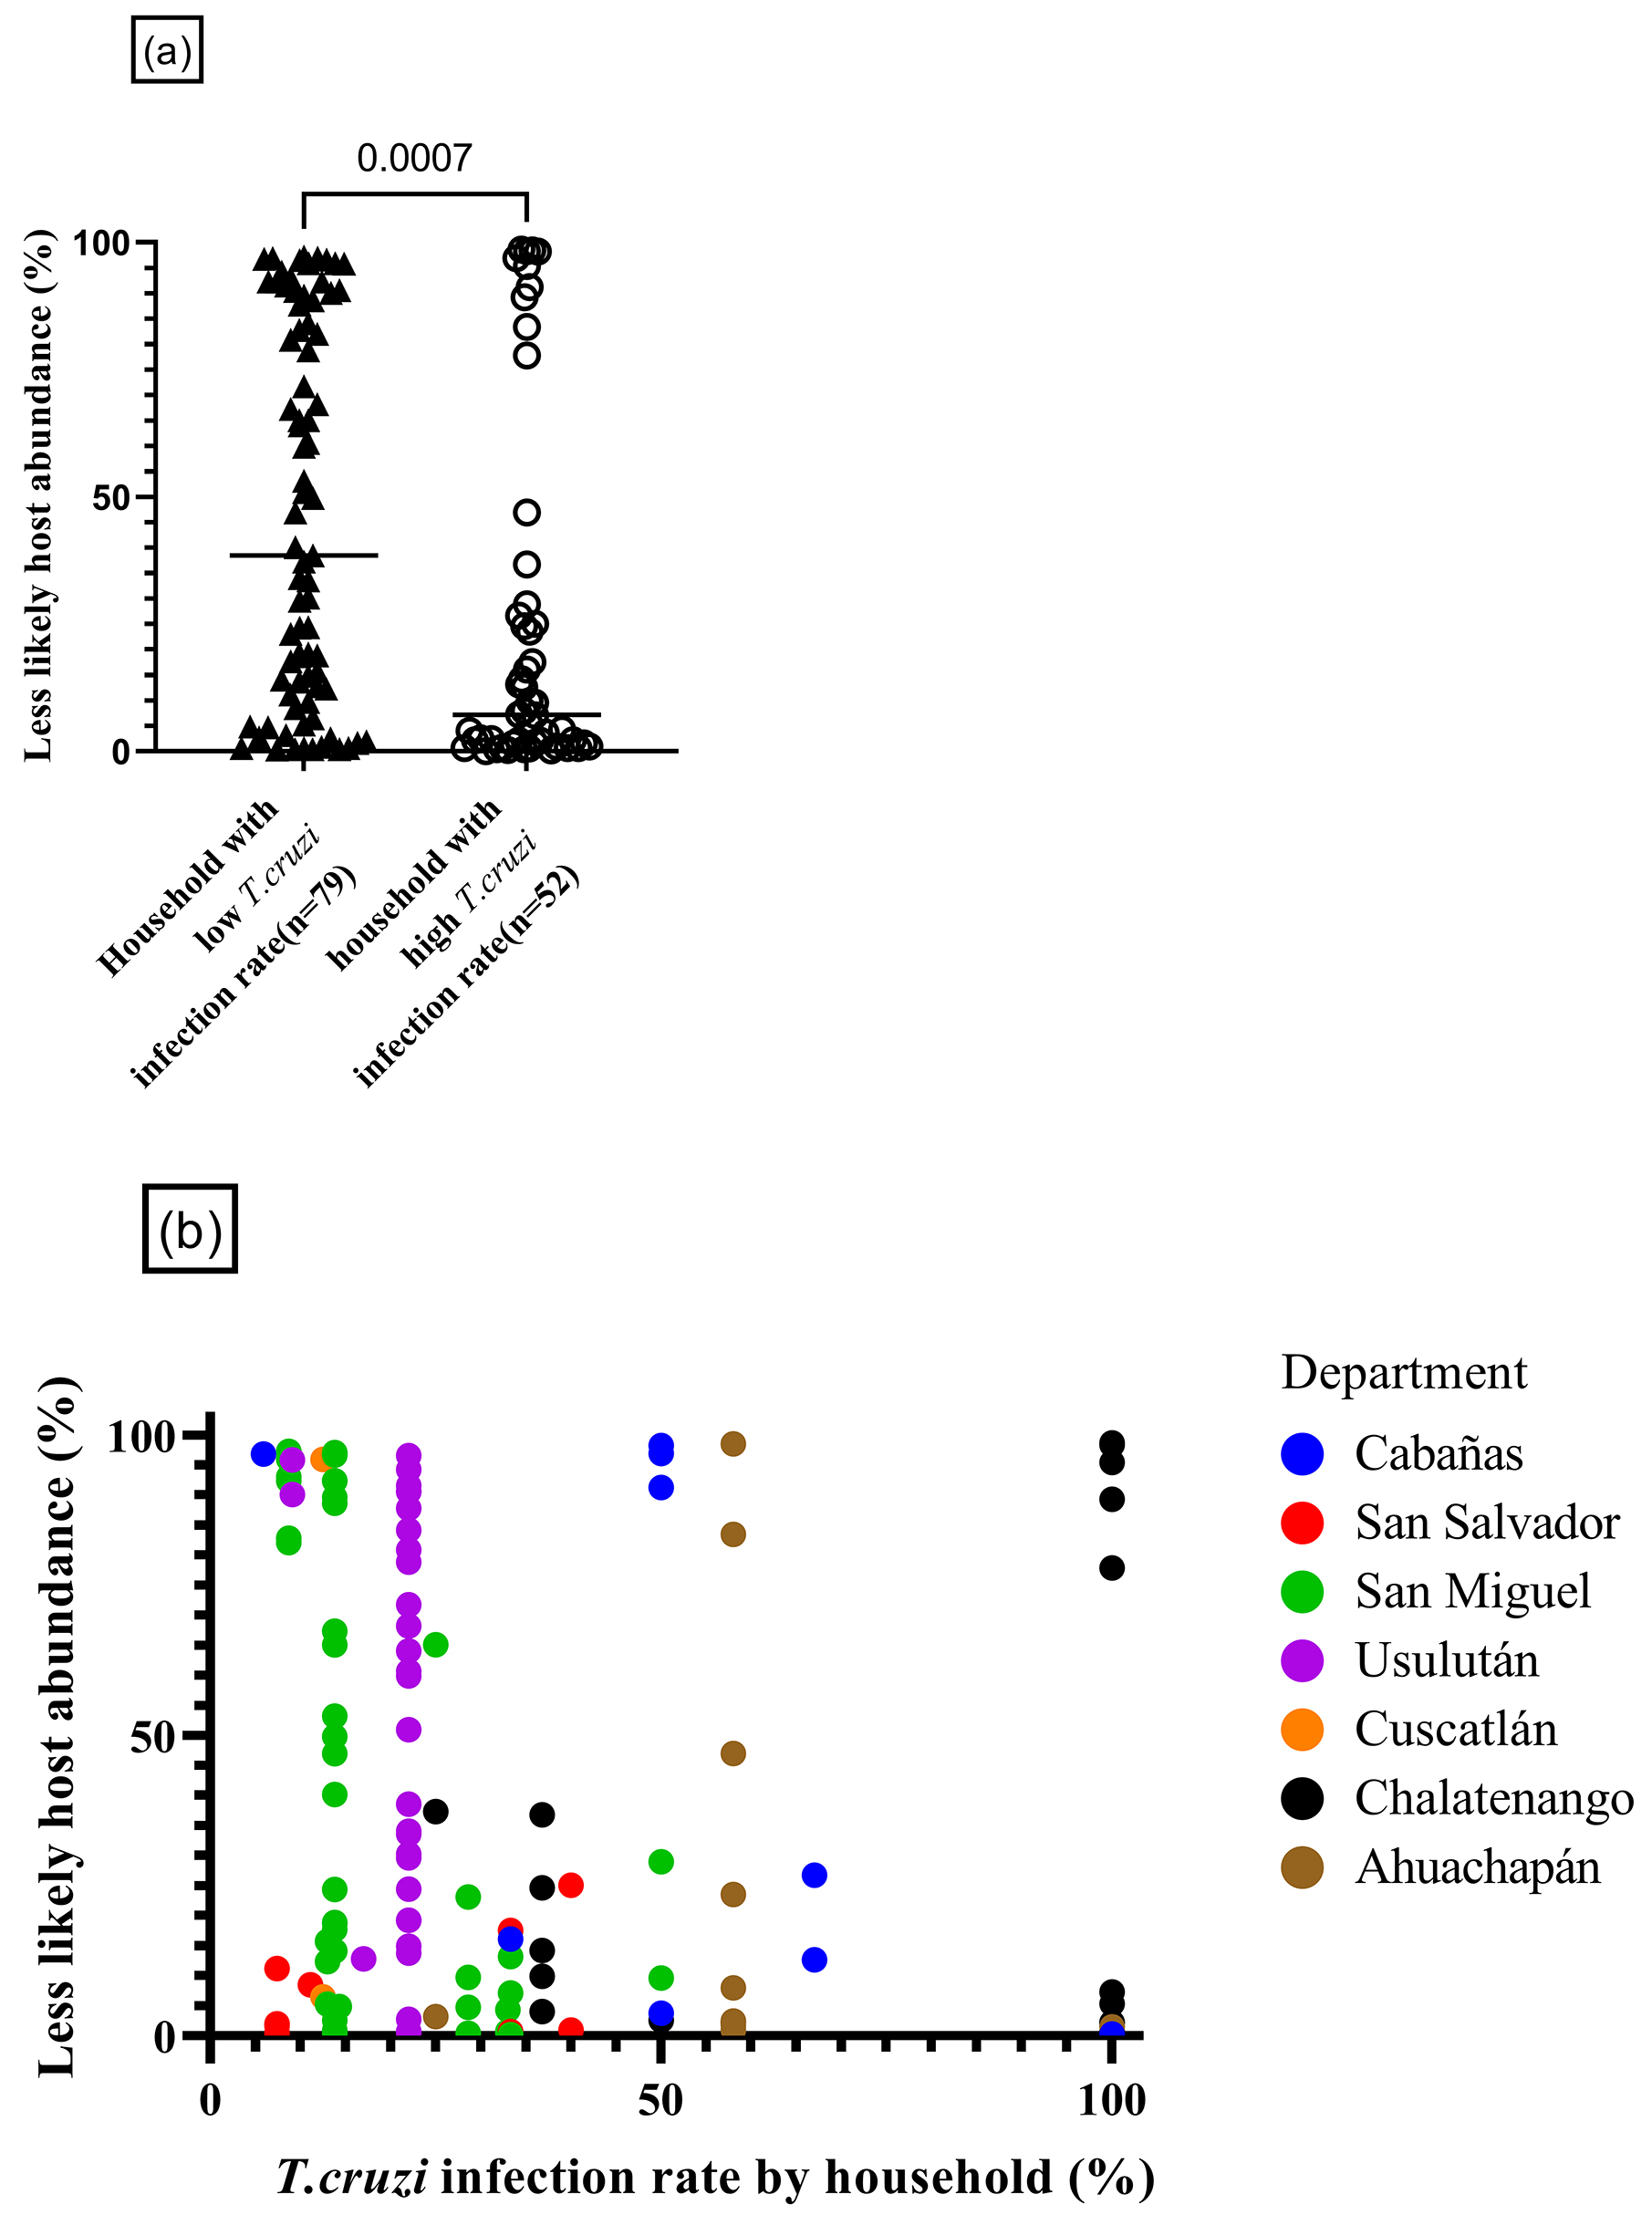
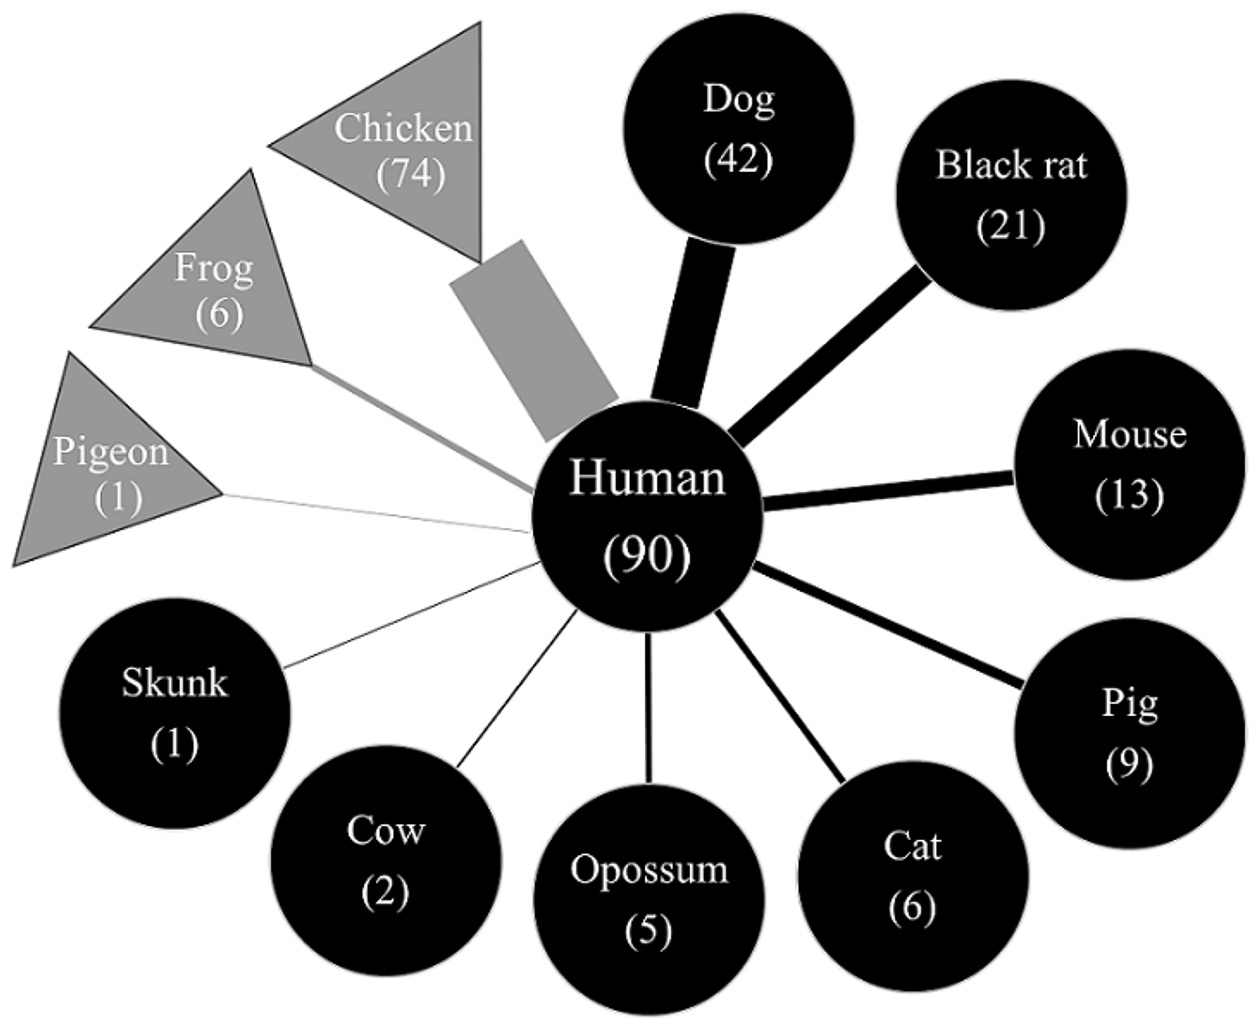
Figure 5. Implications of less likely hosts on T. cruzi infection rate.
(a) Statistical considerations in the relative abundance of the less likely host (n = 131)
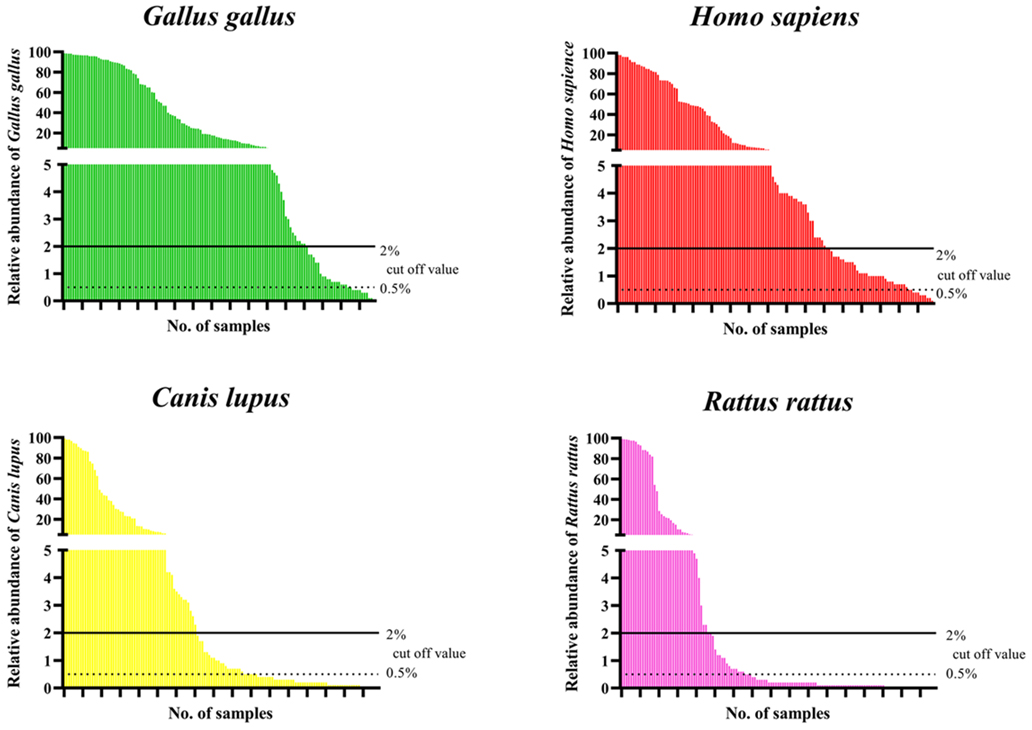
We compared the relative abundance of less likely hosts with three vertebrates in two groups. The black triangle group has a T. cruzi infection rate per household of less than 33% (n = 79); the other has a T. cruzi infection rate per household of 33% and over (n = 52). One plot represents an individual vector. A significant difference was observed in less likely host abundance between the two groups (Mann-Whitney test, p = 0.0007).
(b) Household variety of T. cruzi infection rate and relative abundance of less likely hosts (n = 131).
We determined the correlation matrix for T. cruzi infection rate and less likely host abundance (n = 131). One plot represents an individual vector. A weak negative correlation was observed (Spearman’s correlation coefficient, rs = −0.28, p = 0.001) between the infection rate of collected vectors calculated in each household and less likely host abundance.
T. cruzi: Trypanosoma cruzi.
From: Natural Reservoir of Trypanosoma cruzi Found in Triatomines Targeting Humans: Results from Nation-wide Vector Surveillance in El Salvador