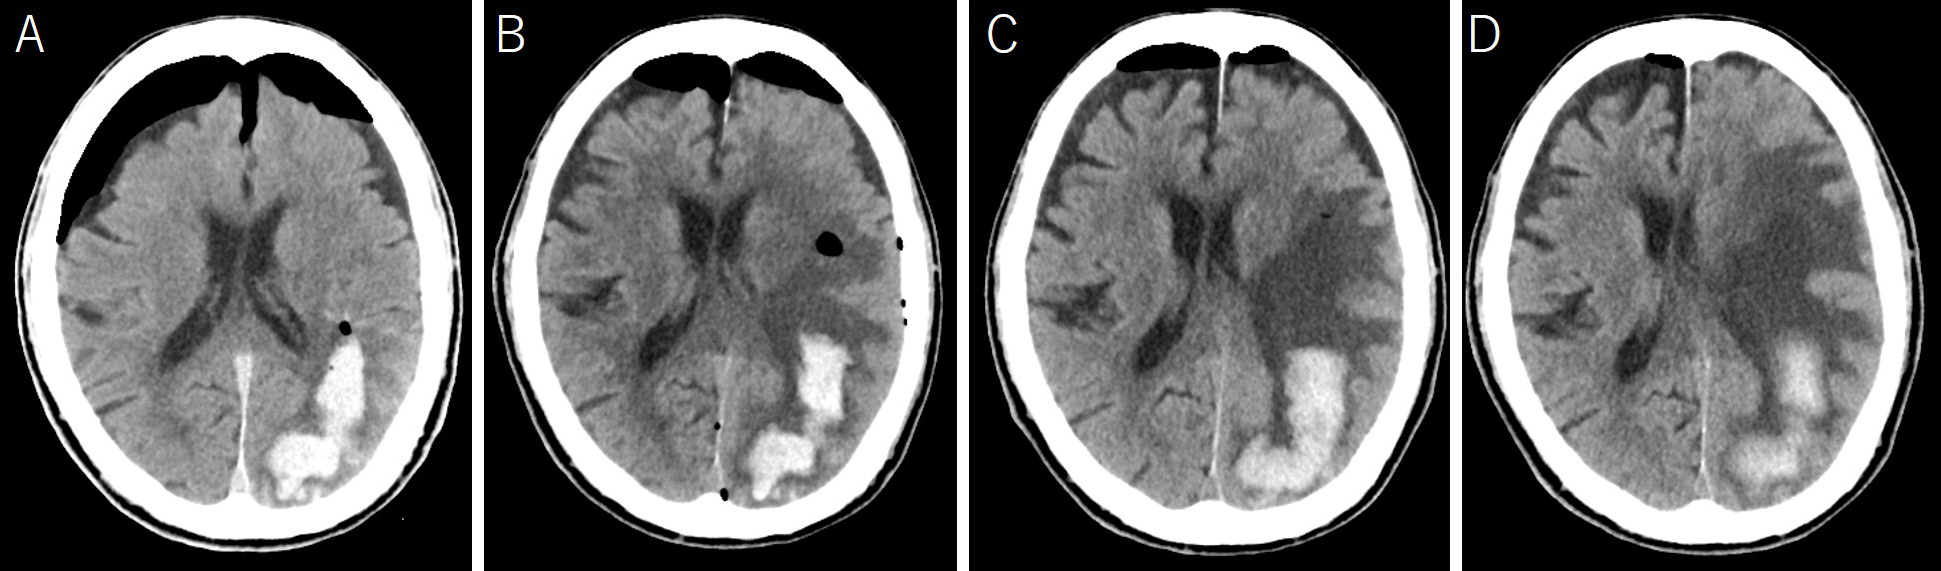
Figure 2. Serial computed tomography (CT) after the first operation revealed the development of a cystic lesion at hematoma and cyst expansion sites. CT immediately after the operation (A); CT on postoperative day 2 (B); CT on postoperative day 8 (C); CT on postoperative day 13 (D).
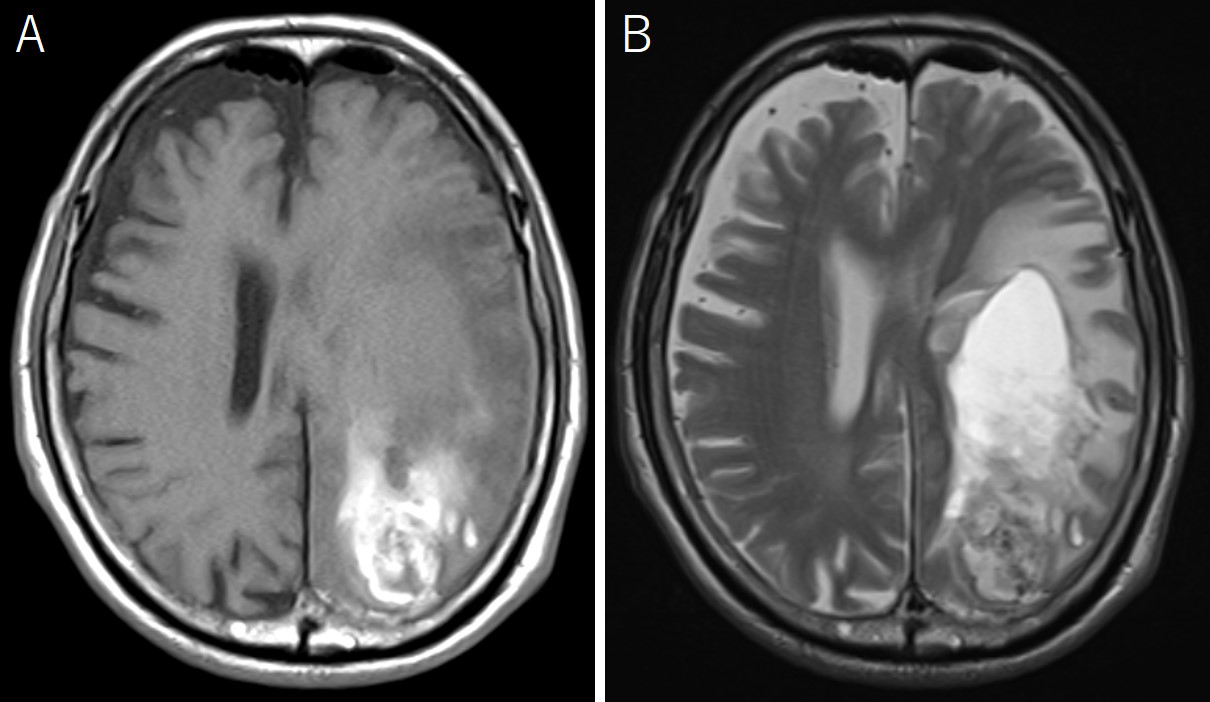
Figure 3. Magnetic resonance images on postoperative day 12; cyst showed iso intensity in the T1-weighted image (A) and marked high intensity in the T2-weighted image (B).