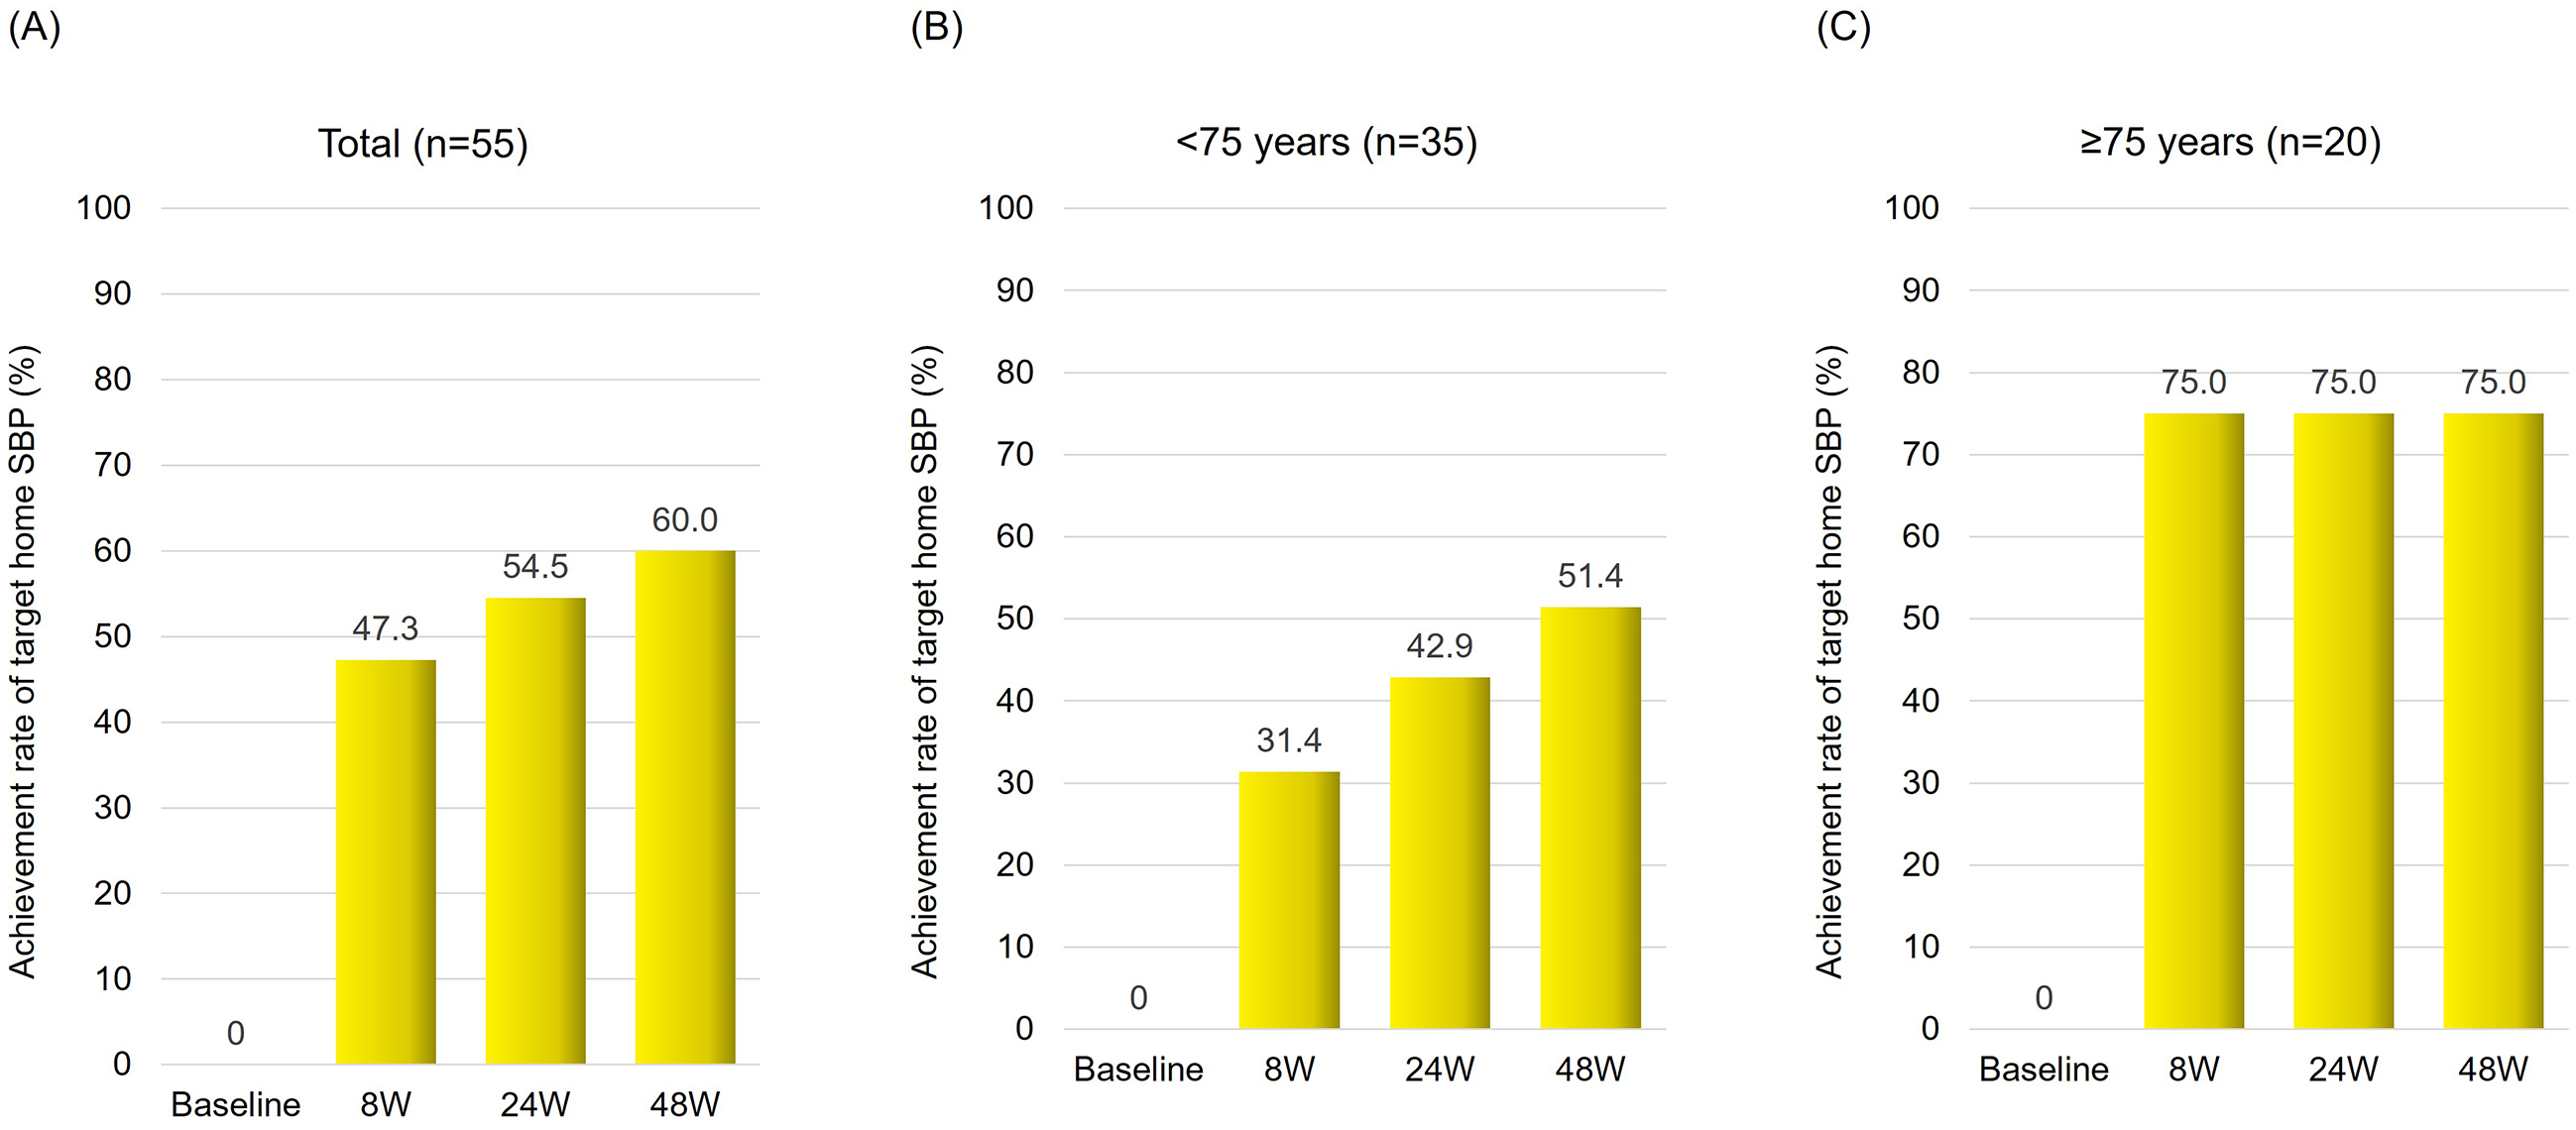
Figure 1. Achievement rate of target home systolic blood pressure after switching from azilsartan to sacubitril/valsartan Achievement rate of target home SBP after switching from azilsartan to sacubitril/valsartan treatment in the total population (A), and patients aged <75 years (B) and ≥75 years (C). SBP, systolic blood pressure.
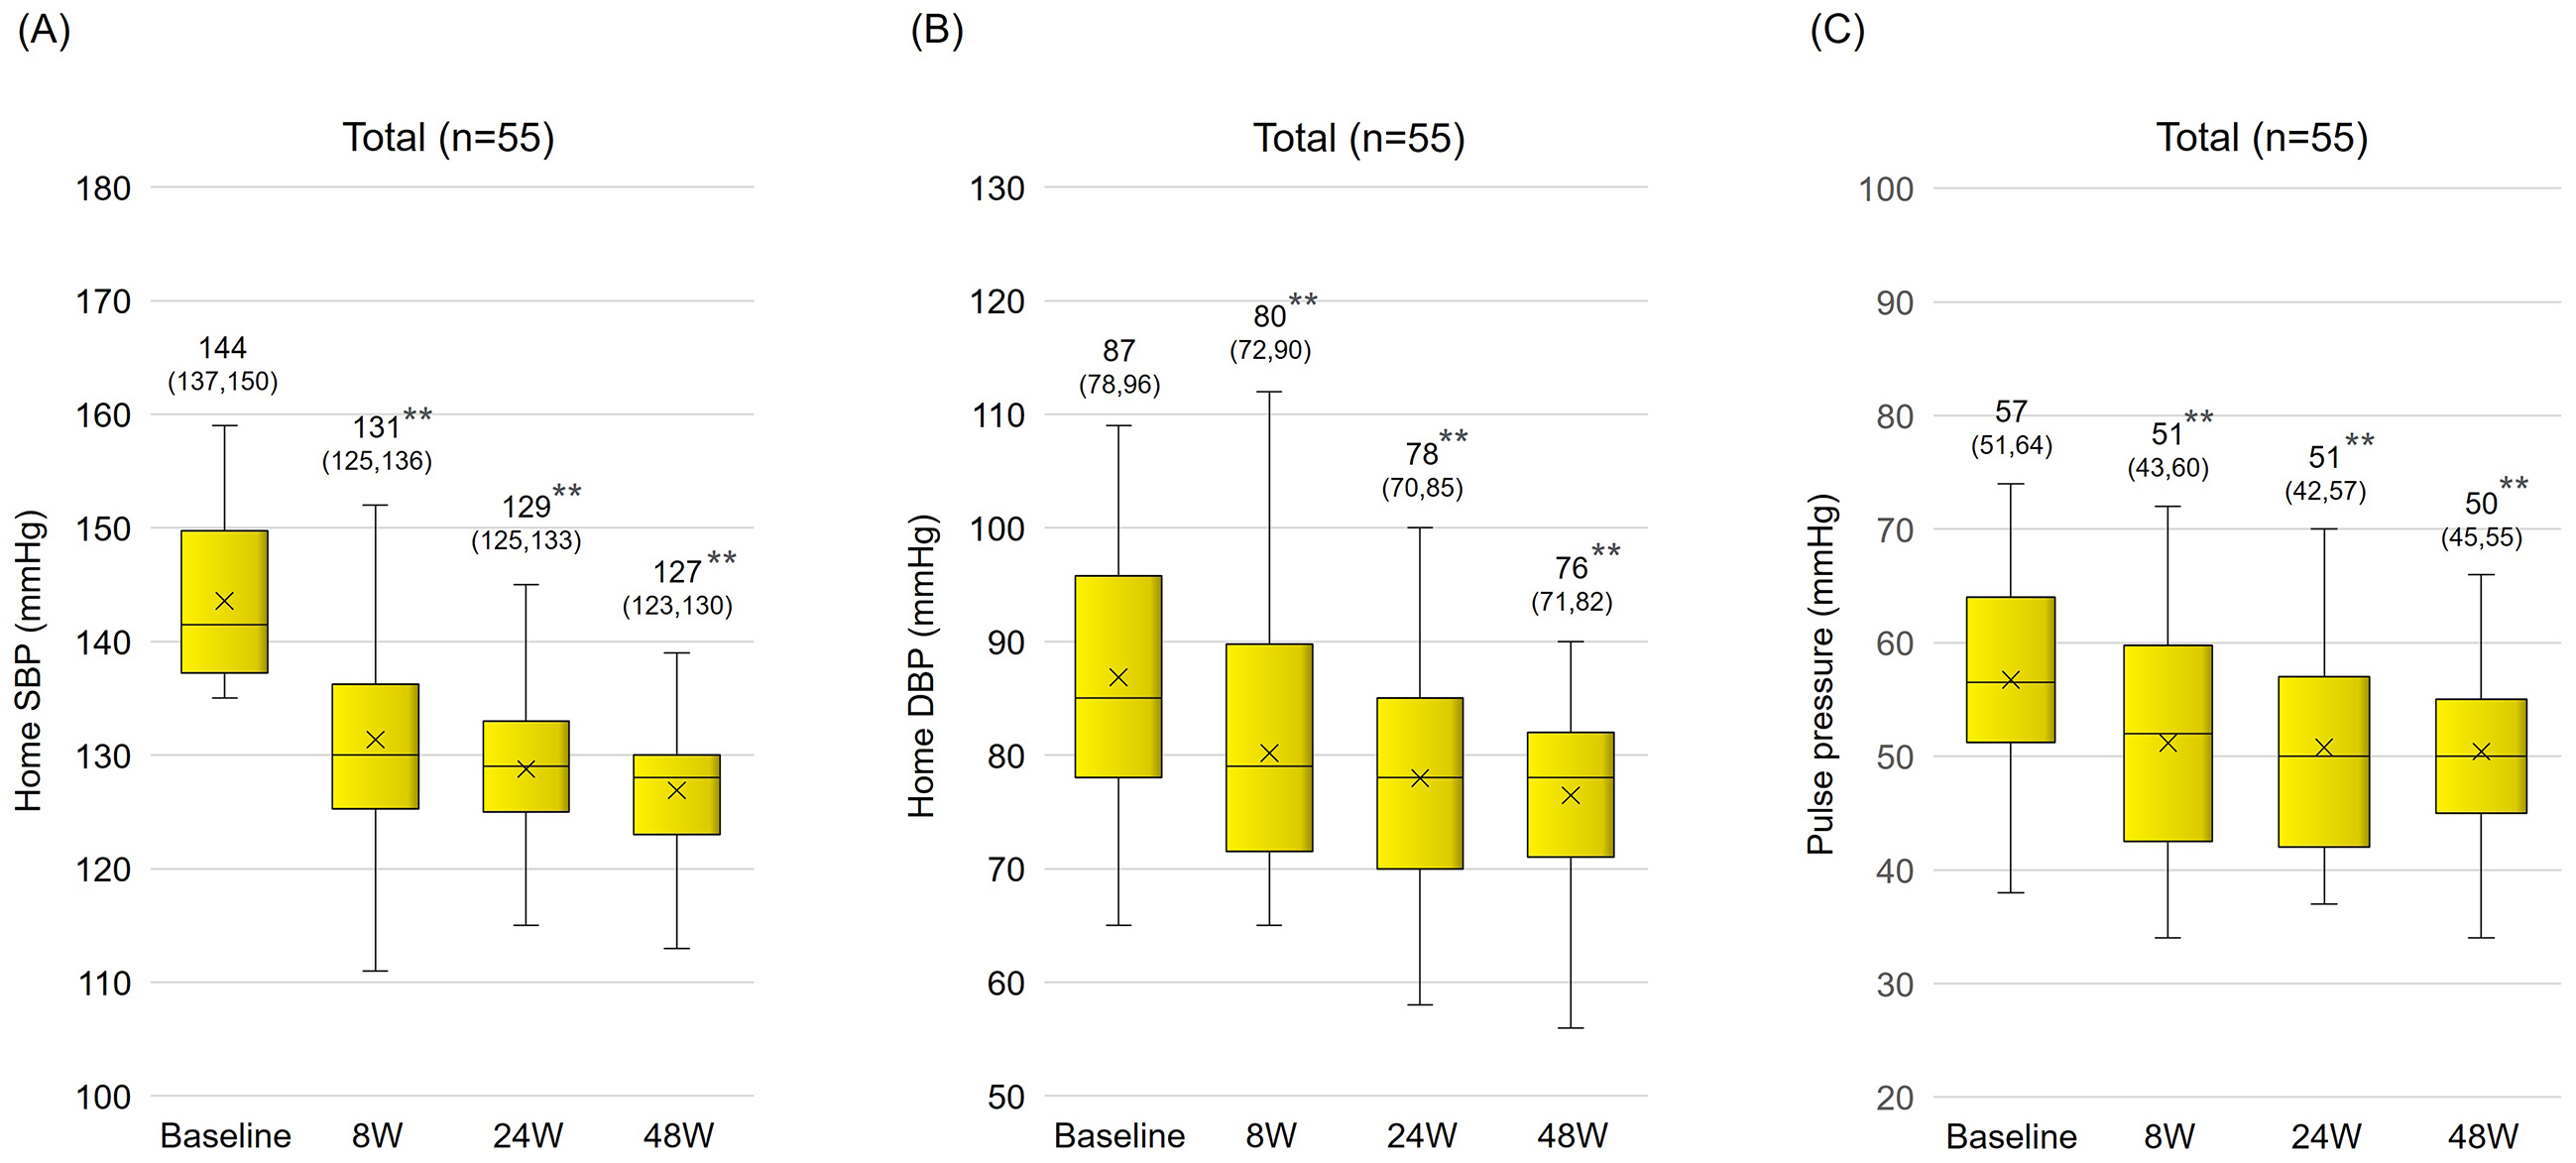
Figure 2. Changes in home blood pressure after switching from azilsartan to sacubitril/valsartan Changes in home SBP (A), DBP (B), and pulse pressure (C) after switching from azilsartan to sacubitril/valsartan in the total population. The numbers and numbers in brackets on each box plot indicate the mean and interquartile range, respectively. **p < 0.01 vs. baseline, paired t test. SBP, systolic blood pressure; DBP, diastolic blood pressure.
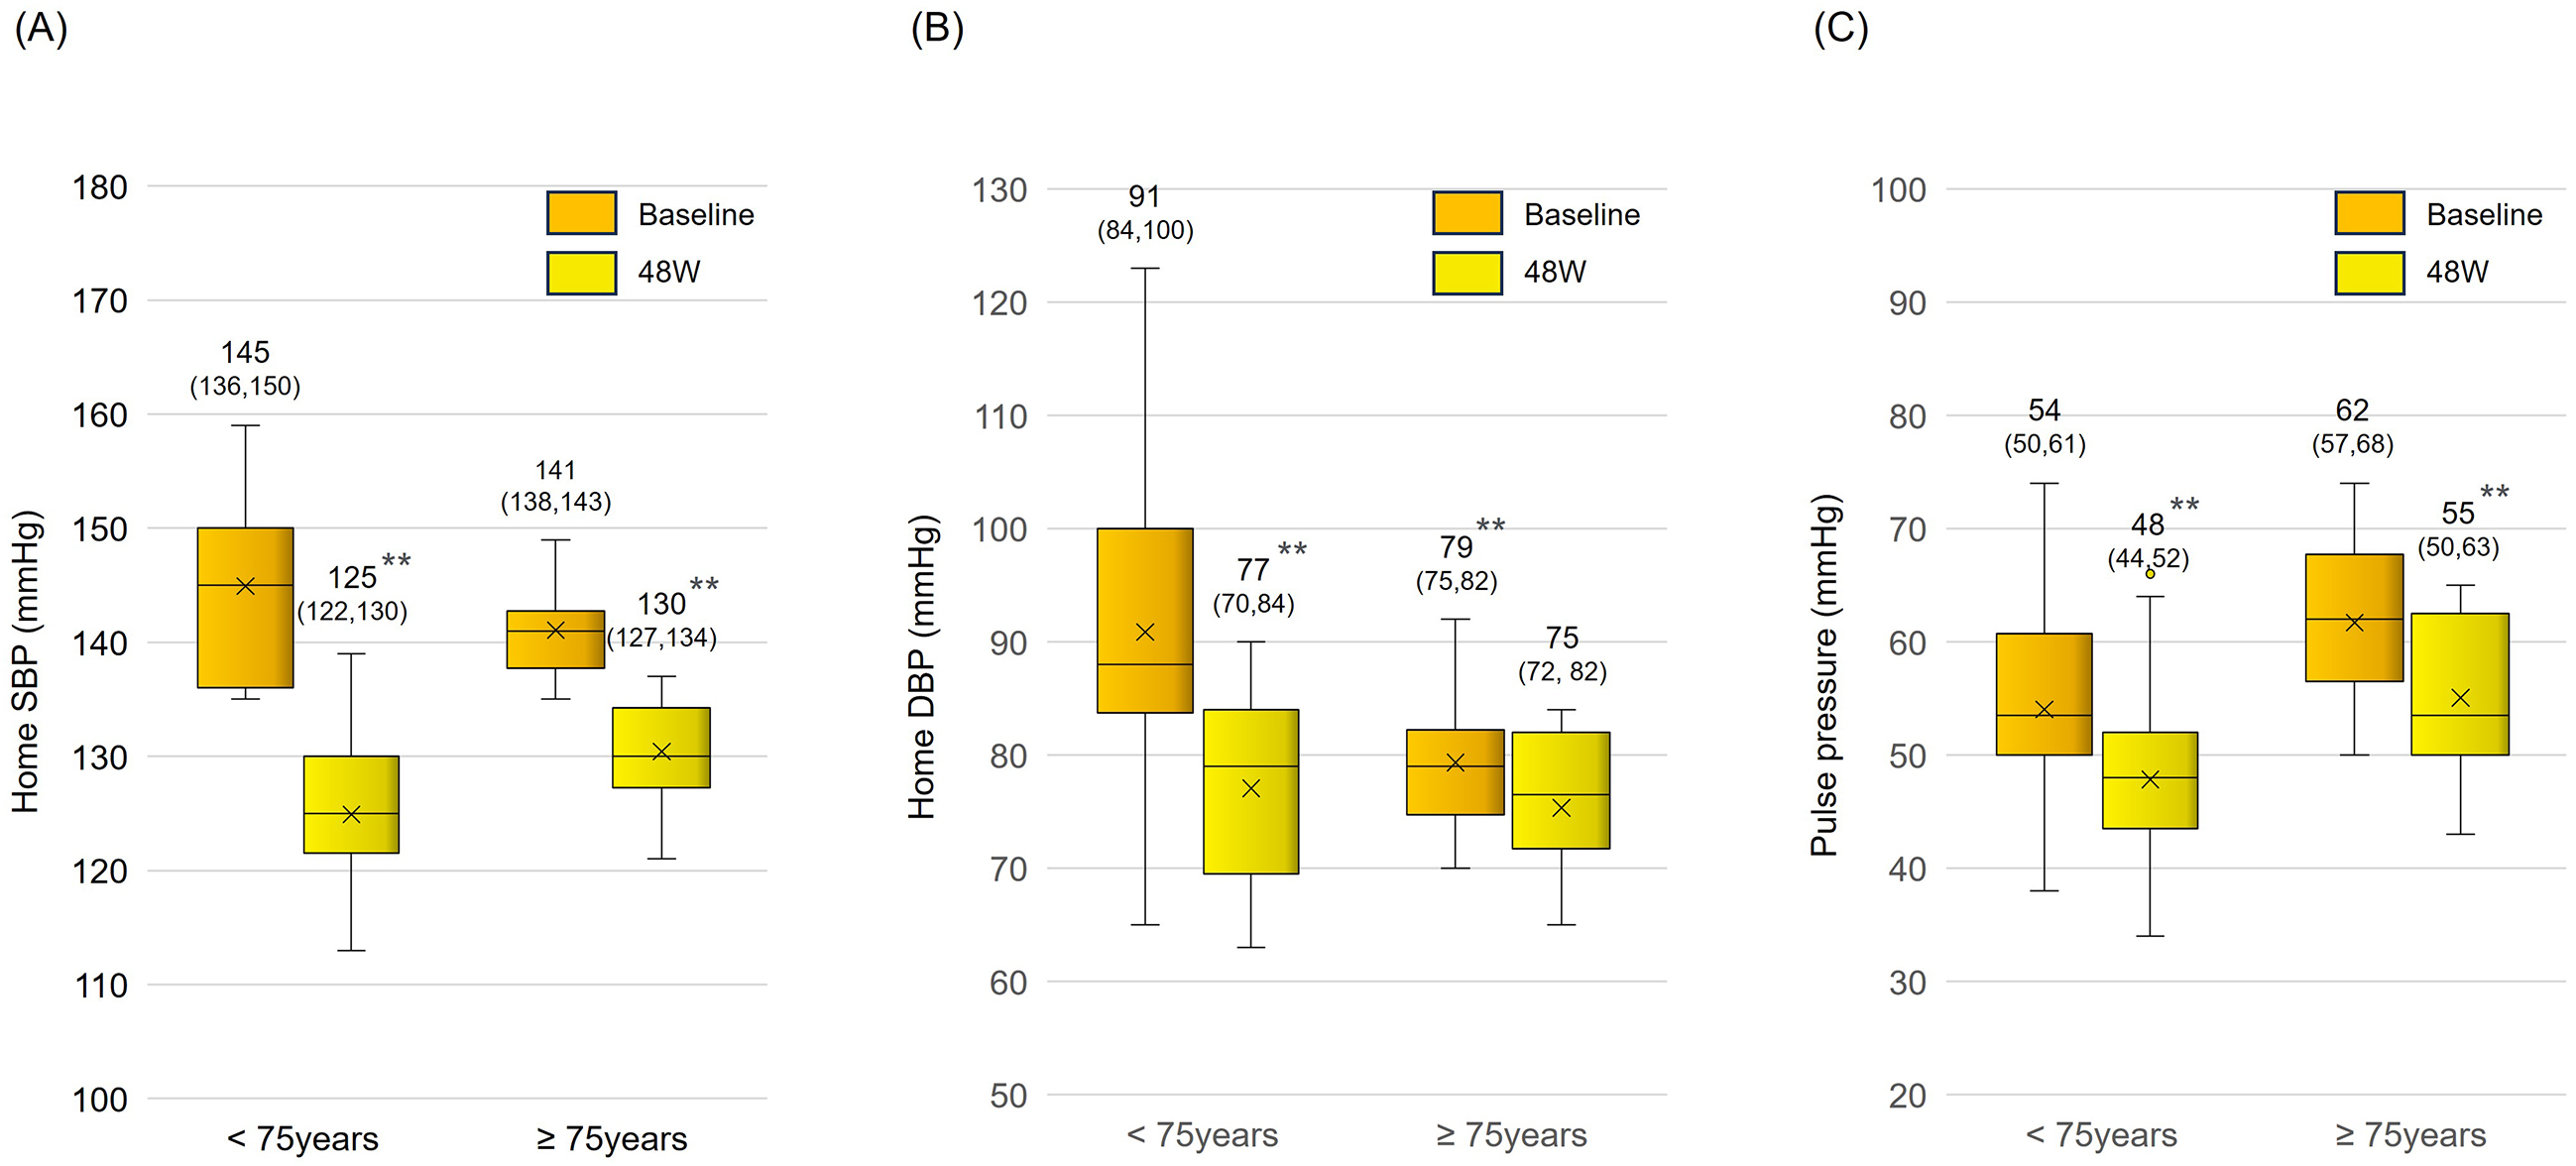
Figure 3. Changes in home blood pressure after switching from azilsartan to sacubitril/valsartan Changes in home SBP (A), DBP (B), and pulse pressure (C) after switching from azilsartan to sacubitril/valsartan in patients aged <75 years and ≥75 years. The numbers and numbers in brackets on each box plot indicate the mean and interquartile range, respectively. **p < 0.01 vs. baseline, paired t test. SBP, systolic blood pressure; DBP, diastolic blood pressure.
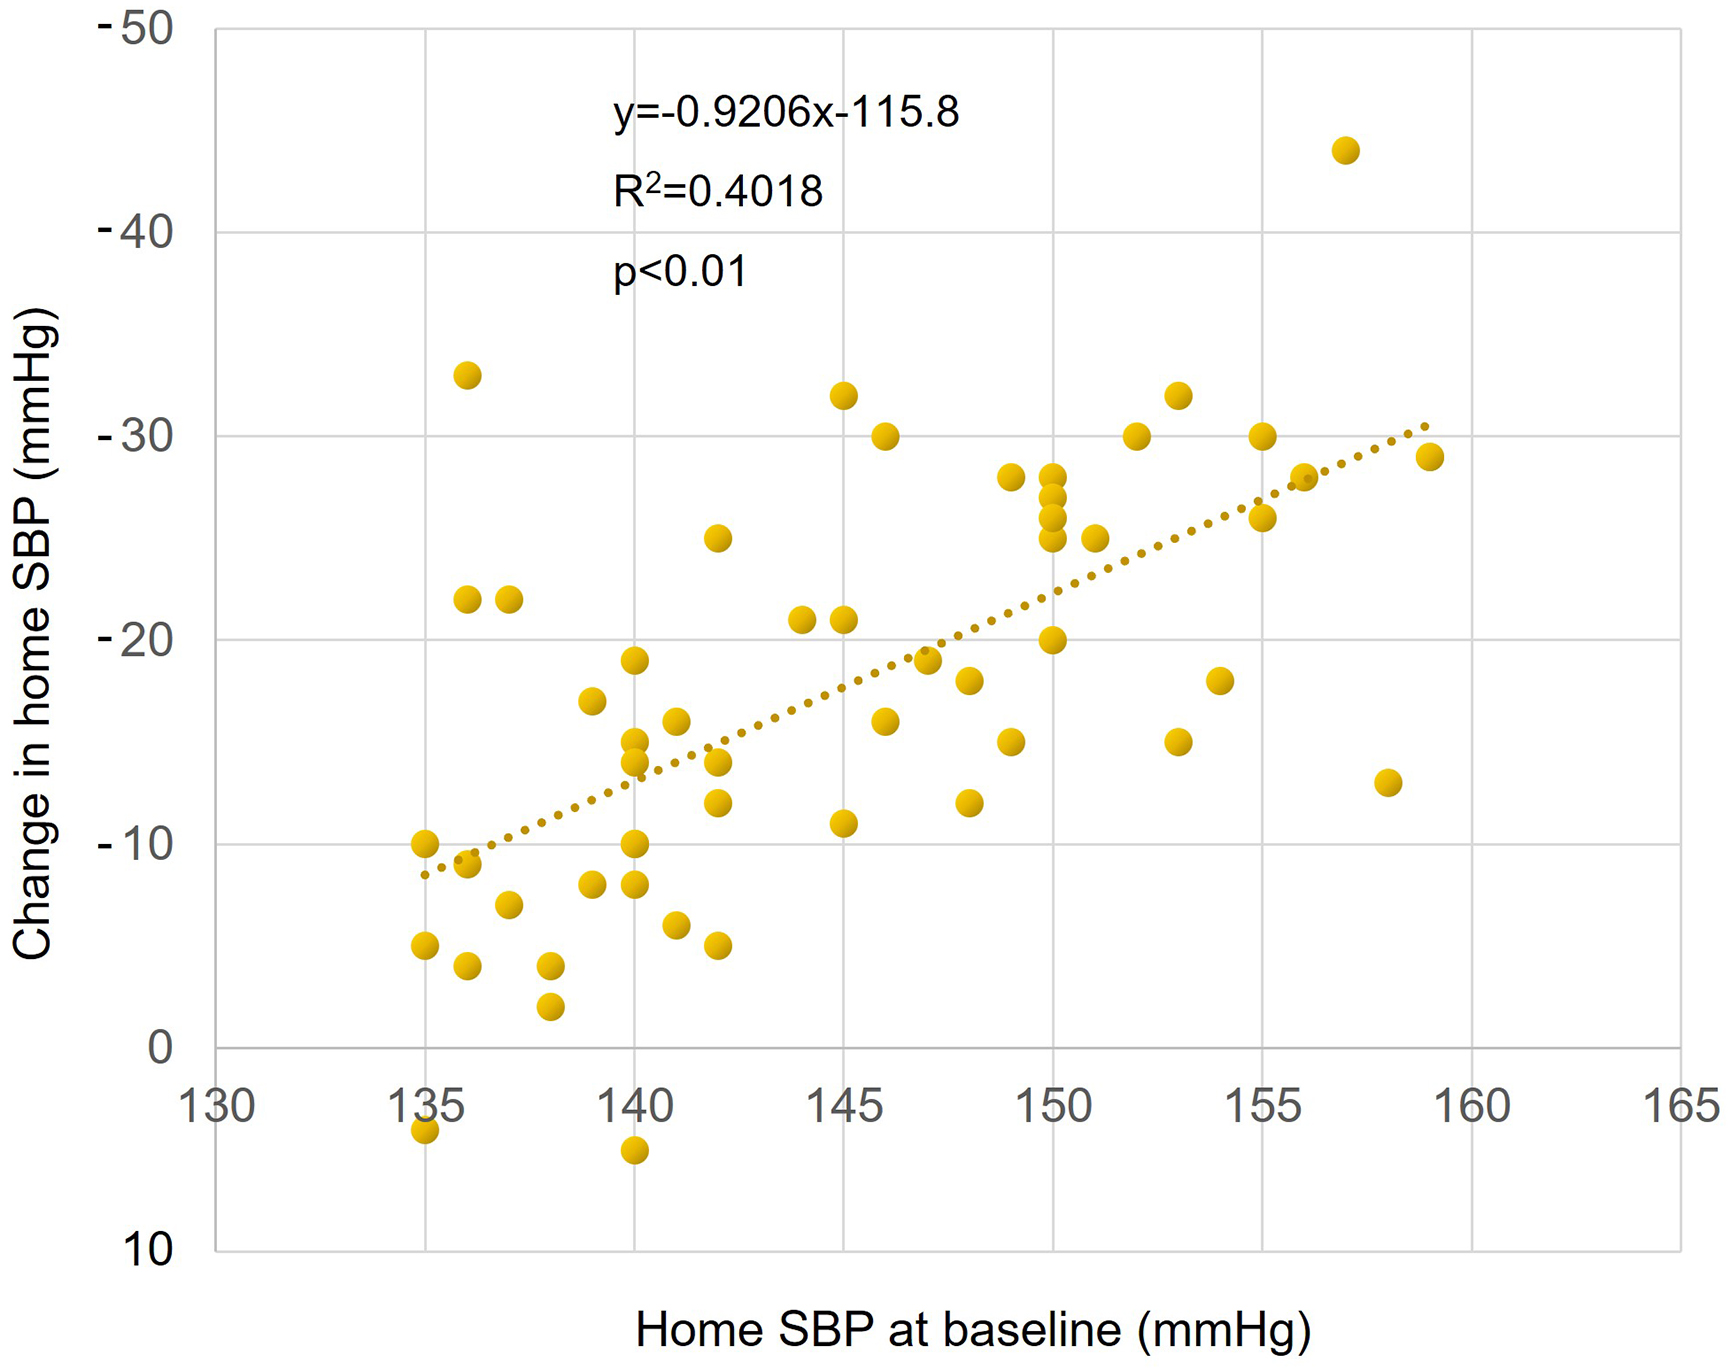
Figure 4. Correlation between baseline home systolic BP and change in home systolic BP after switching from azilsartan to sacubitril/valsartan treatment Correlation between baseline home SBP and change in baseline home SBP after switching from azilsartan to sacubitril/valsartan treatment in the total population. Pearson’s correlation coefficient (R2) is shown above the scatter plot. SBP, systolic blood pressure.