Figure 1. Trends in annual incidence rates of hospitalization per 100,000 people and age-adjusted incidence rates of hospitalization for each stroke subtype.
Total stroke and SAH data in 2012 were excluded due to a change in the billing code.
The solid line shows the incidence rate of hospitalization per 100,000, and the dashed line shows the age-adjusted incidence rate of hospitalization.
SAH: subarachnoid hemorrhage.
From: National Trends in the Incidence of Hospitalization for Stroke in Japan
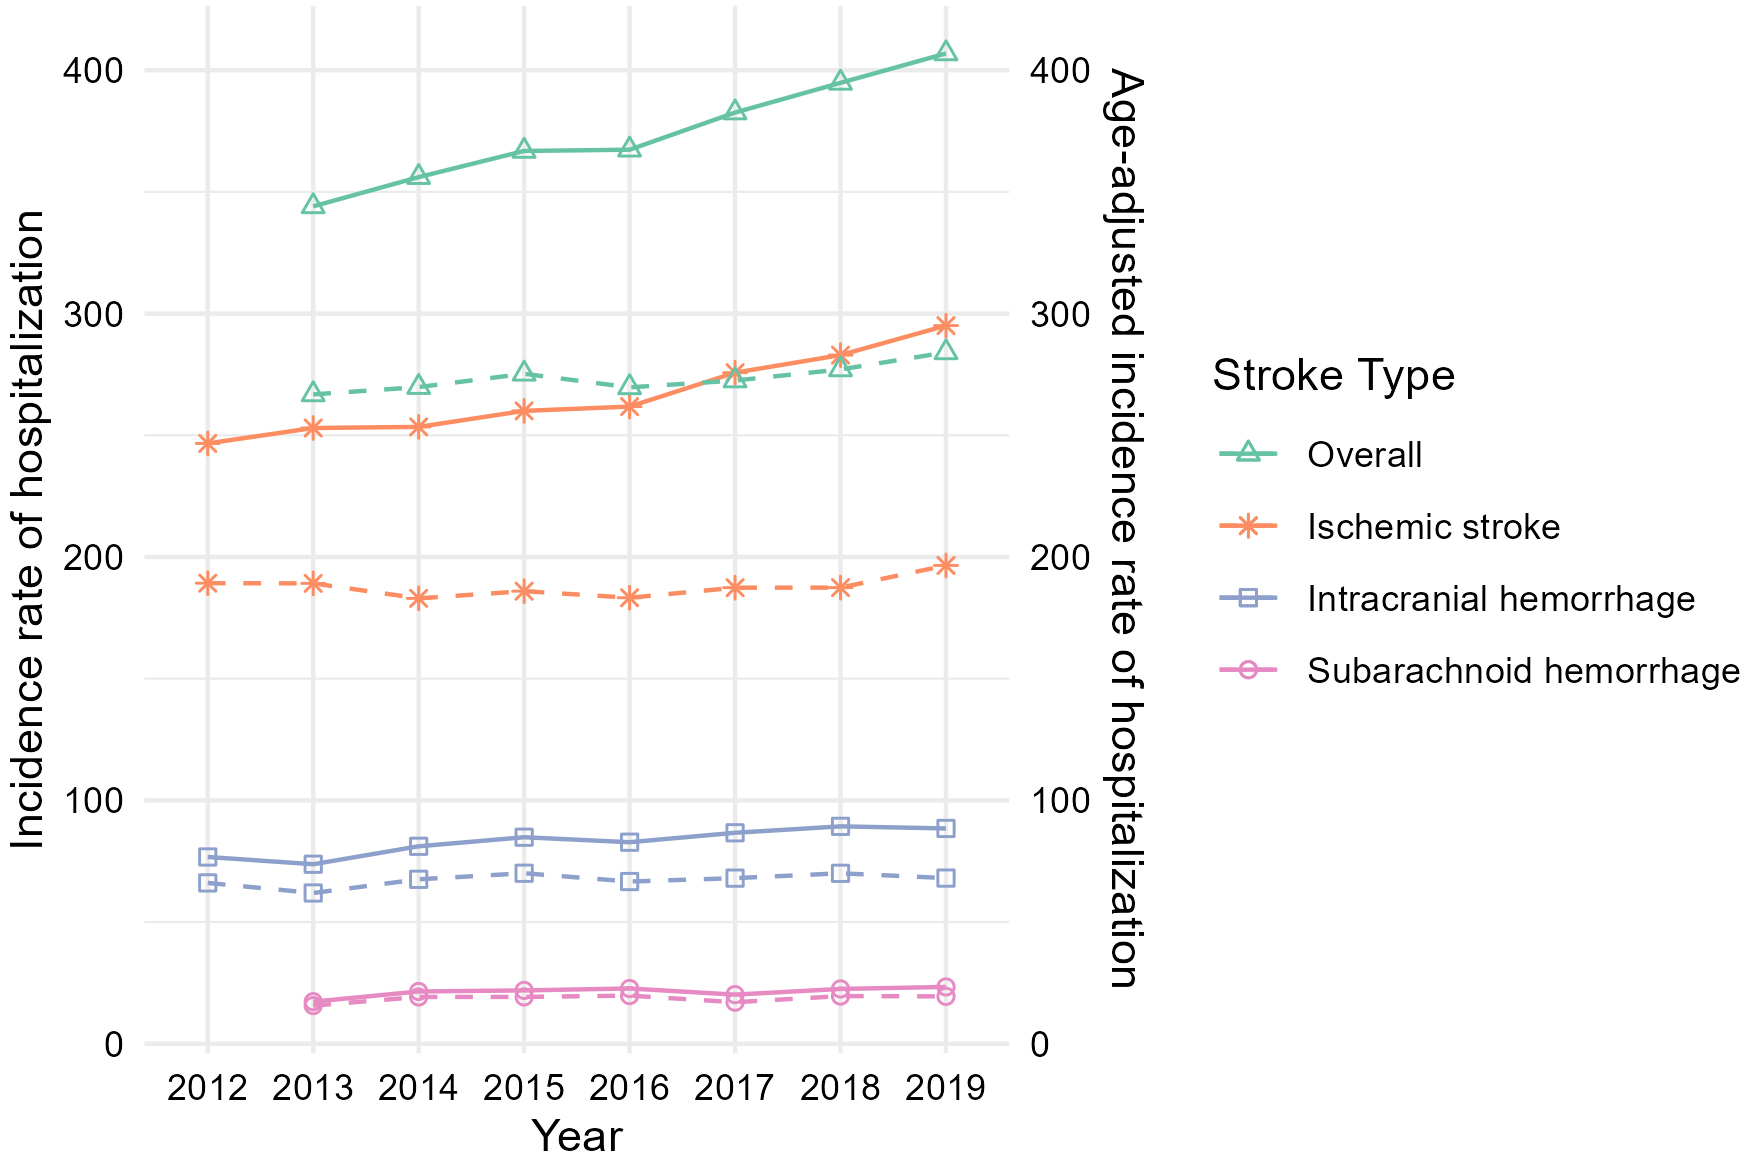
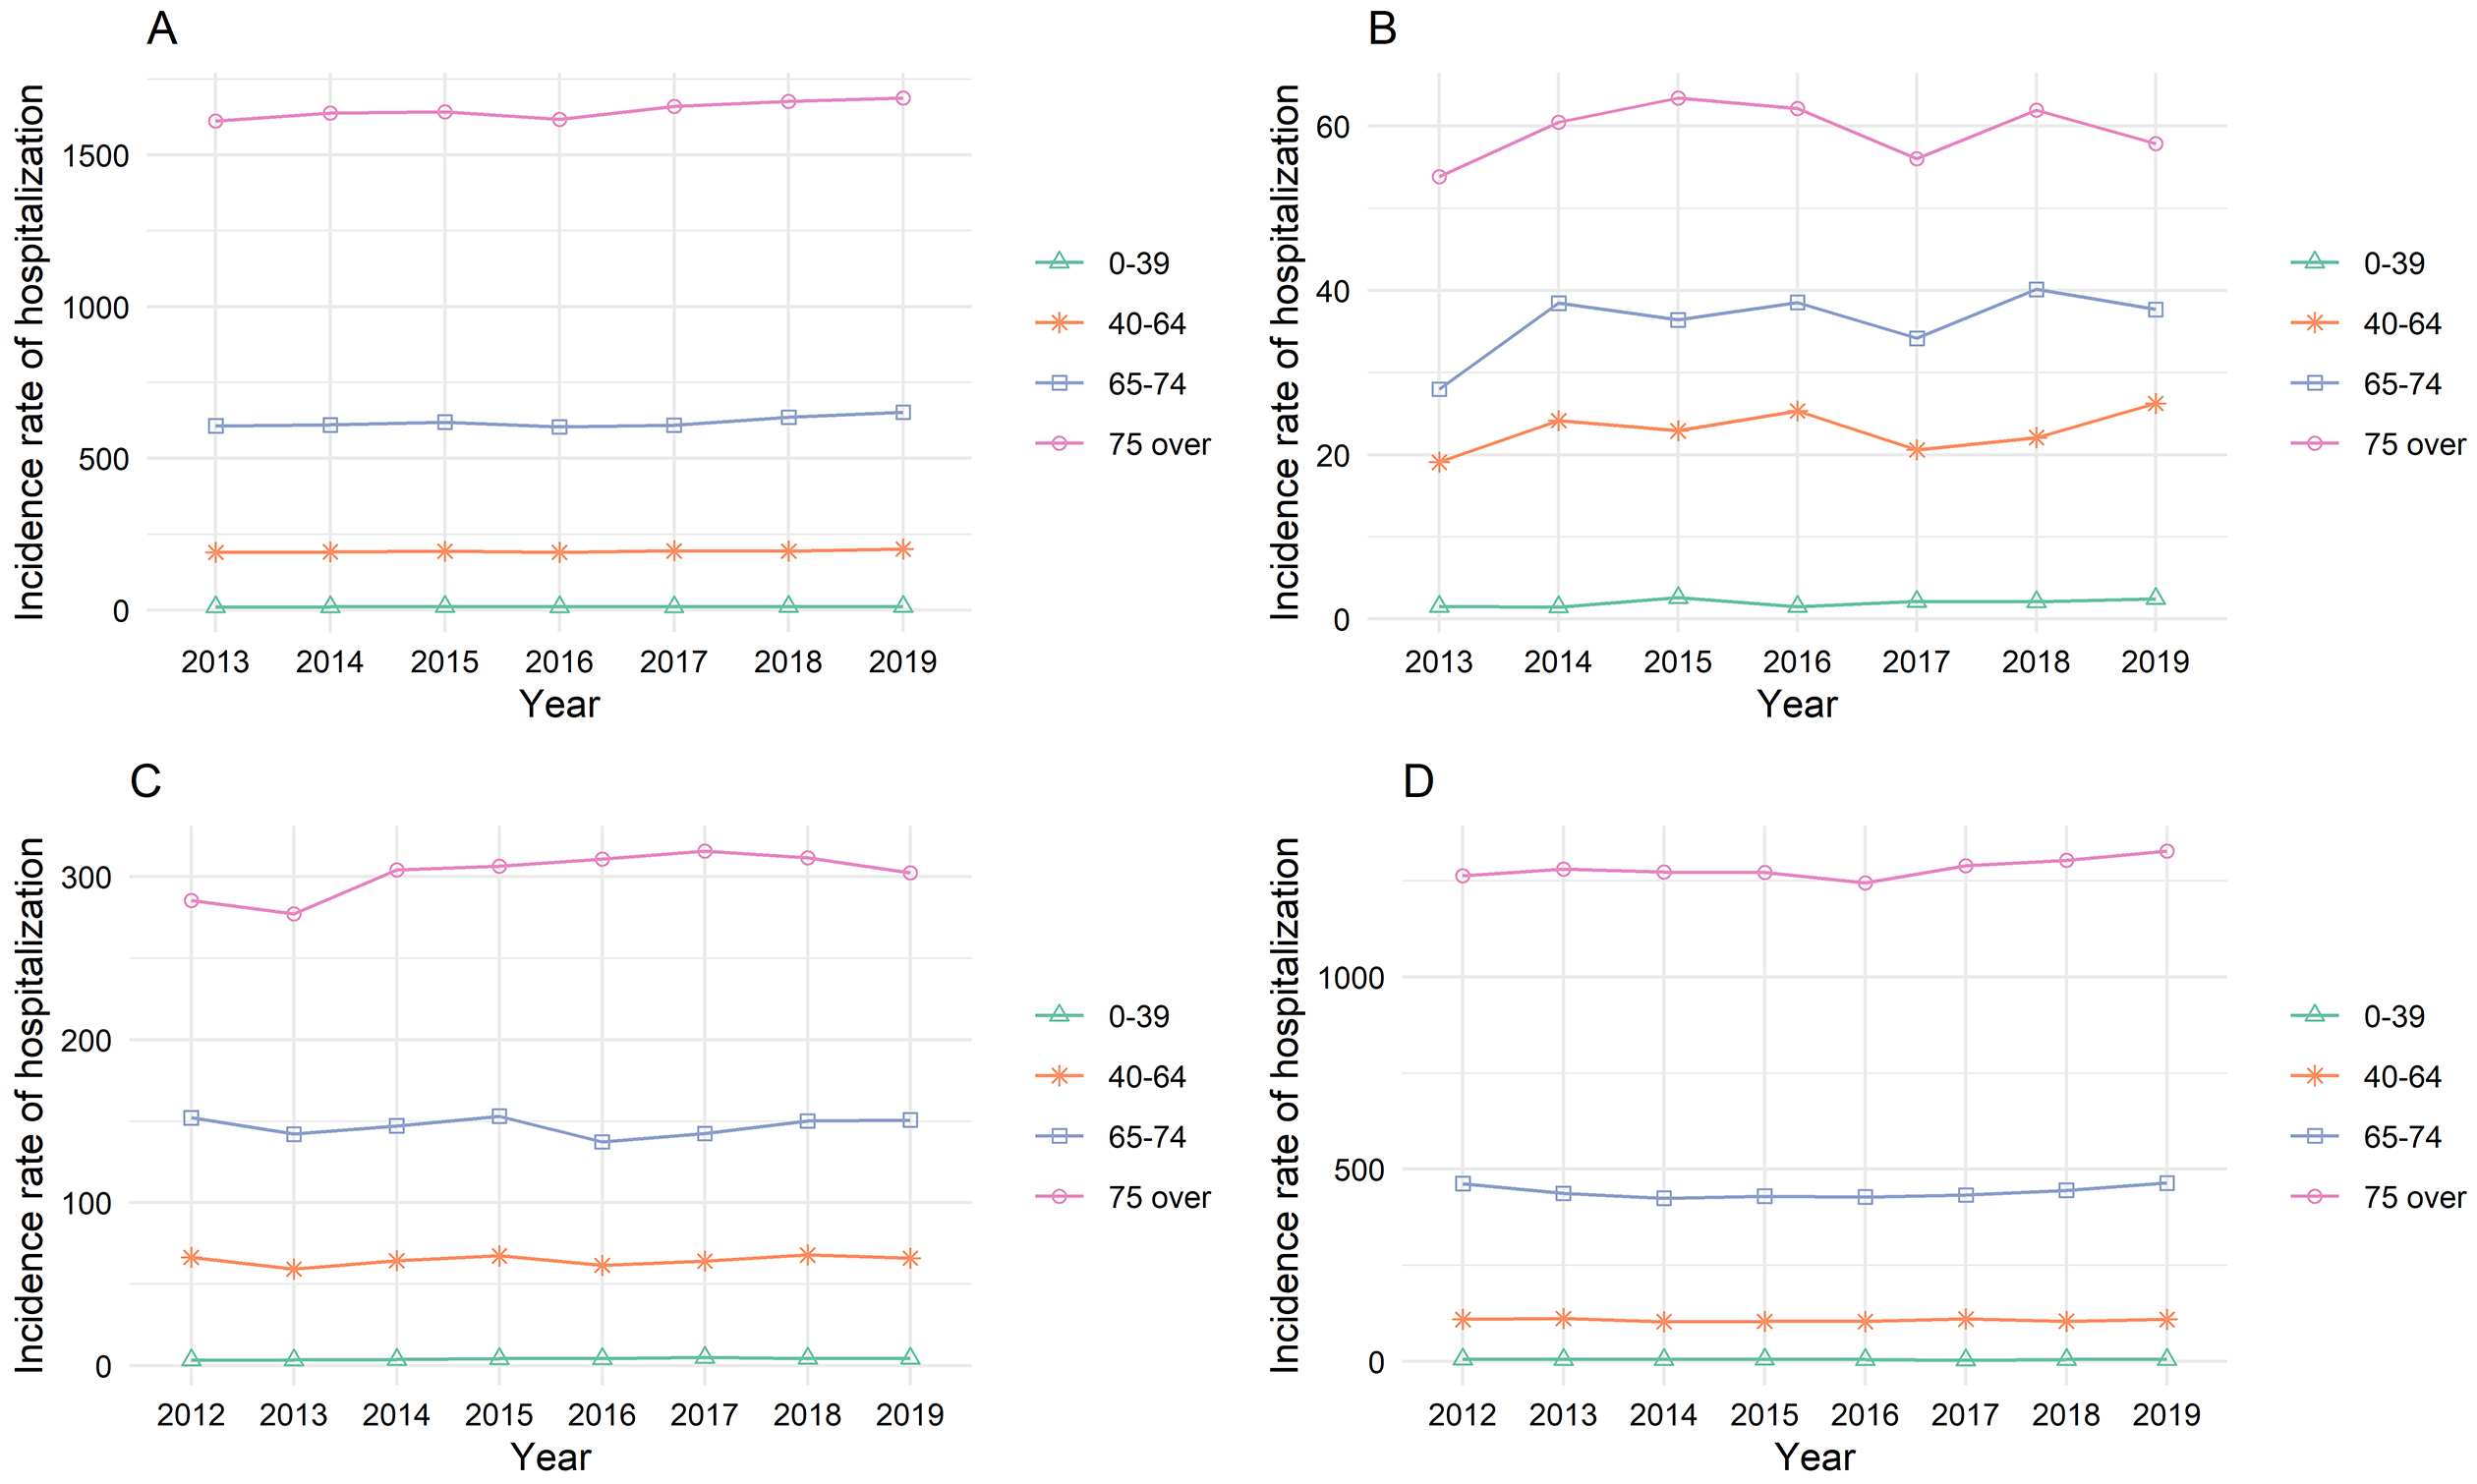
Figure 2. Trends in annual incidence rates of hospitalization per 100,000 people respective of age groups for each stroke subtype by age groups.
A. Total stroke; B. Subarachnoid hemorrhage; C. Intracranial hemorrhage; D. Ischemic stroke
Total stroke and SAH data in 2012 were excluded due to changes in the billing code.
SAH: subarachnoid hemorrhage.
From: National Trends in the Incidence of Hospitalization for Stroke in Japan