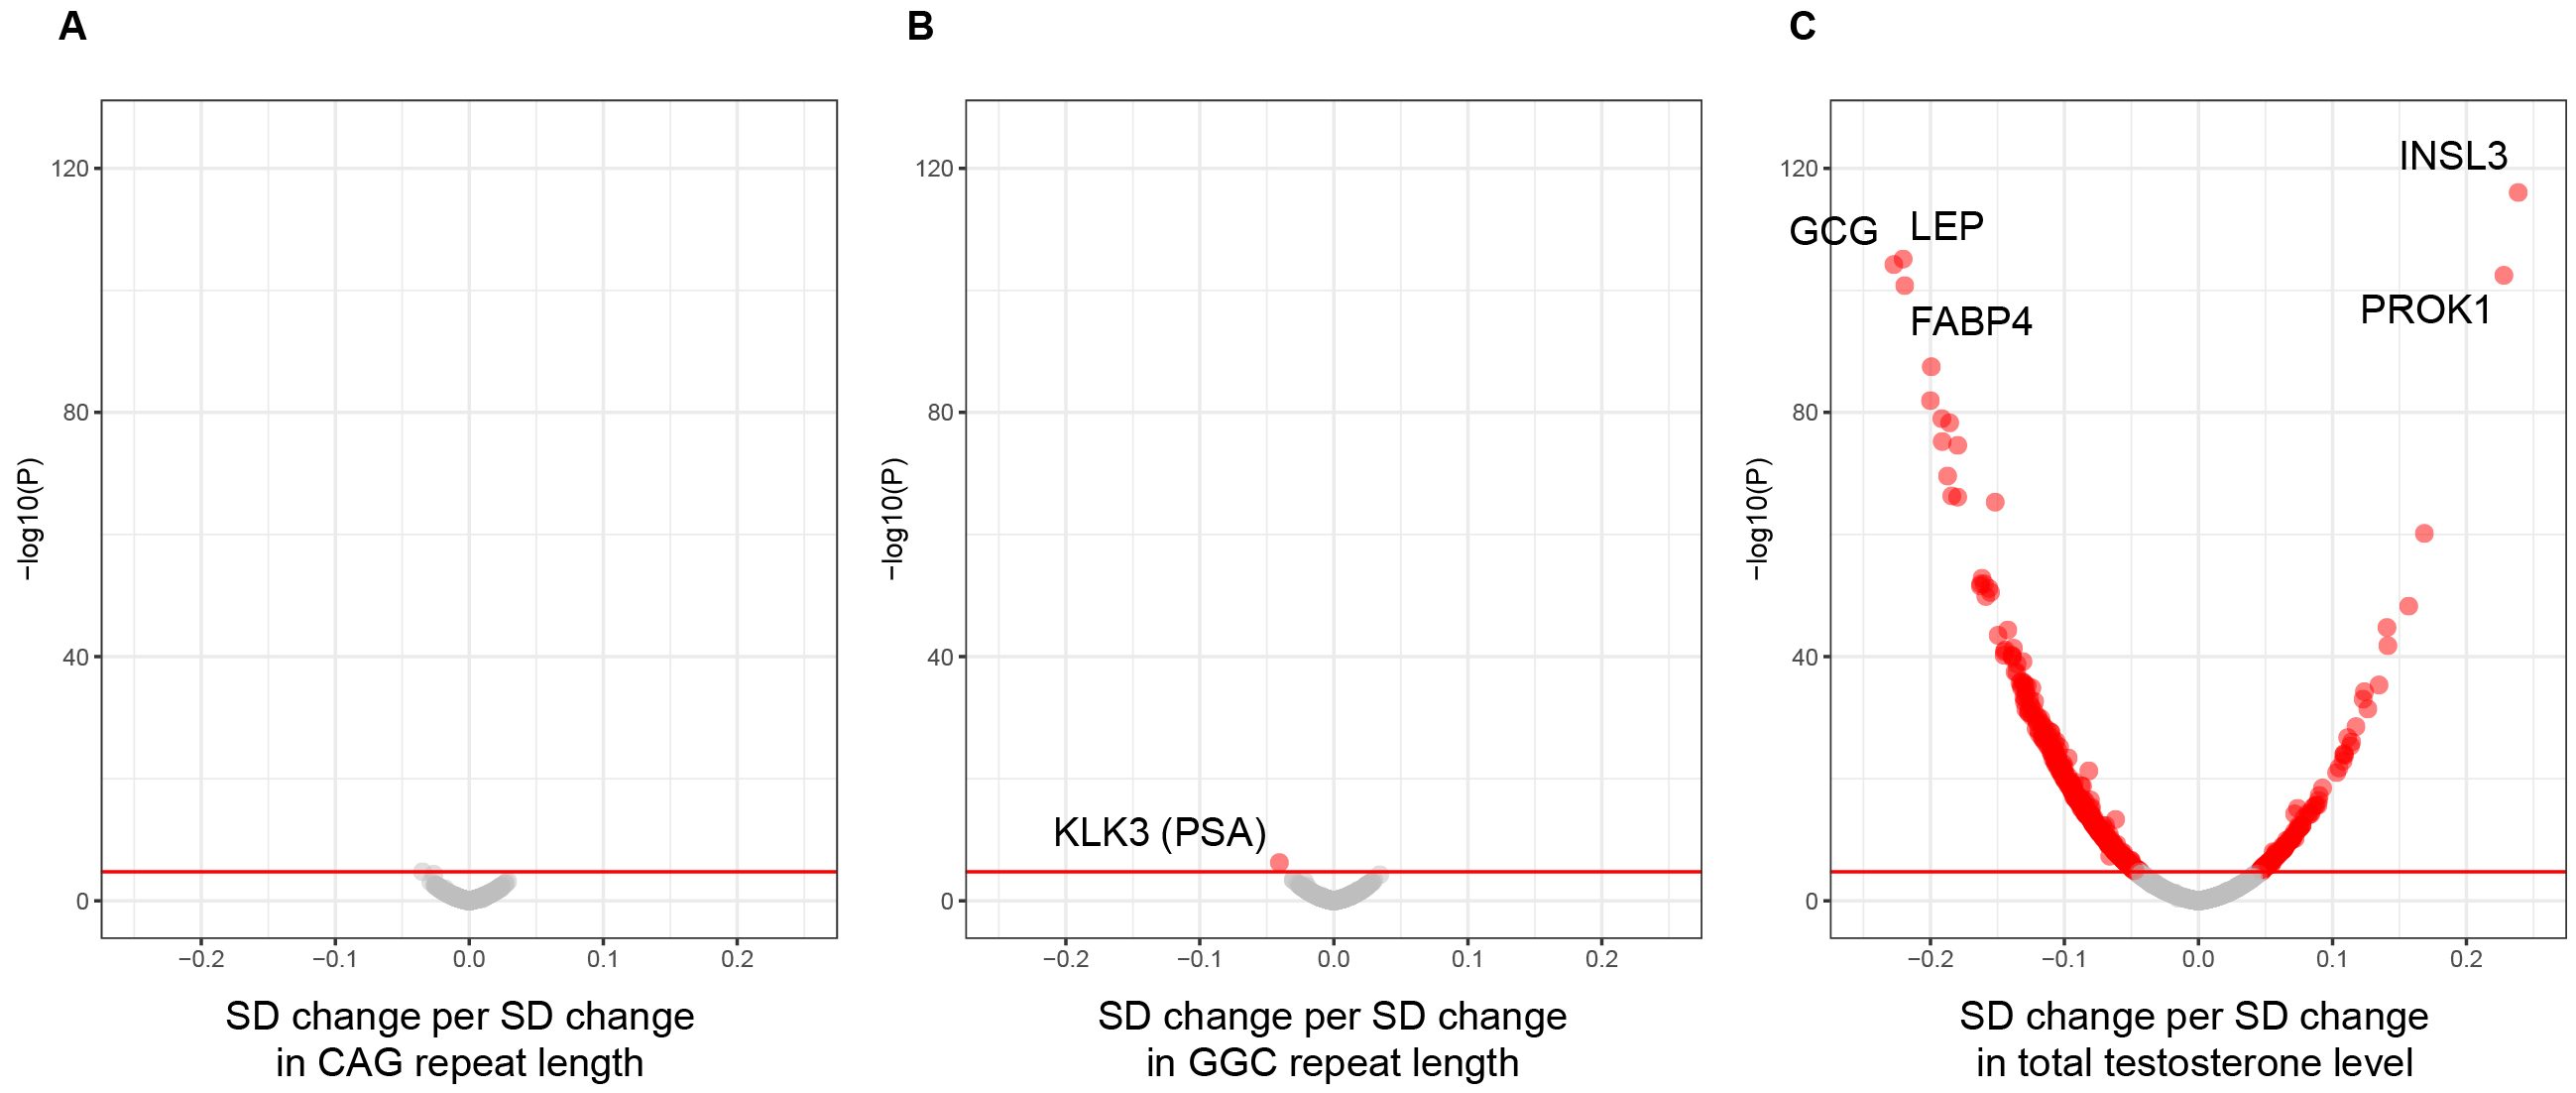
Figure 1. Observational associations between trinucleotide repeat lengths in the AR gene or total testosterone level and circulating protein levels.
Linear regression analysis to estimate associations of standard deviation (SD) change in inverse rank normalized circulating protein levels per 1 SD change in CAG and GGC trinucleotide repeat lengths or total testosterone level which are independent with each other, adjusted for age, 10 ancestry PCs, assessment center, SHBG, fasting time, and batch, but not for BMI, was performed in European-ancestry male participants in the UK Biobank (n = 14,353). Volcano plots to show the betas and raw P values for associations between, (A) CAG repeat length, (B) GGC repeat length, and, (C) total testosterone level, and circulating 2,921 protein levels. CAG and GGC repeat lengths were quantified from whole-exome sequence data. P values were corrected for the 2,921 protein levels with the Bonferroni method. Associations with statistical significance (corrected p < 0.05, indicated by a red line) are indicated in red circles.
AR: androgen receptor; PC: principal component; SHBG: sex hormone-binding globulin.
From: The Influence of Trinucleotide Repeats in the Androgen Receptor Gene and Testosterone Level on Circulating Proteins in Male Participants: Proteomics Analysis Using the UK Biobank Data