Figure 1. Proportion of BSI episodes in pediatric patients with cancer stratified by cancer type. (A) Proportion of BSIs across all chemotherapy courses. (B) Proportion of BSIs during FN episodes across all treatment courses. (C) Proportion of BSIs without concurrent FN across all treatment courses. (D) Proportion of BSIs among FN episodes. Point estimates with 95% confidence intervals are presented. Fisher’s exact test was used for group comparisons, with significant differences denoted by solid lines and non-significant differences by dashed lines.
ALL: acute lymphoblastic leukemia; AML: acute myeloid leukemia; BT: brain tumors; BSI: bloodstream infection; FN: febrile neutropenia; ST: solid tumor.
From: Incidence of Bloodstream Infections in Pediatric Patients with Cancer during Febrile Neutropenia: A Retrospective Study
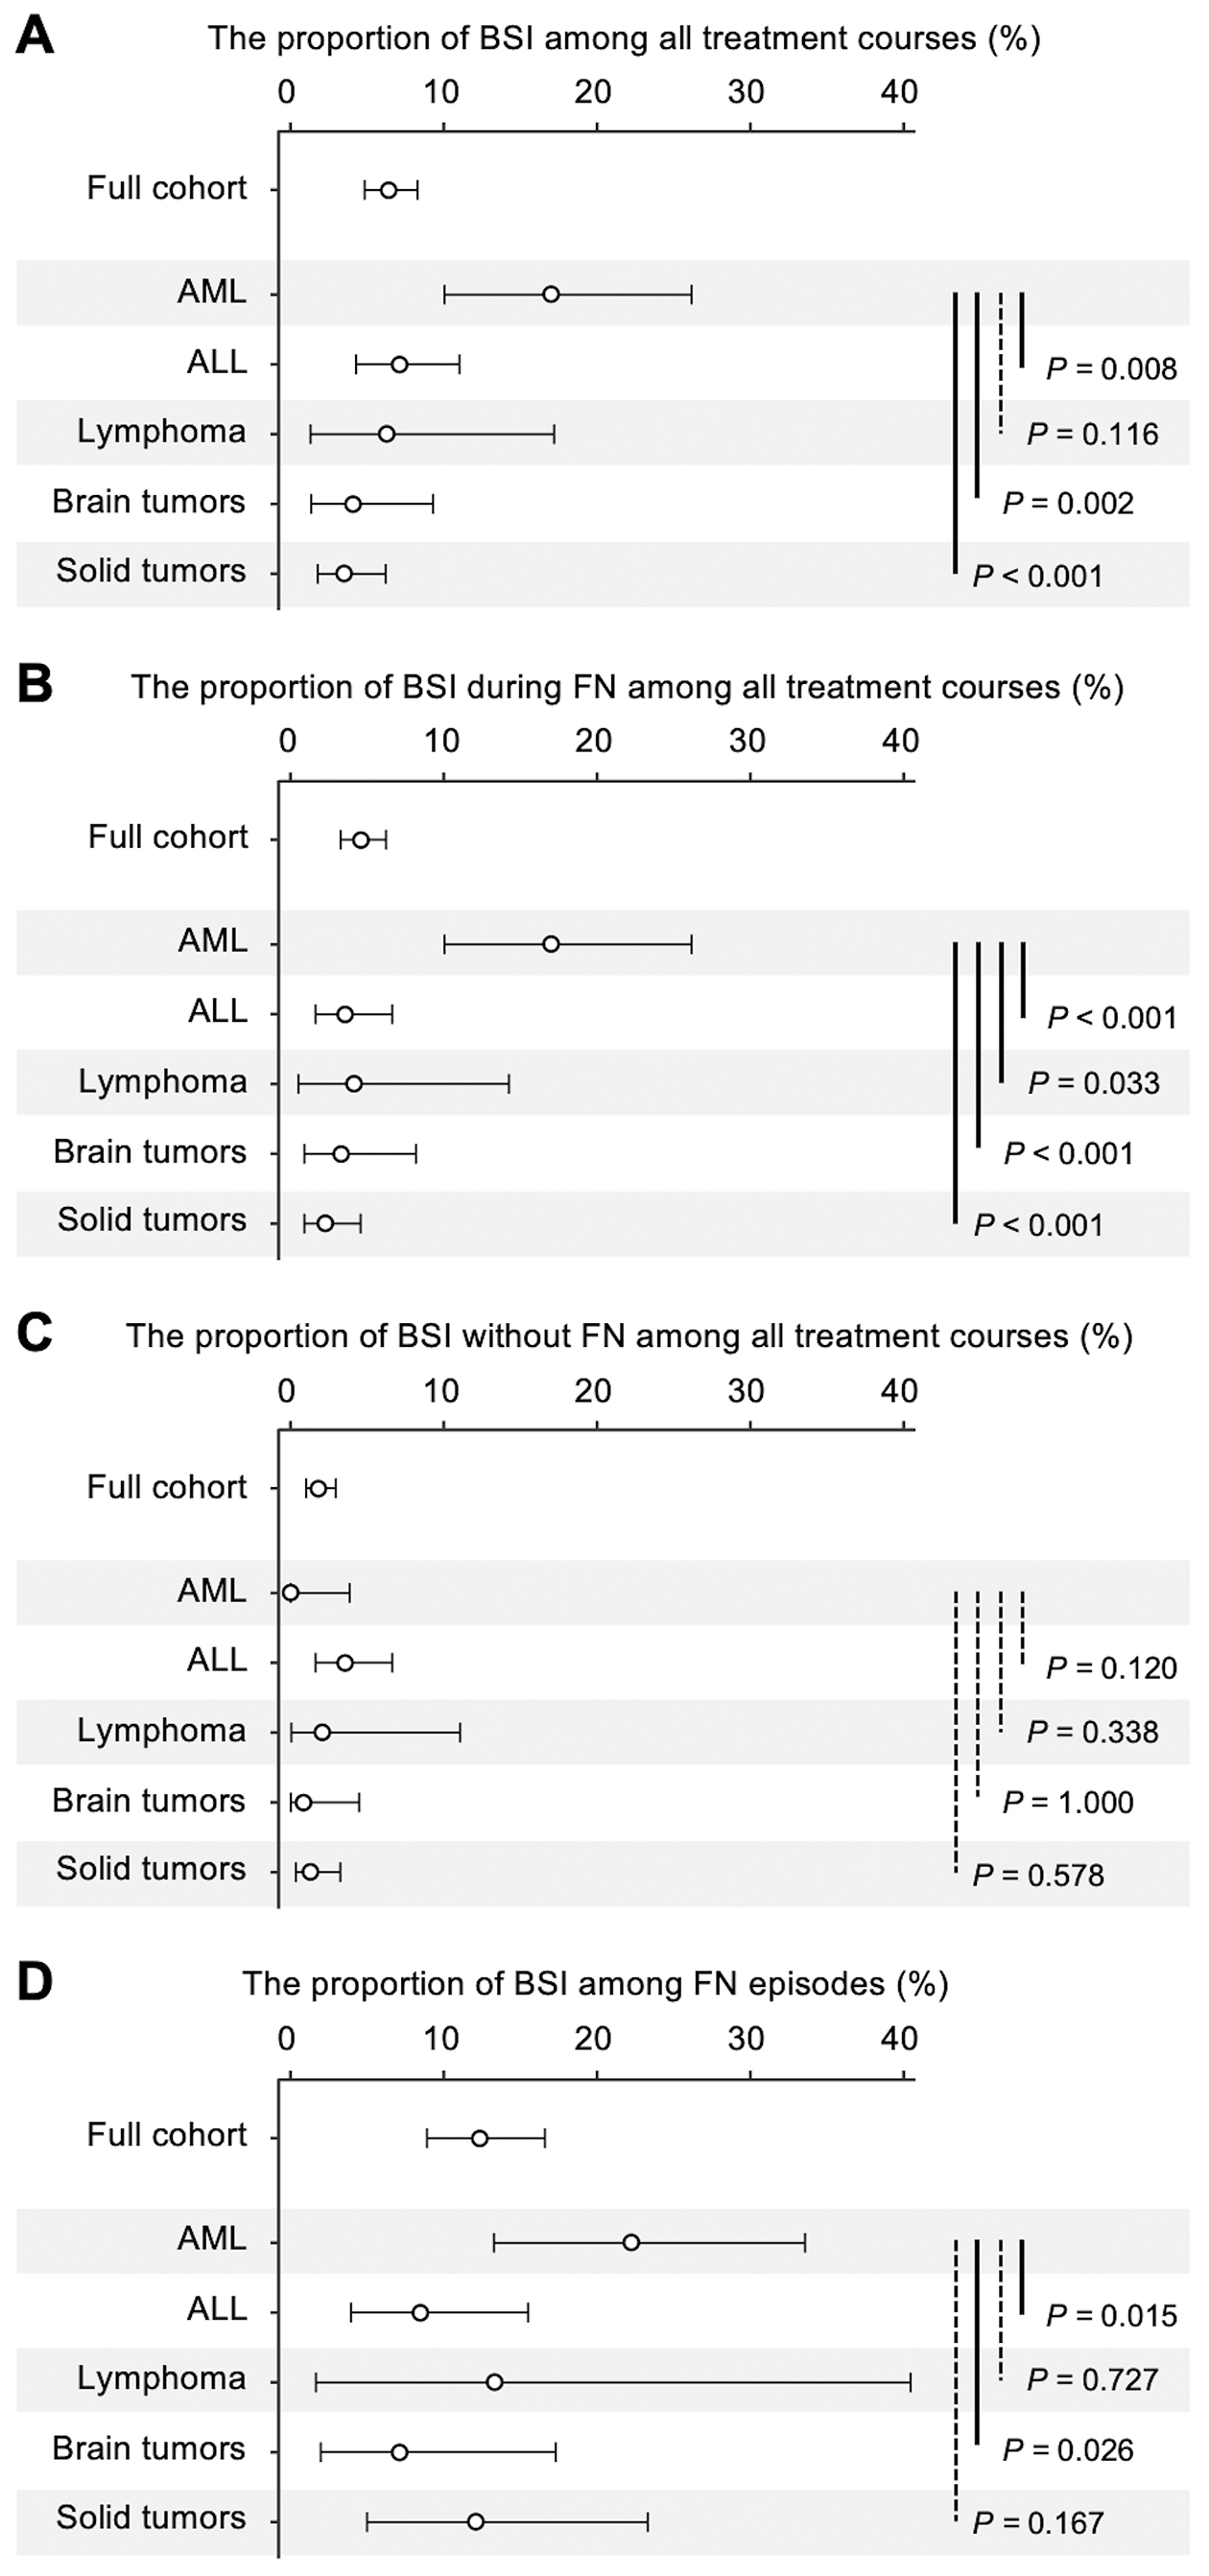
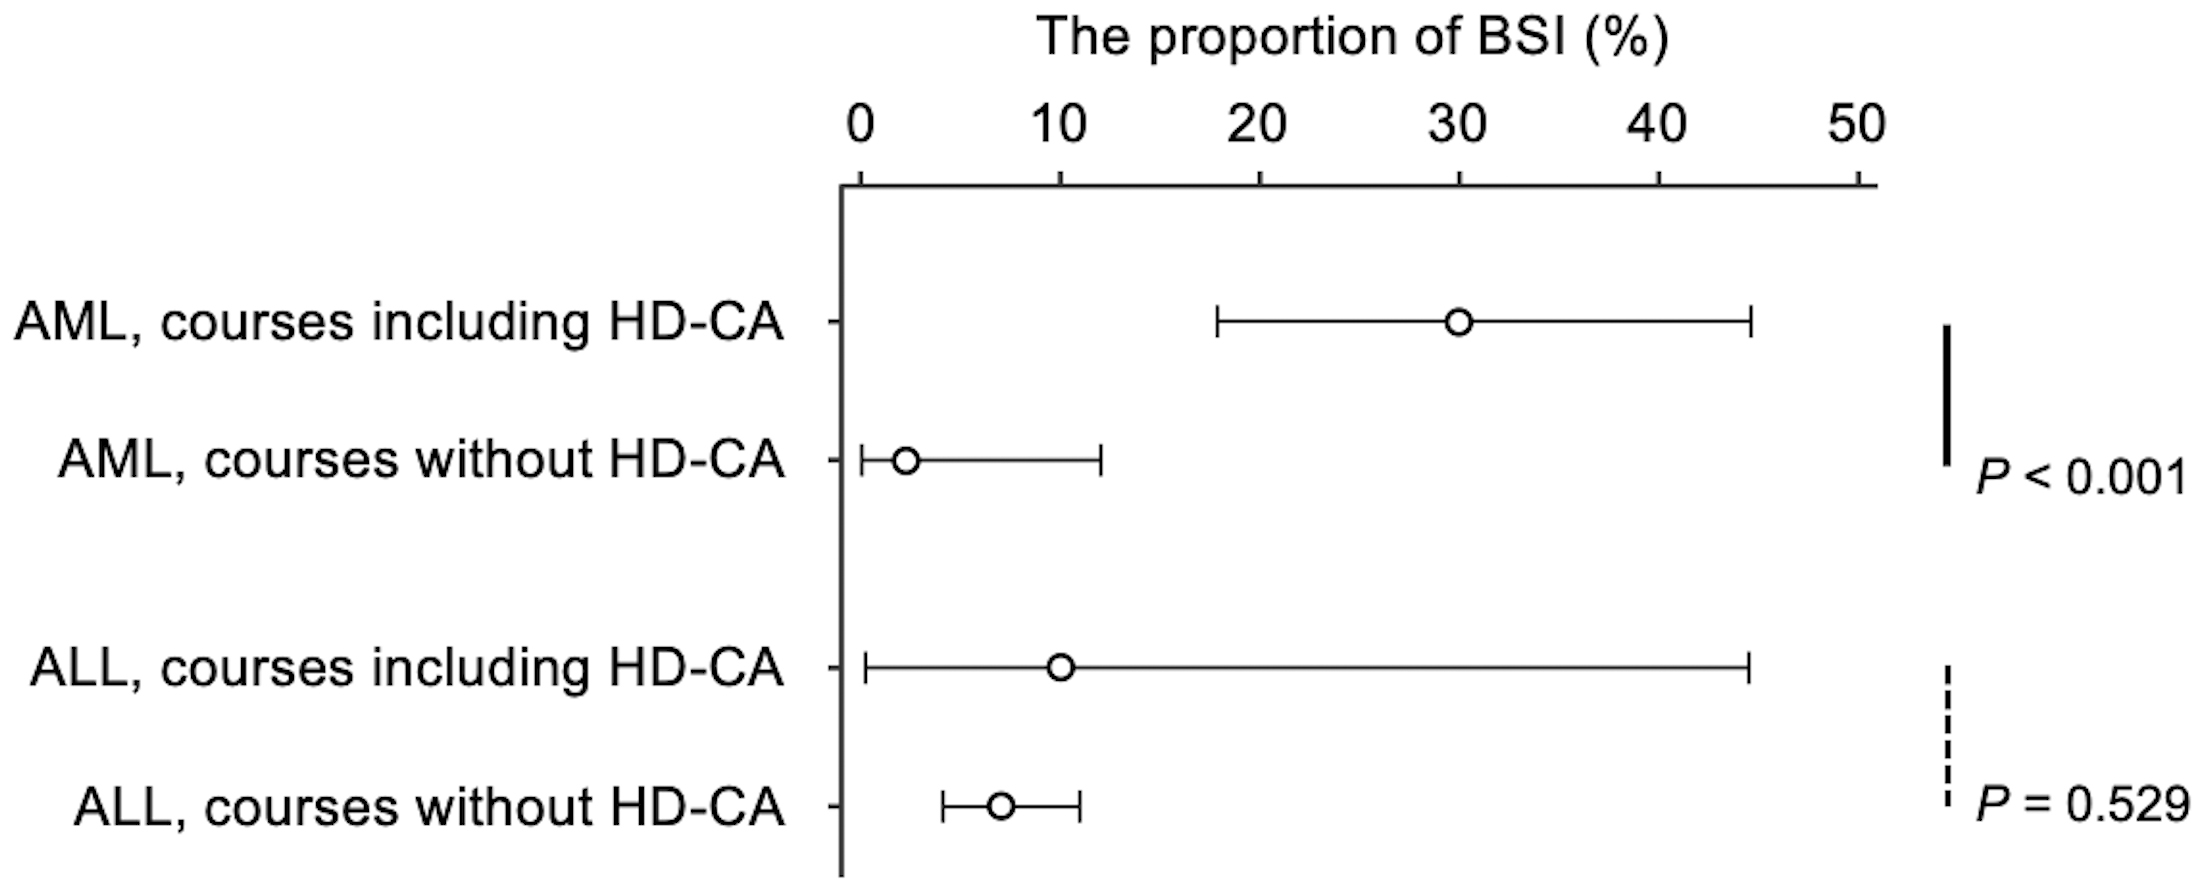
Figure 2. Comparative analysis of BSI incidence and proportions in pediatric patients with AML and ALL undergoing chemotherapy with and without HD-CA. BSI incidence proportions and 95% confidence intervals are displayed. Group comparisons were performed using Fisher’s exact test, with significant differences indicated by solid lines and non-significant differences by dashed lines.
ALL: acute lymphoblastic leukemia; AML: acute myeloid leukemia; BSI: bloodstream infection; HD-CA: high-dose cytarabine.
From: Incidence of Bloodstream Infections in Pediatric Patients with Cancer during Febrile Neutropenia: A Retrospective Study