Figure 2. Therapeutic effects of primary treatment and pemafibrate treatment evaluating by using 3 markers (ALT, E value, and type IV collagen), Boxplots (median, upper and lower quartiles, range and Outliers [circles]) of ALT, E value, and type IV collagen in group 1a, group 2b, 2c and group 3d, 3e.
(a) A statistical improvement of all markers was observed in sensitive group 1 after primary treatment.
Note: p-values were calculated by Wilcoxon’s signed-rank test (p < 0.001 of ALT, p < 0.01 of E value, and p < 0.01 of type IV collagen) and primary treatment was statistically effective.
(b) No improvement was observed in group 2 after primary treatment.
Note: p-values were calculated but there were not significant differences.
(c) A statistical improvement was observed in group 2 after pemafibrate treatment. Note: P-values were p < 0.01 (ALT), p < 0.79 (E value) and p,0.045 (type IV collagen).
(d), (e) No improvement of 3 markers was observed in treatment resistant
Group 3 after primary treatment and pemafibrate one.
Note: p-values were calculated, but there were not significant differences after both primary and pemafibrate treatments.
ALT: alanine aminotransferase; E value: elasticity value.
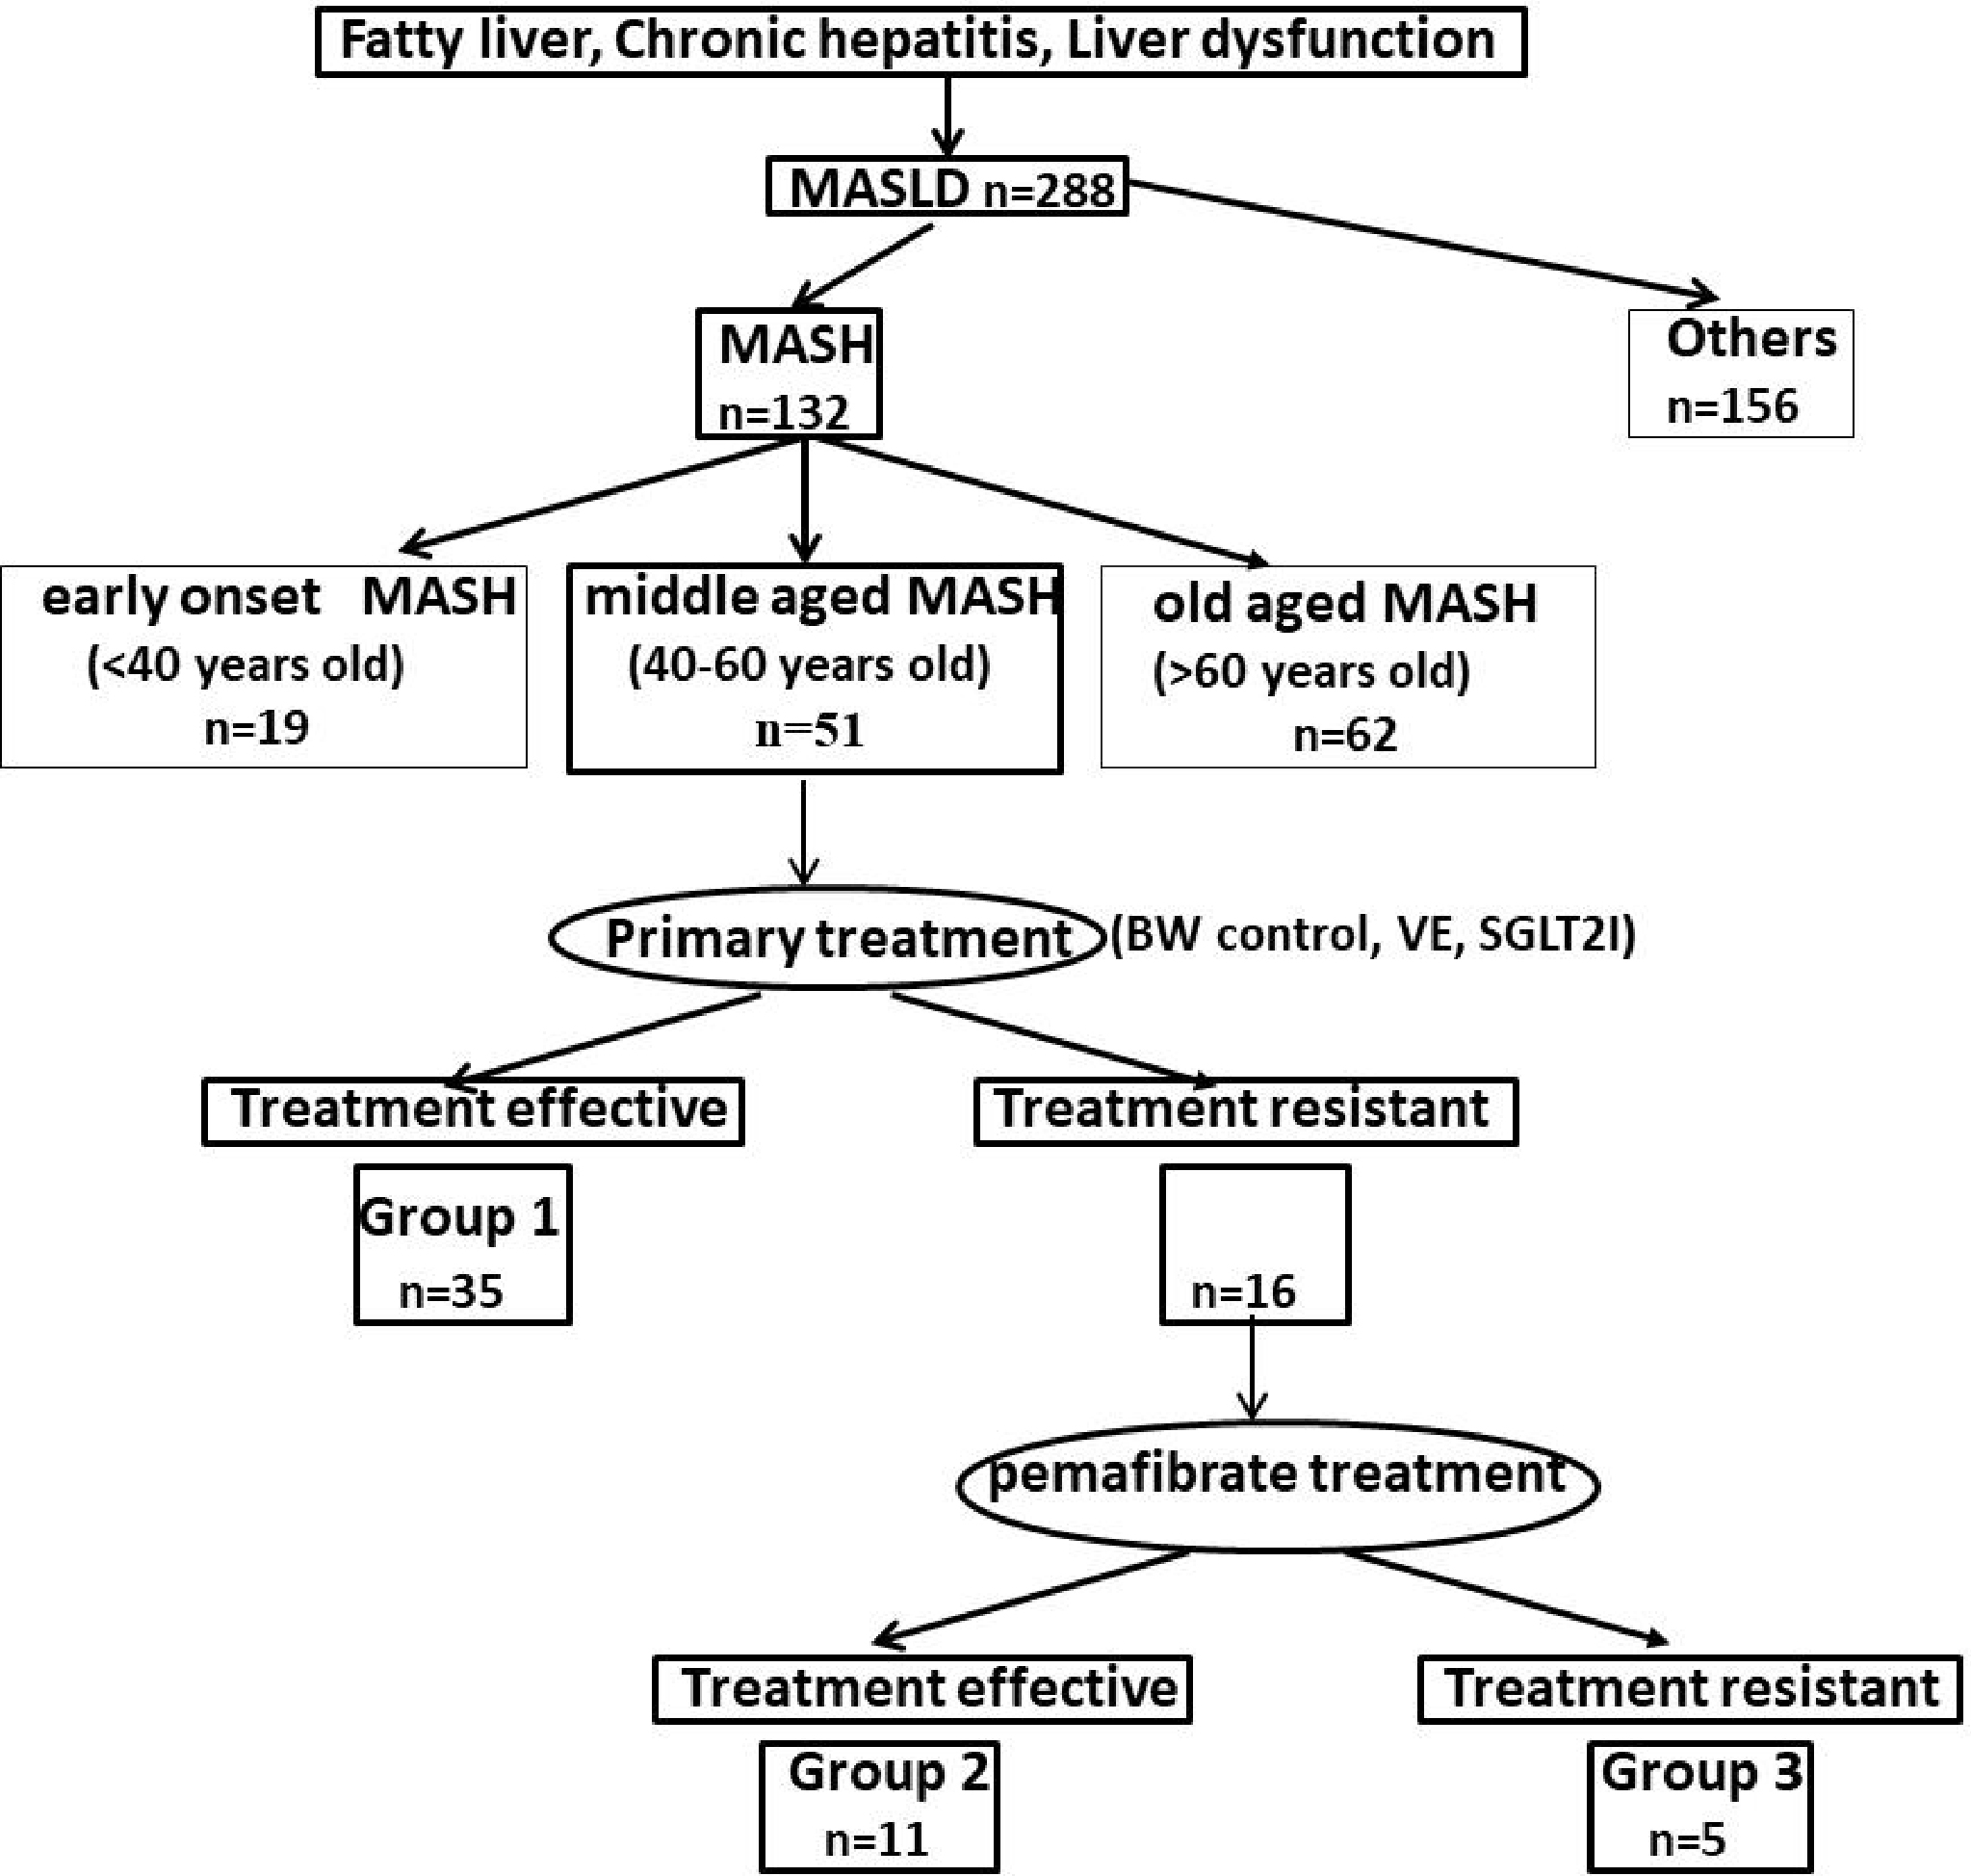
From: Treatment Resistant Patients with Metabolic Dysfunction-associated Steatohepatitis: Long-term Follow-up Prospective Study
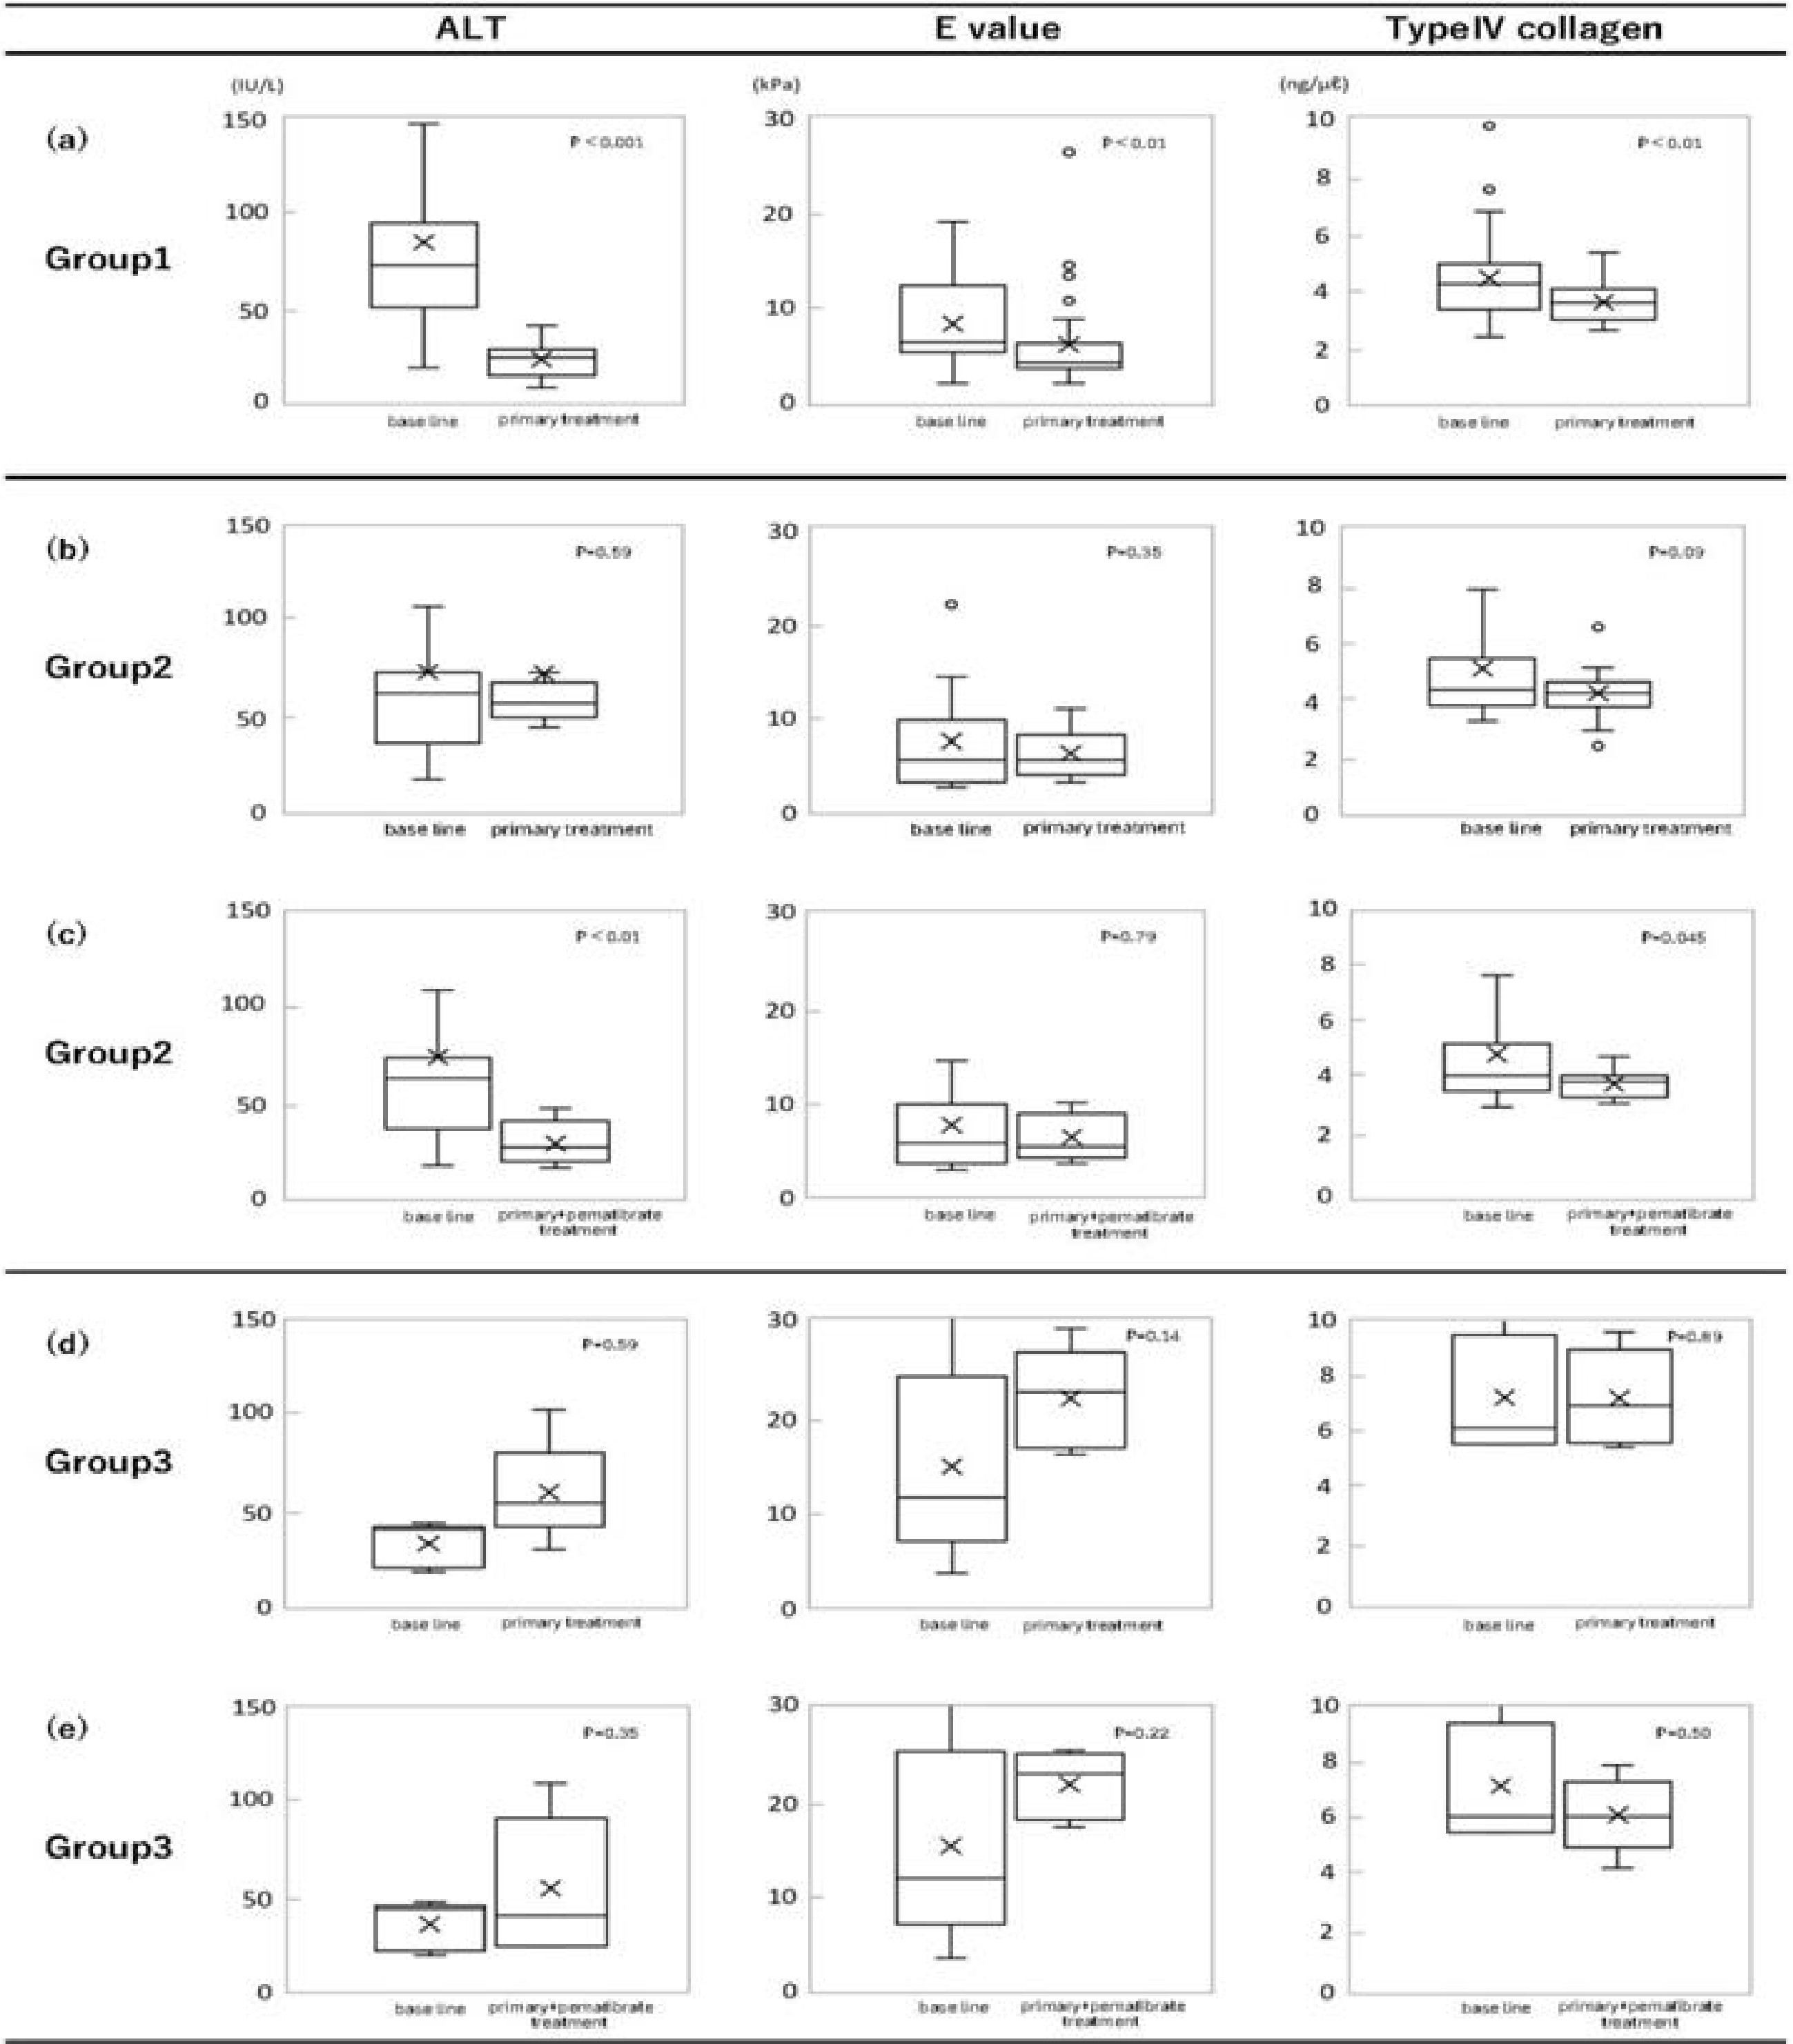
Figure 3. Identification of treatment resistance-related clinical parameters Boxplots (median, upper and lower quartiles, range and outliers [circles]), comparing parameter level distributions of treatment-sensitive group 1+group 2 and those of resistant group 3.
a)~h) Baseline levels of characteristics (BMI, VF, CAP, HbA1c, f-IRI, TG, LDL cholesterol, and ALT) were demonstrated, comparing treatment-sensitive group 1+group 2 and resistant group 3. These characteristic levels had no difference.
Note: P-values were calculated by use of t-test, but there were not significant differences of all.
i)~k) Baseline levels of characteristics (type IV collagen, E value, and FIB-4 index) were demonstrated, comparing treatment-sensitive group 1+group 2 and resistant group 3. These characteristic levels had differences between two.
Note: P-values were calculated by use of t-test, and each of them was p < 0.001 (type IV collagen), p < 0.01 (E value) and p < 0.001 (FIB-4 index). There were significant differences in P-value.
ALT: alanine aminotransferase; BMI: body mass index; CAP: controlled attenuation parameter; E value: elasticity value; f-IRI: fasting immunoreactive insulin; TG: triglyceride; VF: visceral fat.
From: Treatment Resistant Patients with Metabolic Dysfunction-associated Steatohepatitis: Long-term Follow-up Prospective Study
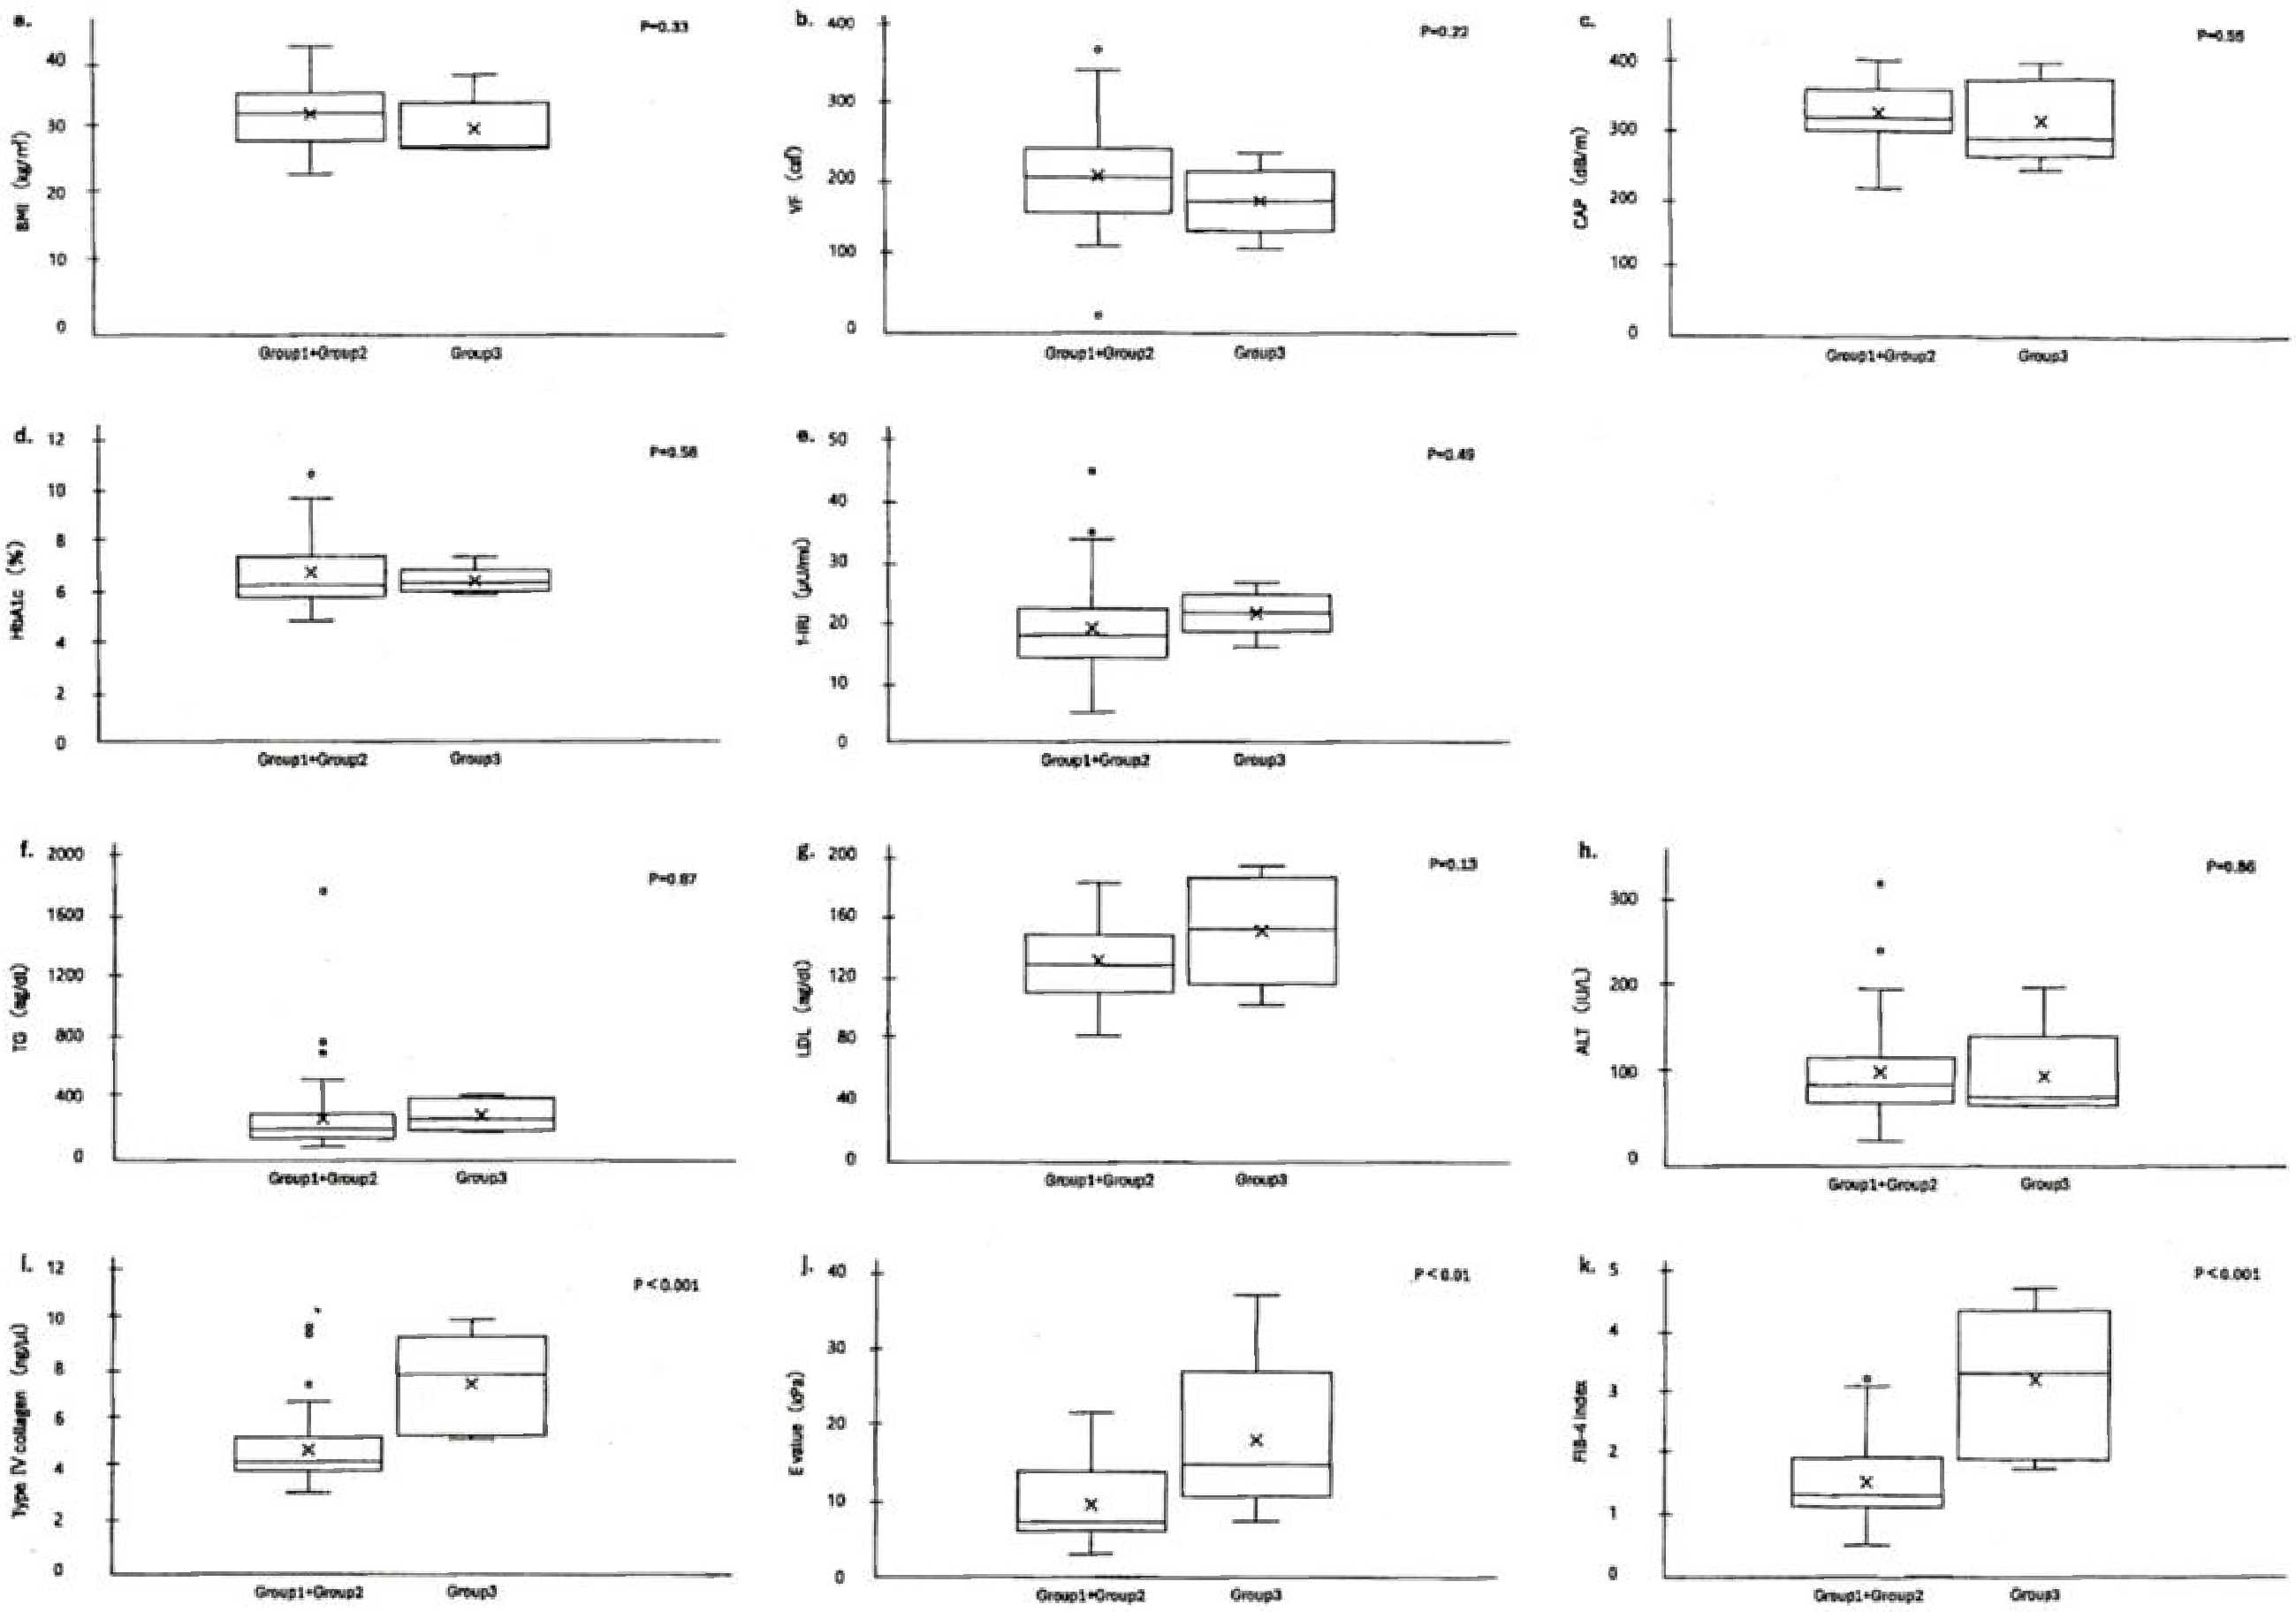
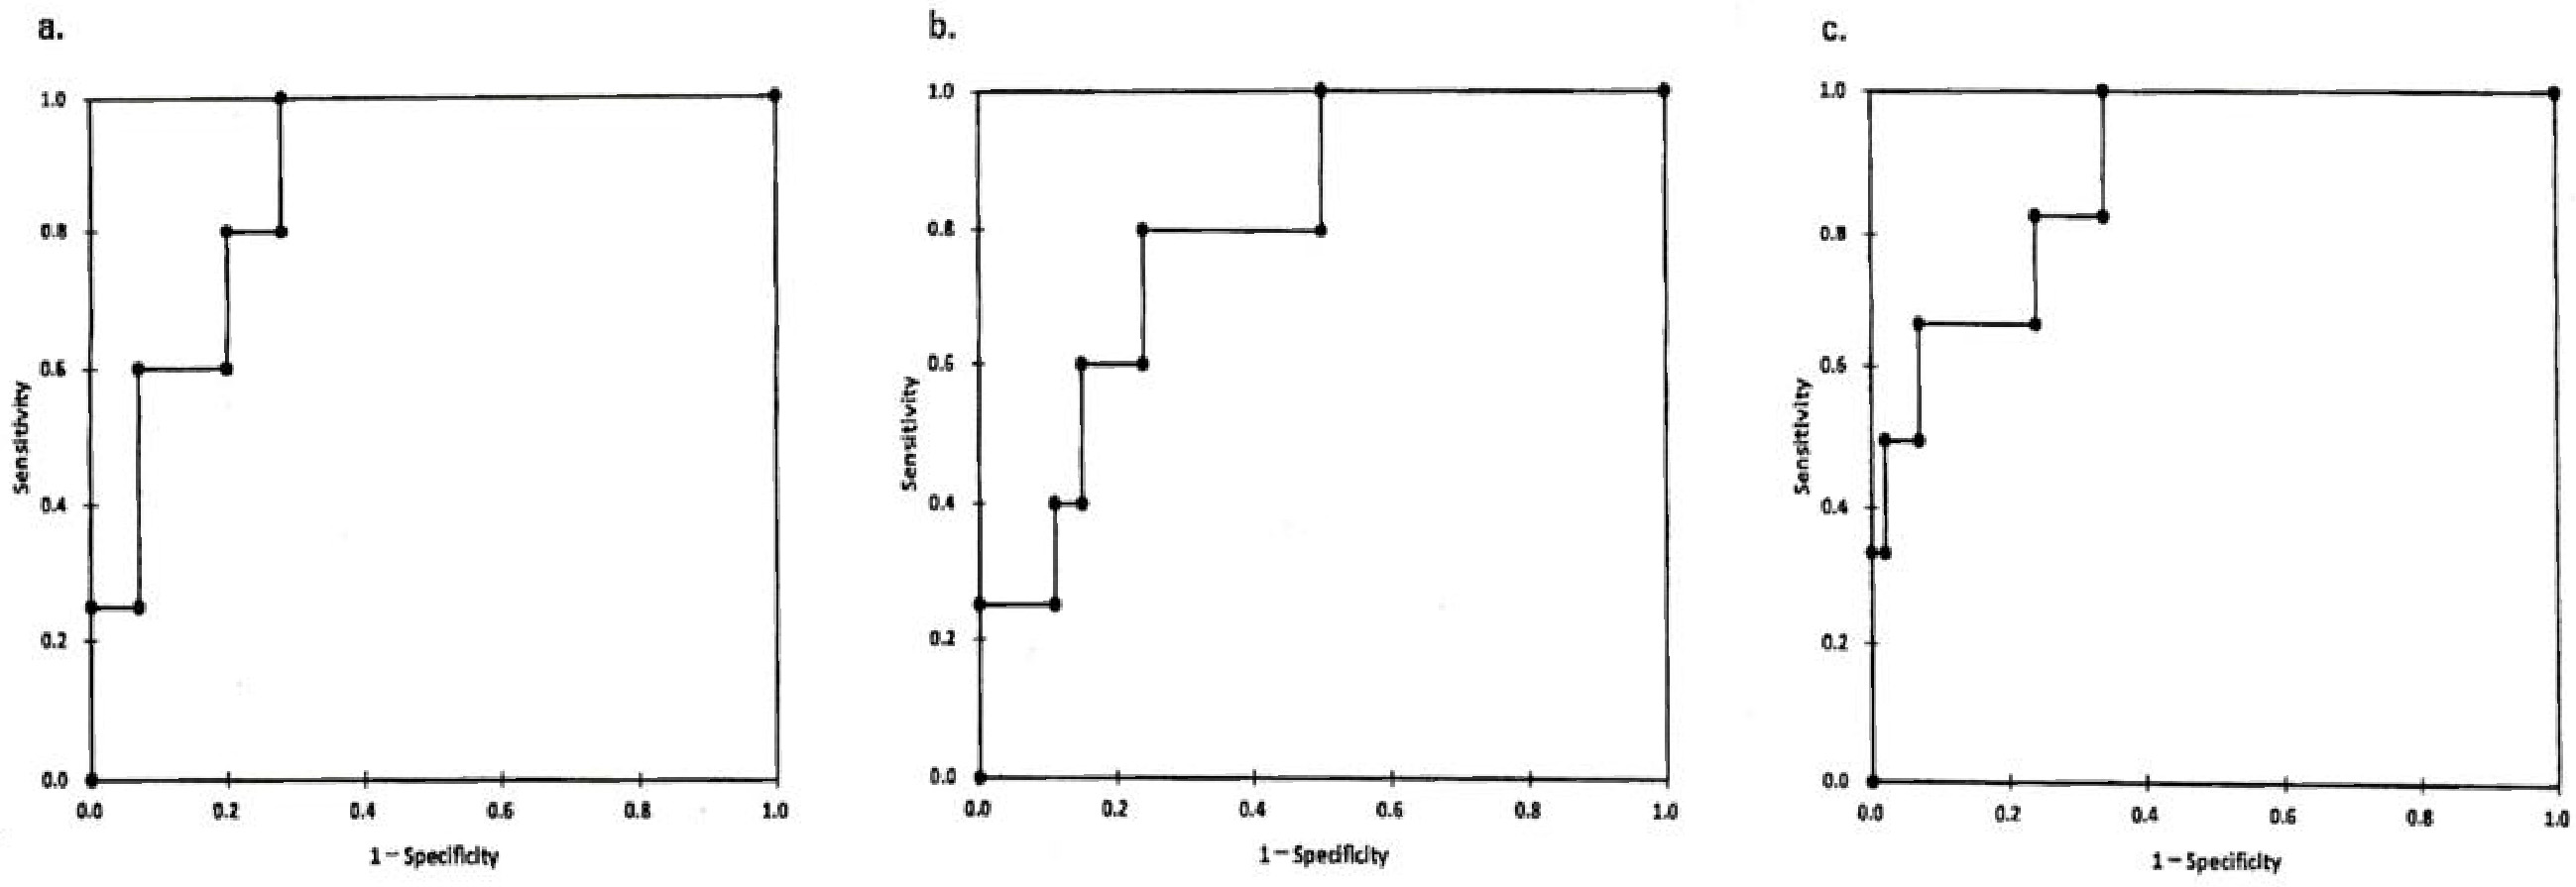
Figure 4. ROC analysis of (a) type IV collagen. The sensitivity and specificity of type IV collagen were determined in the study to discriminate type IV collagen of treatment-sensitive patients (group 1 + group 2) from that of treatment-resistant group 3.
(b), (c) The sensitivity and specificity of E value (b) and FIB-4 index (c) were determined in the same study to discriminate.
Cutoff values were determined 5.3 ng/ml for type IV collagen (a), 13.7 kPa for E value (b) and 1.89 for FIB-4 index (c), respectively.
E value: elasticity value; FIB-4: age (year) x AST (IU/L)/platelet count (104/L) x ALT (IU/L)1/2; ROC: receiver operating characteristic.
From: Treatment Resistant Patients with Metabolic Dysfunction-associated Steatohepatitis: Long-term Follow-up Prospective Study