Figure 1. Hearing test results of the normal and extended high-frequency (EHF) hearing loss groups.
(A) Thresholds of pure-tone audiometry (PTA). (B) Emission levels (from the noise floor) of the distortion product otoacoustic emissions (DPOAEs). Values are shown as medians, and error bars represent interquartile ranges. Asterisks denote statistical significance (p < 0.05). Significance levels: p < 0.001 (***), p < 0.0001 (****).
From: Music Listening Habits and Auditory Functions in Medical College Students
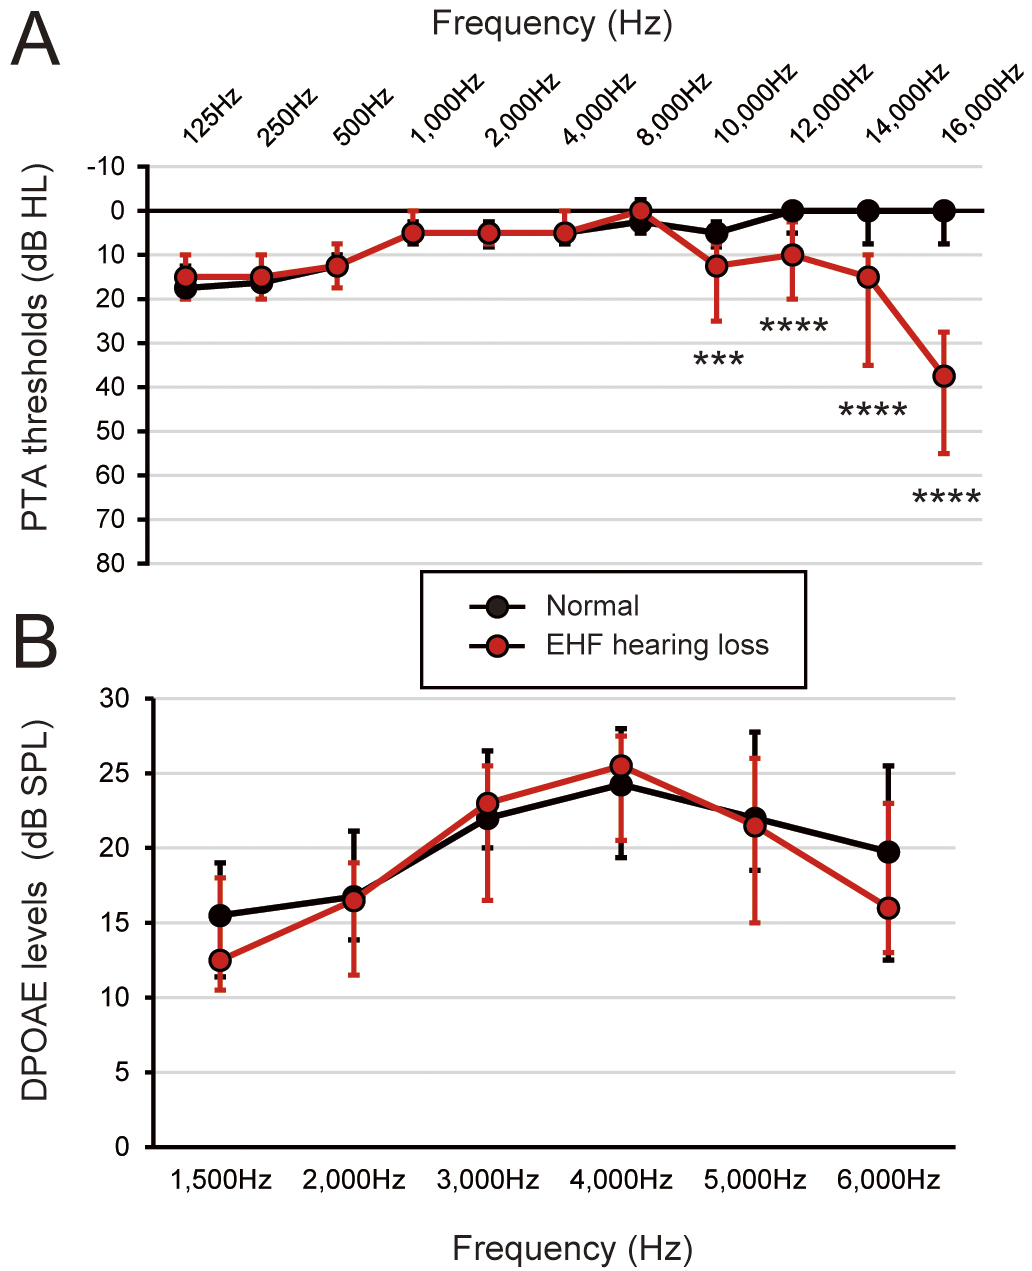
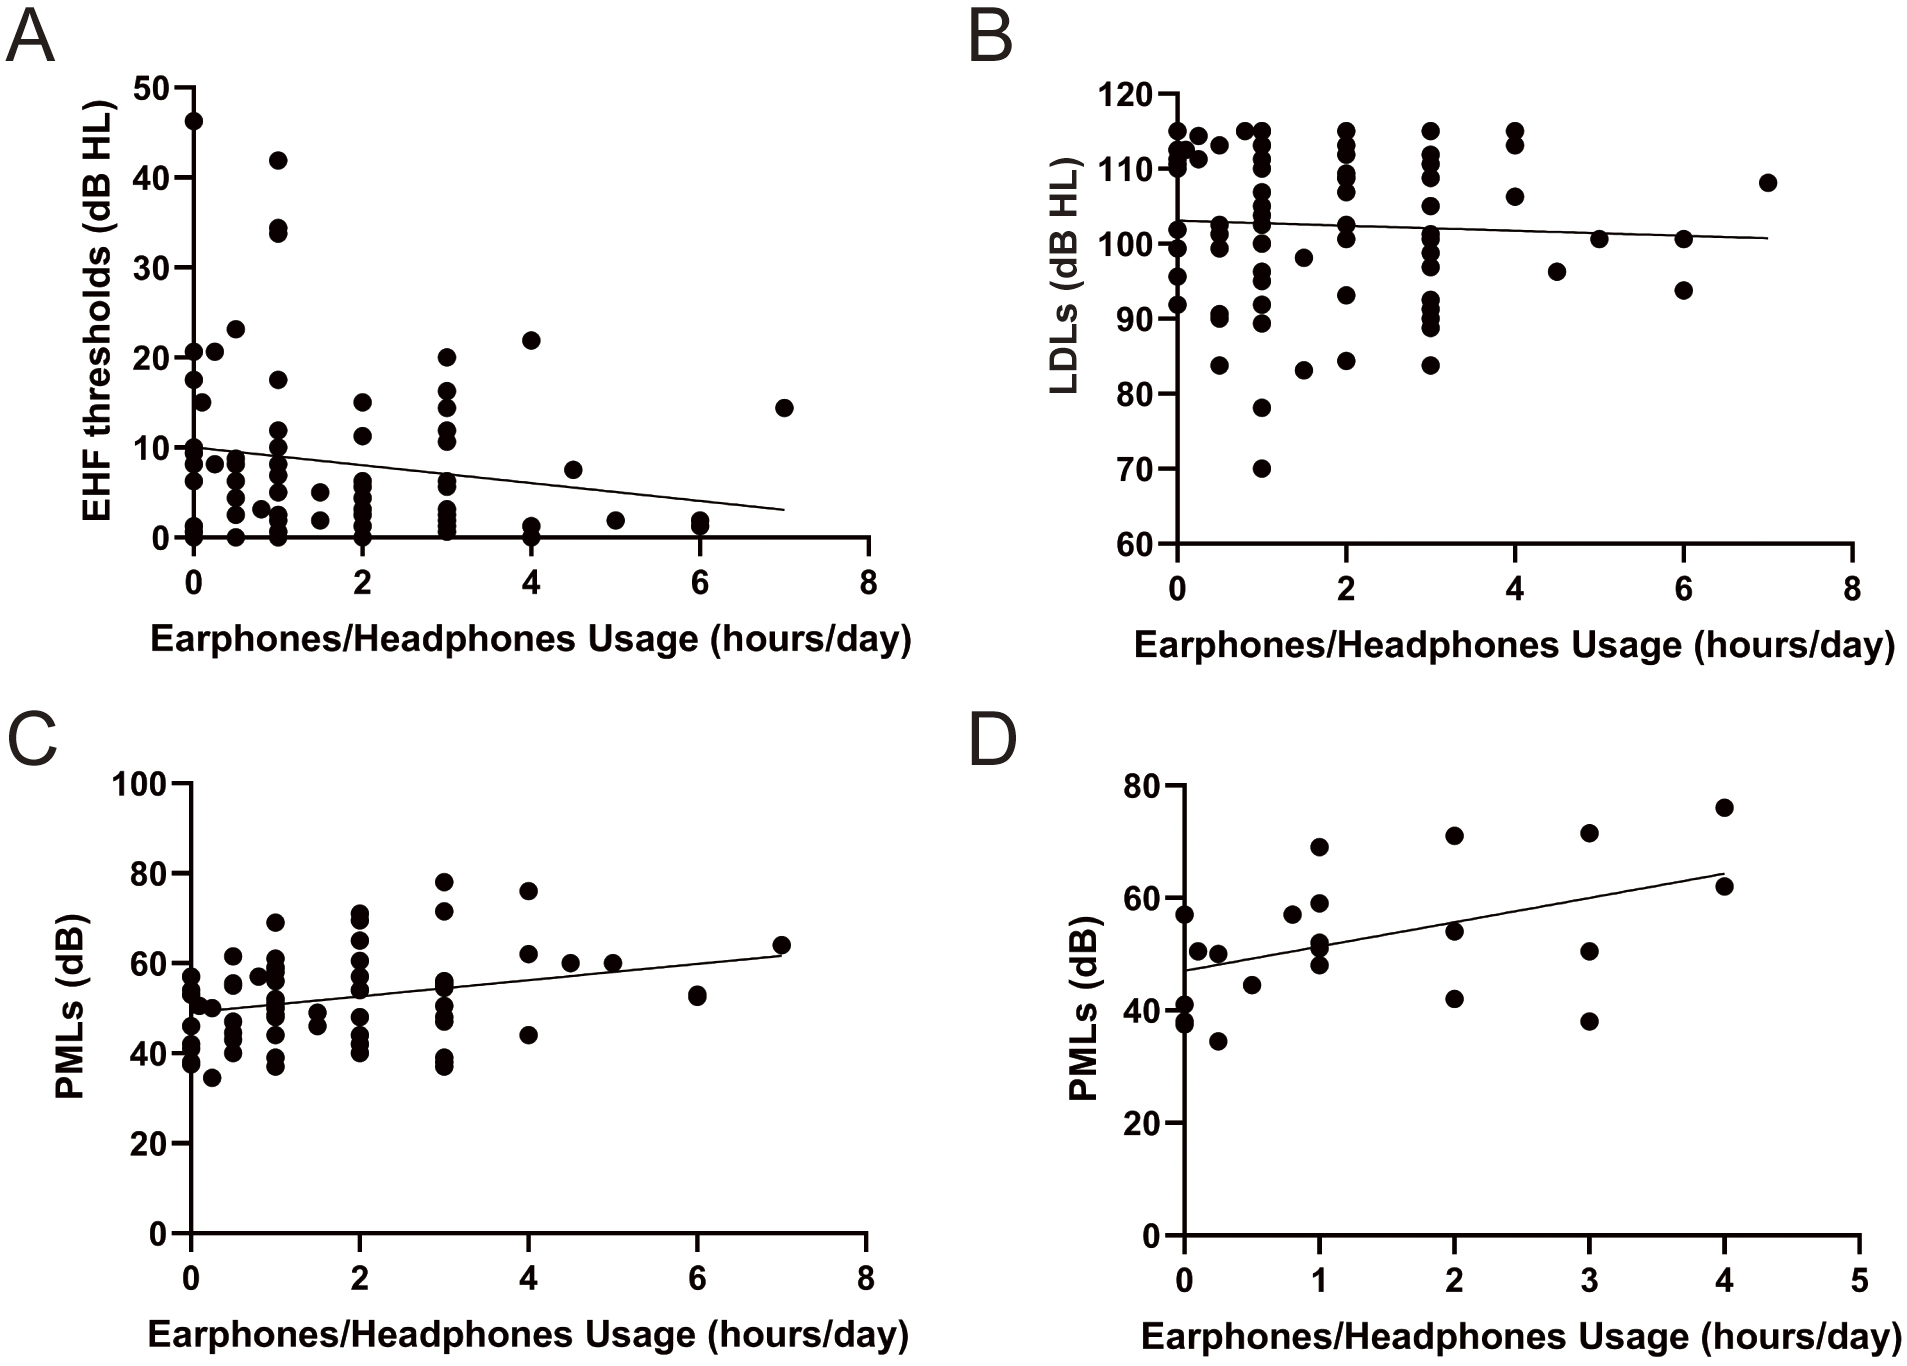
Figure 2. Correlation among earphones/headphones usage time, extended high-frequency (EHF) thresholds, loudness discomfort levels (LDLs), and preferred music listening levels (PMLs).
(A) Correlation between earphones/headphones usage time and EHF thresholds. (B) Correlation between earphones/headphones usage time and LDLs. (C) Correlation between earphones/headphones usage time and PMLs (r = 0.277, p = 0.018). (D) Correlation between earphones/headphones usage time and PMLs (r = 0.463, p = 0.026) (n = 23, the participants with LDLs of 110 dB hearing level (HL) or higher).
From: Music Listening Habits and Auditory Functions in Medical College Students