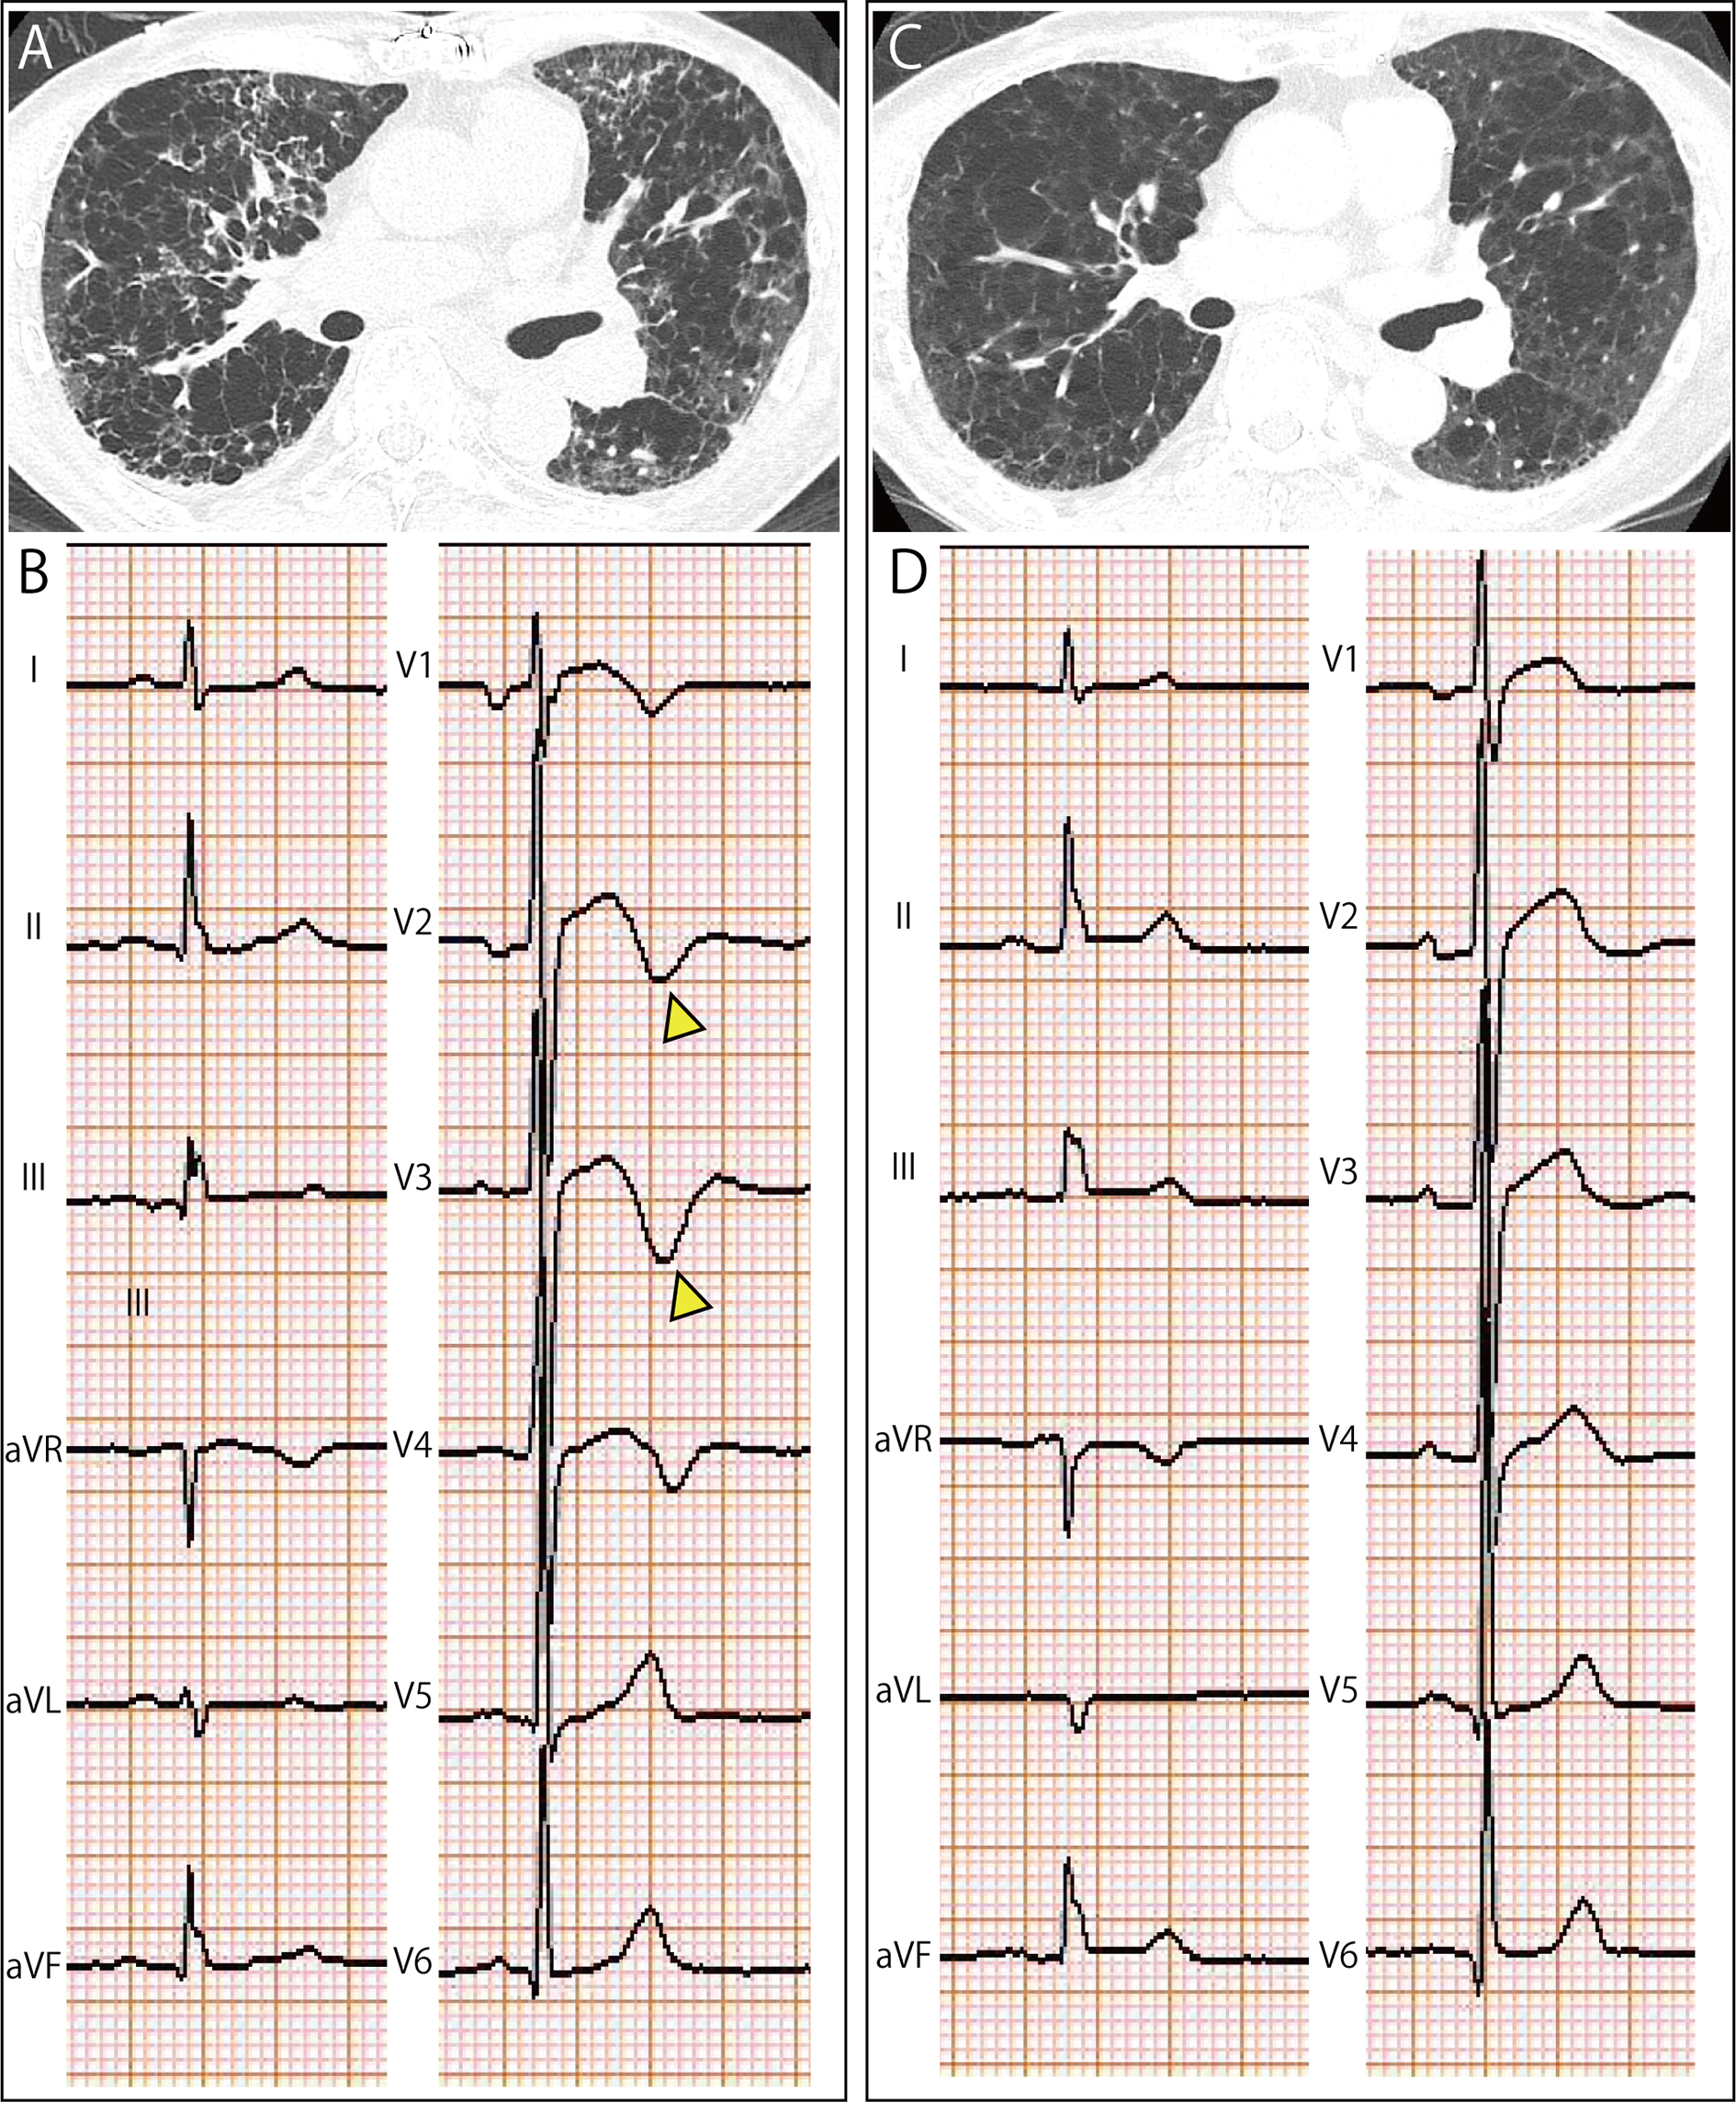
Figure 1. (A) Initial axial chest computed tomography revealing diffuse emphysematous changes and circumferential bronchial wall thickening.
(B) Initial 12-lead electrocardiogram showing biphasic T waves in precordial leads V2-V3 (yellow arrowheads).
(C) Follow-up axial chest computed tomography nine days after treatment initiation demonstrating reduced bronchial wall thickening.
(D) Follow-up 12-lead electrocardiogram showing resolution of T wave abnormalities in precordial leads V2-V3.
From: Hypoxemia-induced Wellens-like Electrocardiogram Pattern in Acute Exacerbation of Chronic Obstructive Pulmonary Disease