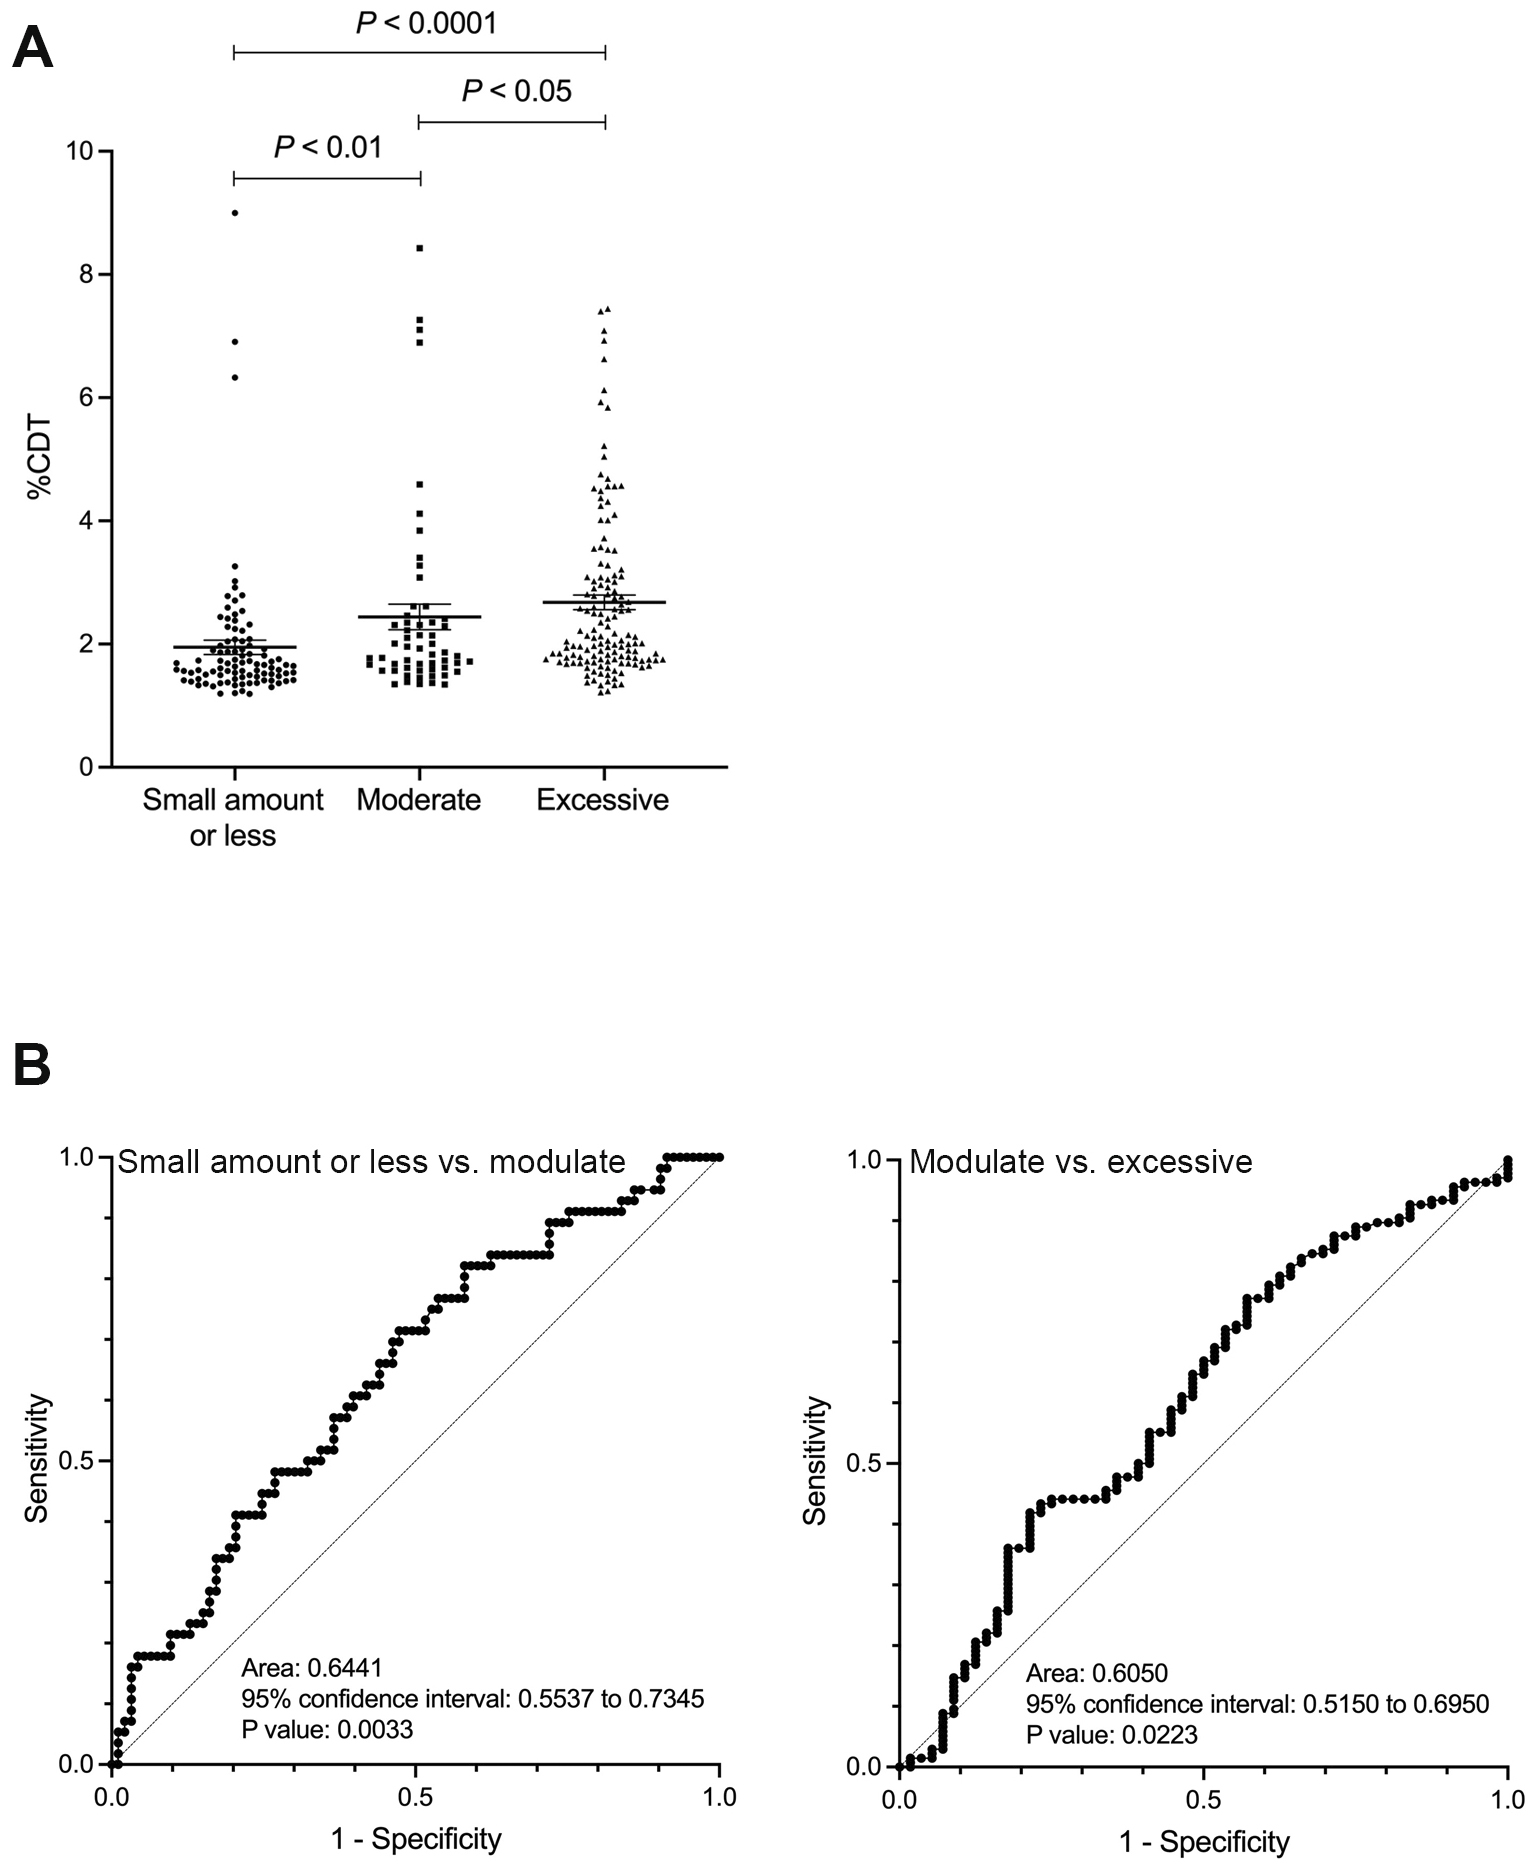
Figure 1. A: The relationship between alcohol consumption and %CDT values. B: ROC curve for distinguishing between small amount or less and moderate drinking groups, and between moderate and excessive drinking groups using CDT. CDT: carbohydrate-deficient transferrin; ROC: receiver operator characteristic.
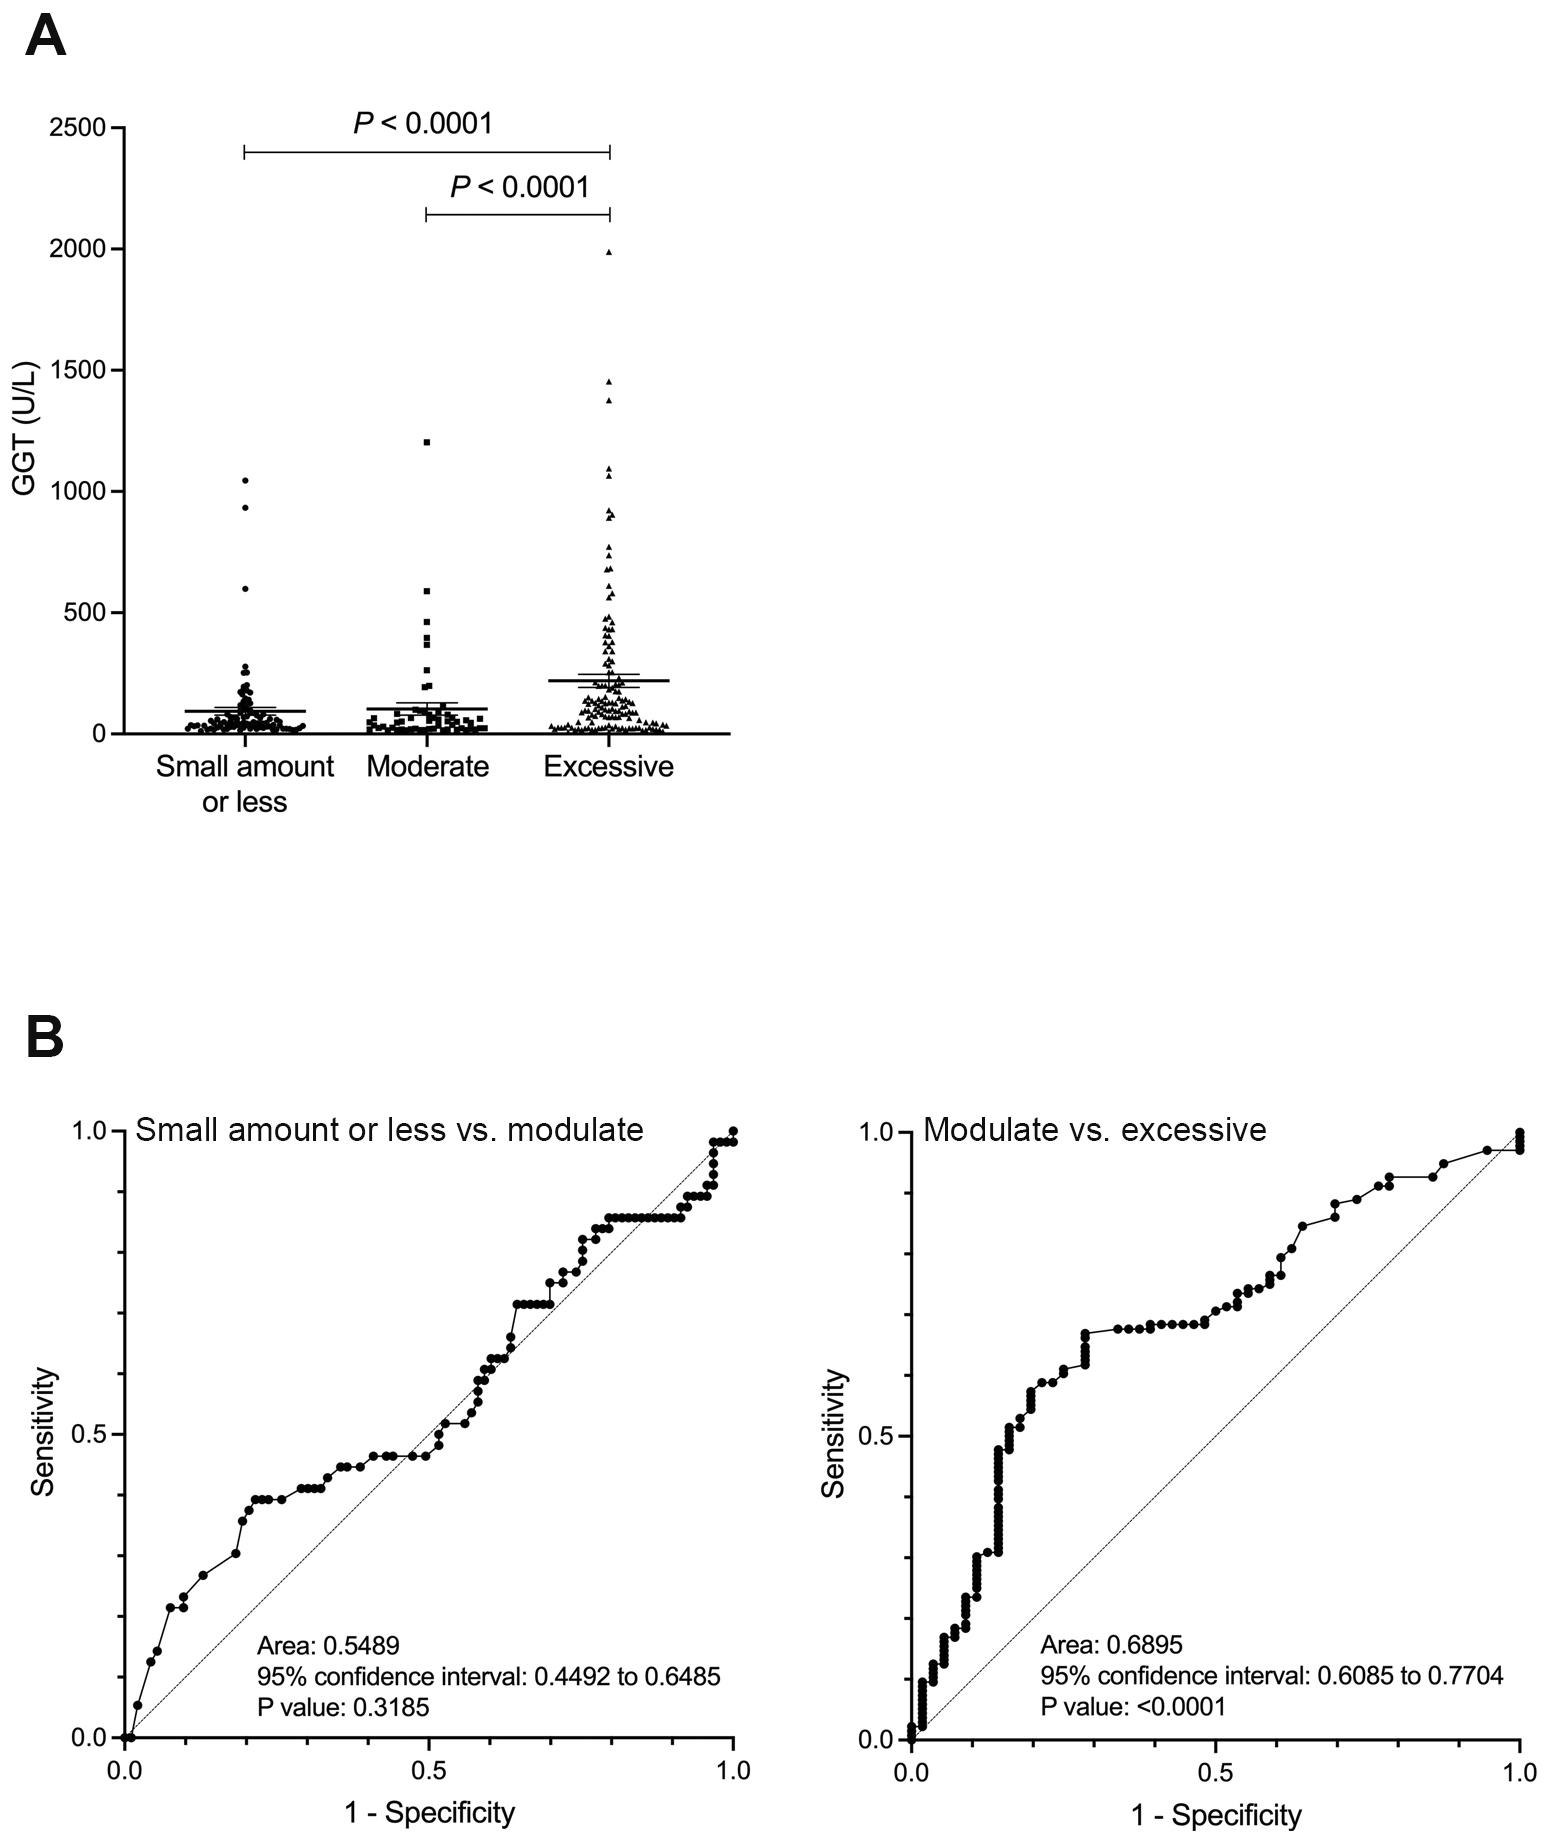
Figure 2. A: The relationship between alcohol consumption and GGT values. B: ROC curve for distinguishing between small amount or less and moderate drinking groups, and between moderate and excessive drinking groups using GGT. GGT: gamma-glutamyl transferase; ROC: receiver operator characteristic.
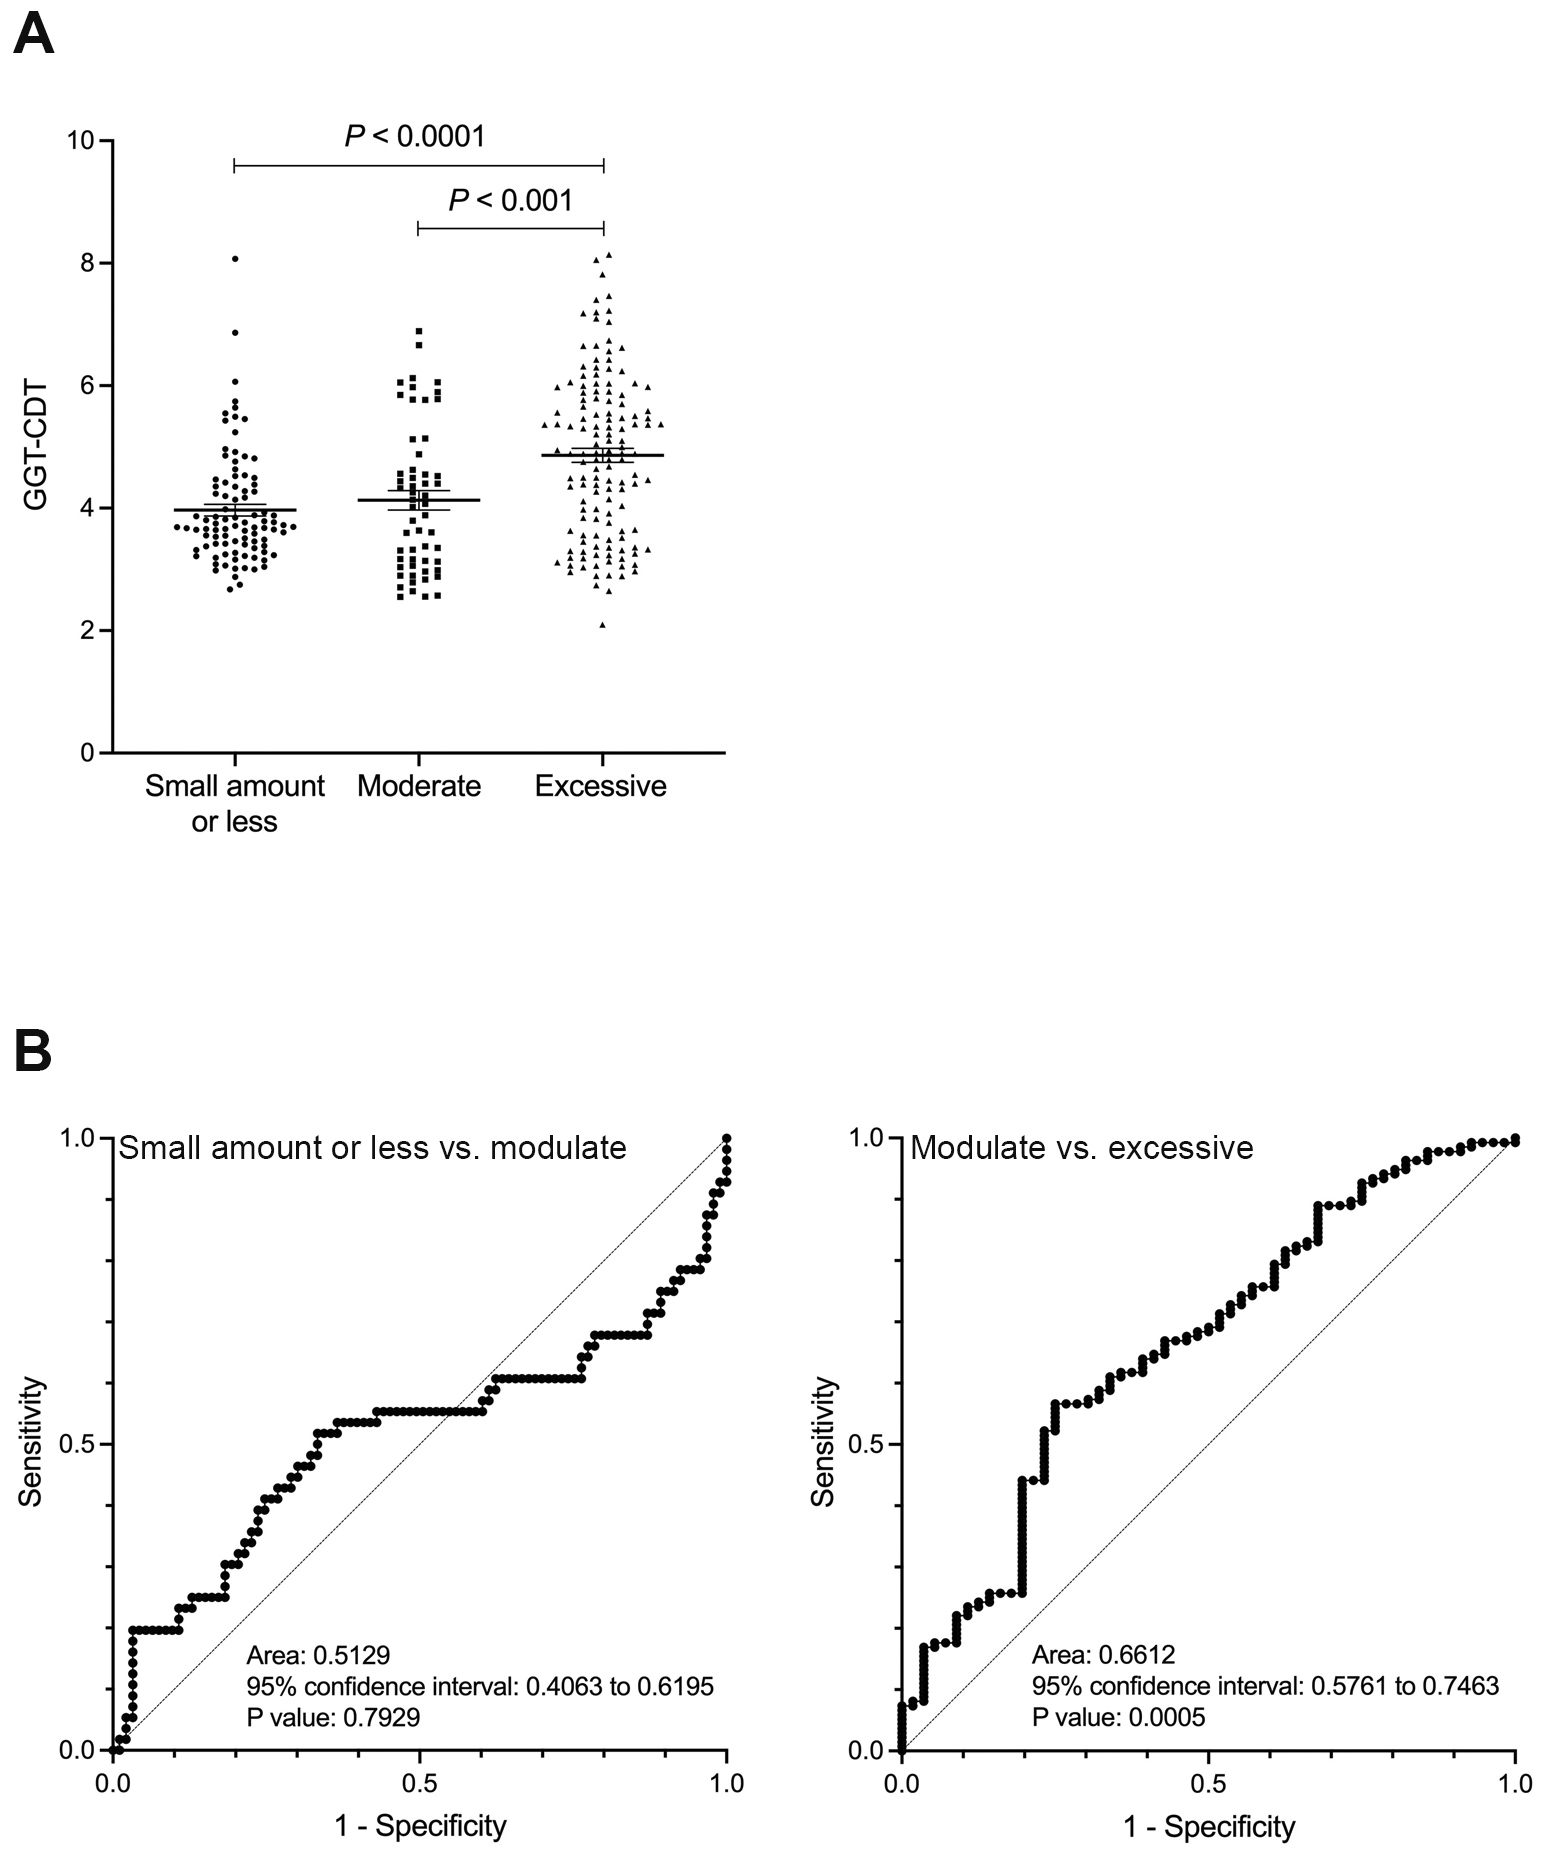
Figure 3. A: The relationship between alcohol consumption and GGT-CDT values. B: ROC curve for distinguishing between small amount or less and moderate drinking groups, and between moderate and excessive drinking groups using GGT-CDT. CDT: carbohydrate-deficient transferrin; GGT: gamma-glutamyl transferase; ROC: receiver operator characteristic.