Figure 2. (a) Artificial intelligence (AI) reconstructs the 3D graphics of the right renal parenchyma. It is necessary to manually correct for the complete lack of recognition of the isthmus and inadvertent recognition of extraneous vessels at the hilum.
(b) In the process of manual modification using the “Mask edit” tool, the regions of interest (ROI) within the renal parenchyma that the AI has chosen are filled in green. We can use a feature that closely resembles the Lasso tool of Adobe Photoshop and easily trace the ROIs not recognized by AI with purple dots and lines.
(c) The 3D graphics reconstructed after manual modification.
From: Practical Step-by-step SYNAPSE VINCENT Rendering of Three-dimensional Graphics in Horseshoe Kidney with Bilateral Varicoceles
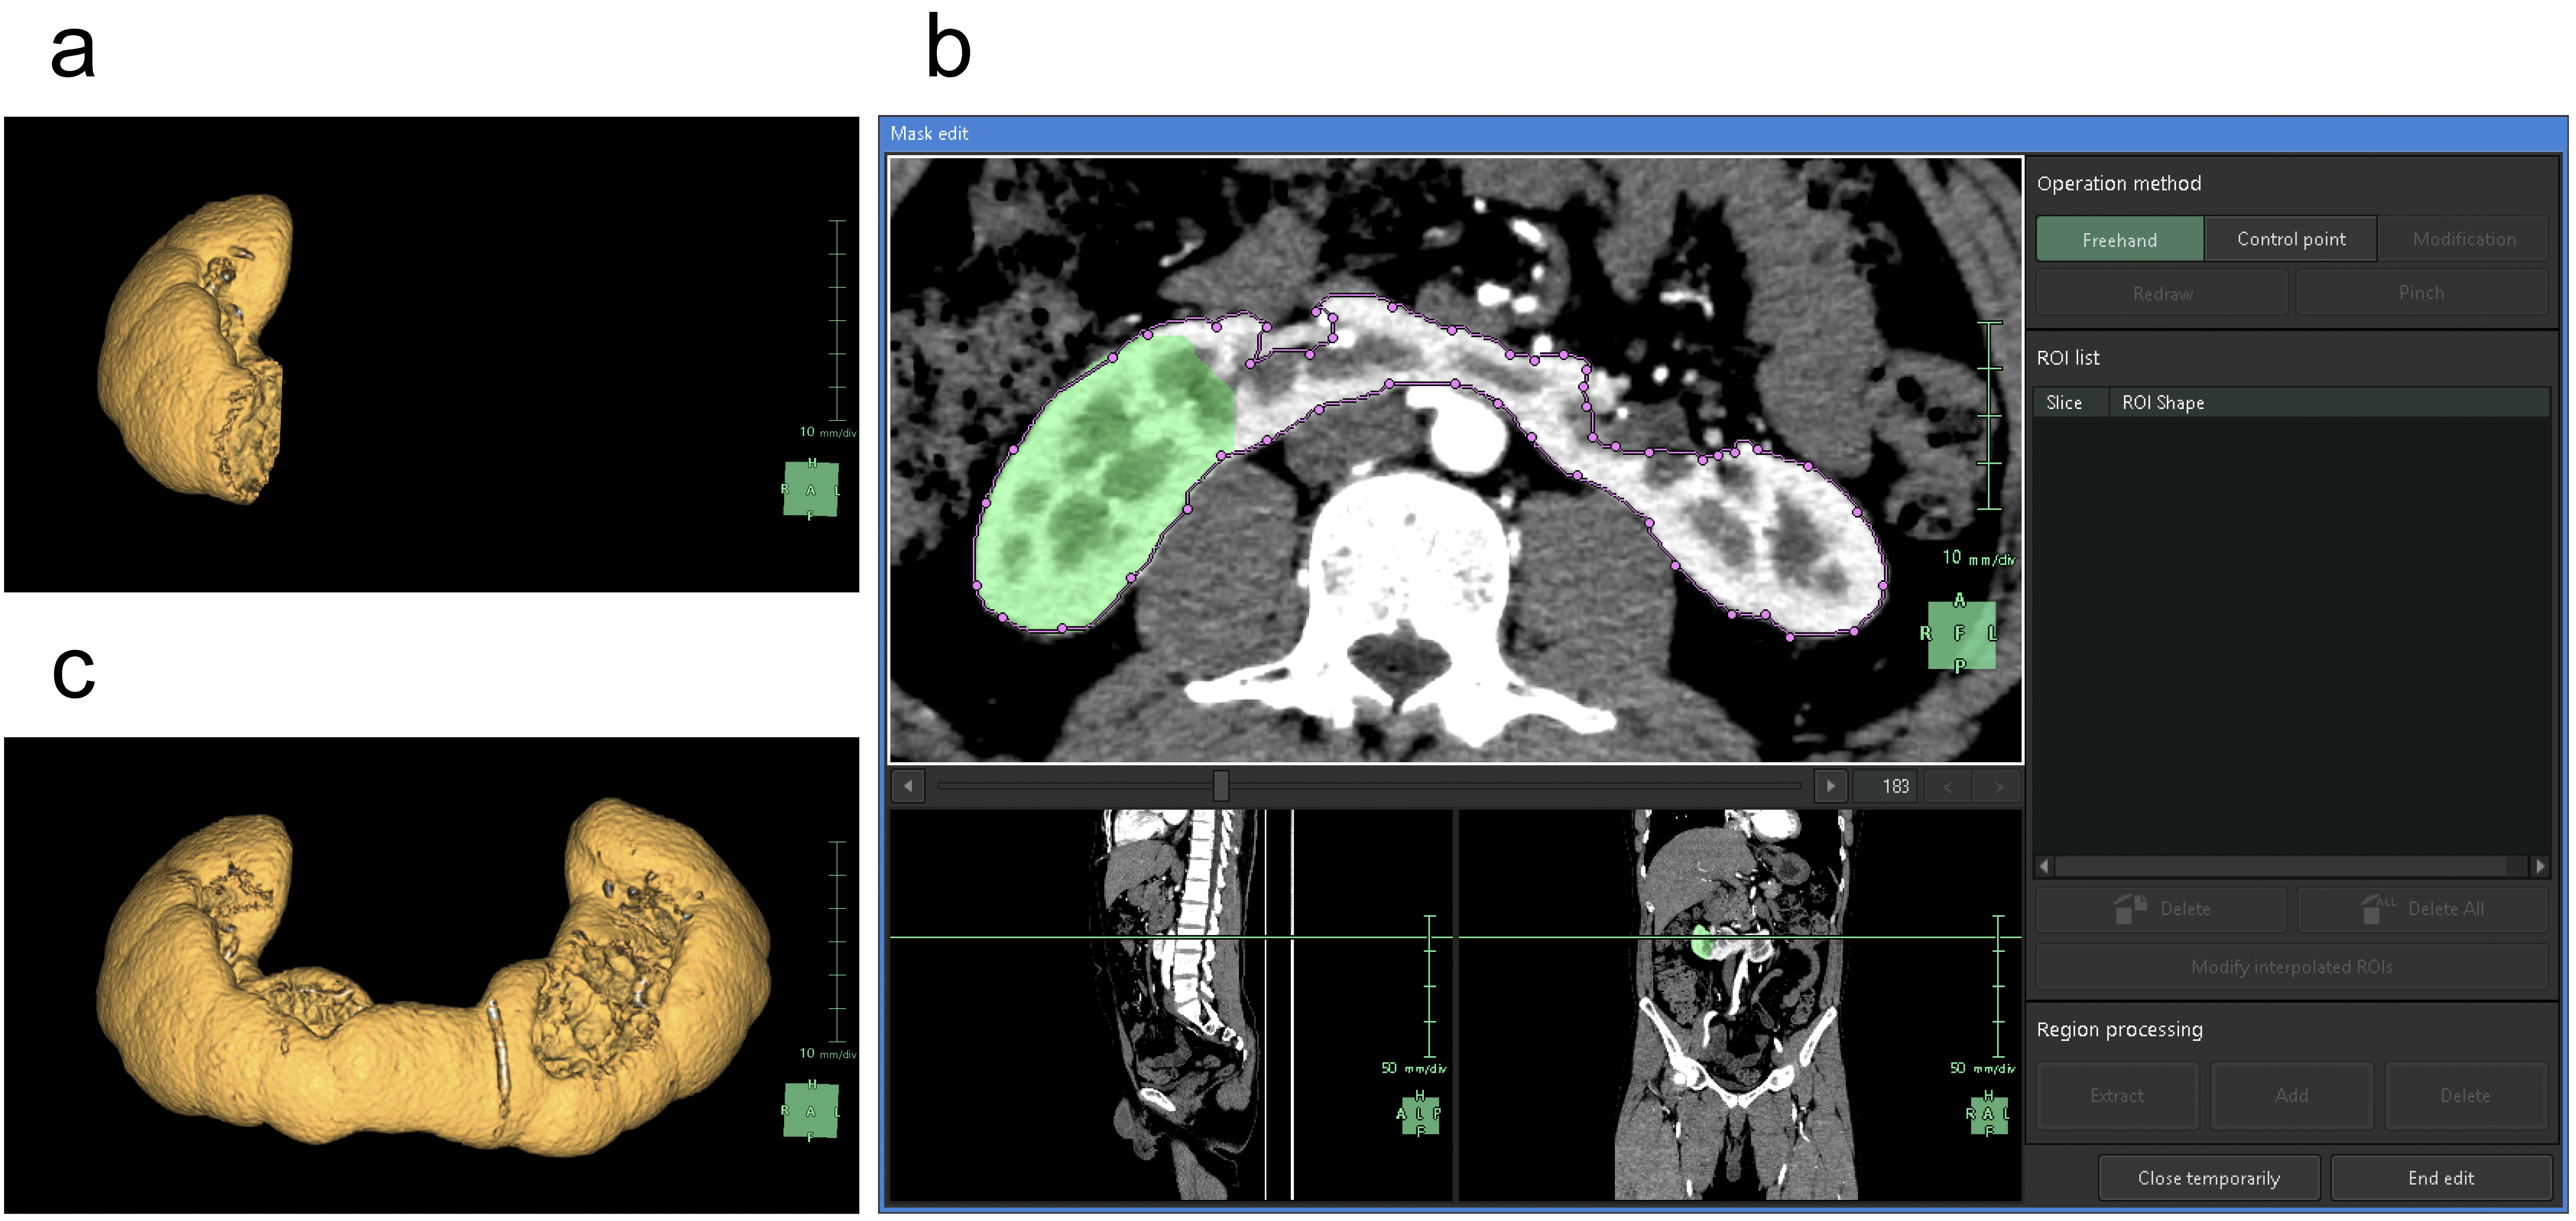
Figure 3. Reconstruction of the aorta.
(a) Artificial intelligence (AI) reconstructs the 3D graphics of the abdominal aorta. The region of interest (ROI) is limited to the level of the kidneys, which results in graphics that omit the drawing of aortic branches.
(b) Manual modification using the “Mask edit” tool.
(c) 3D graphics reconstructed after manual modification. We added the common iliac artery, external iliac artery, internal iliac artery, and a portion of the superior mesenteric artery to the ROI.
From: Practical Step-by-step SYNAPSE VINCENT Rendering of Three-dimensional Graphics in Horseshoe Kidney with Bilateral Varicoceles
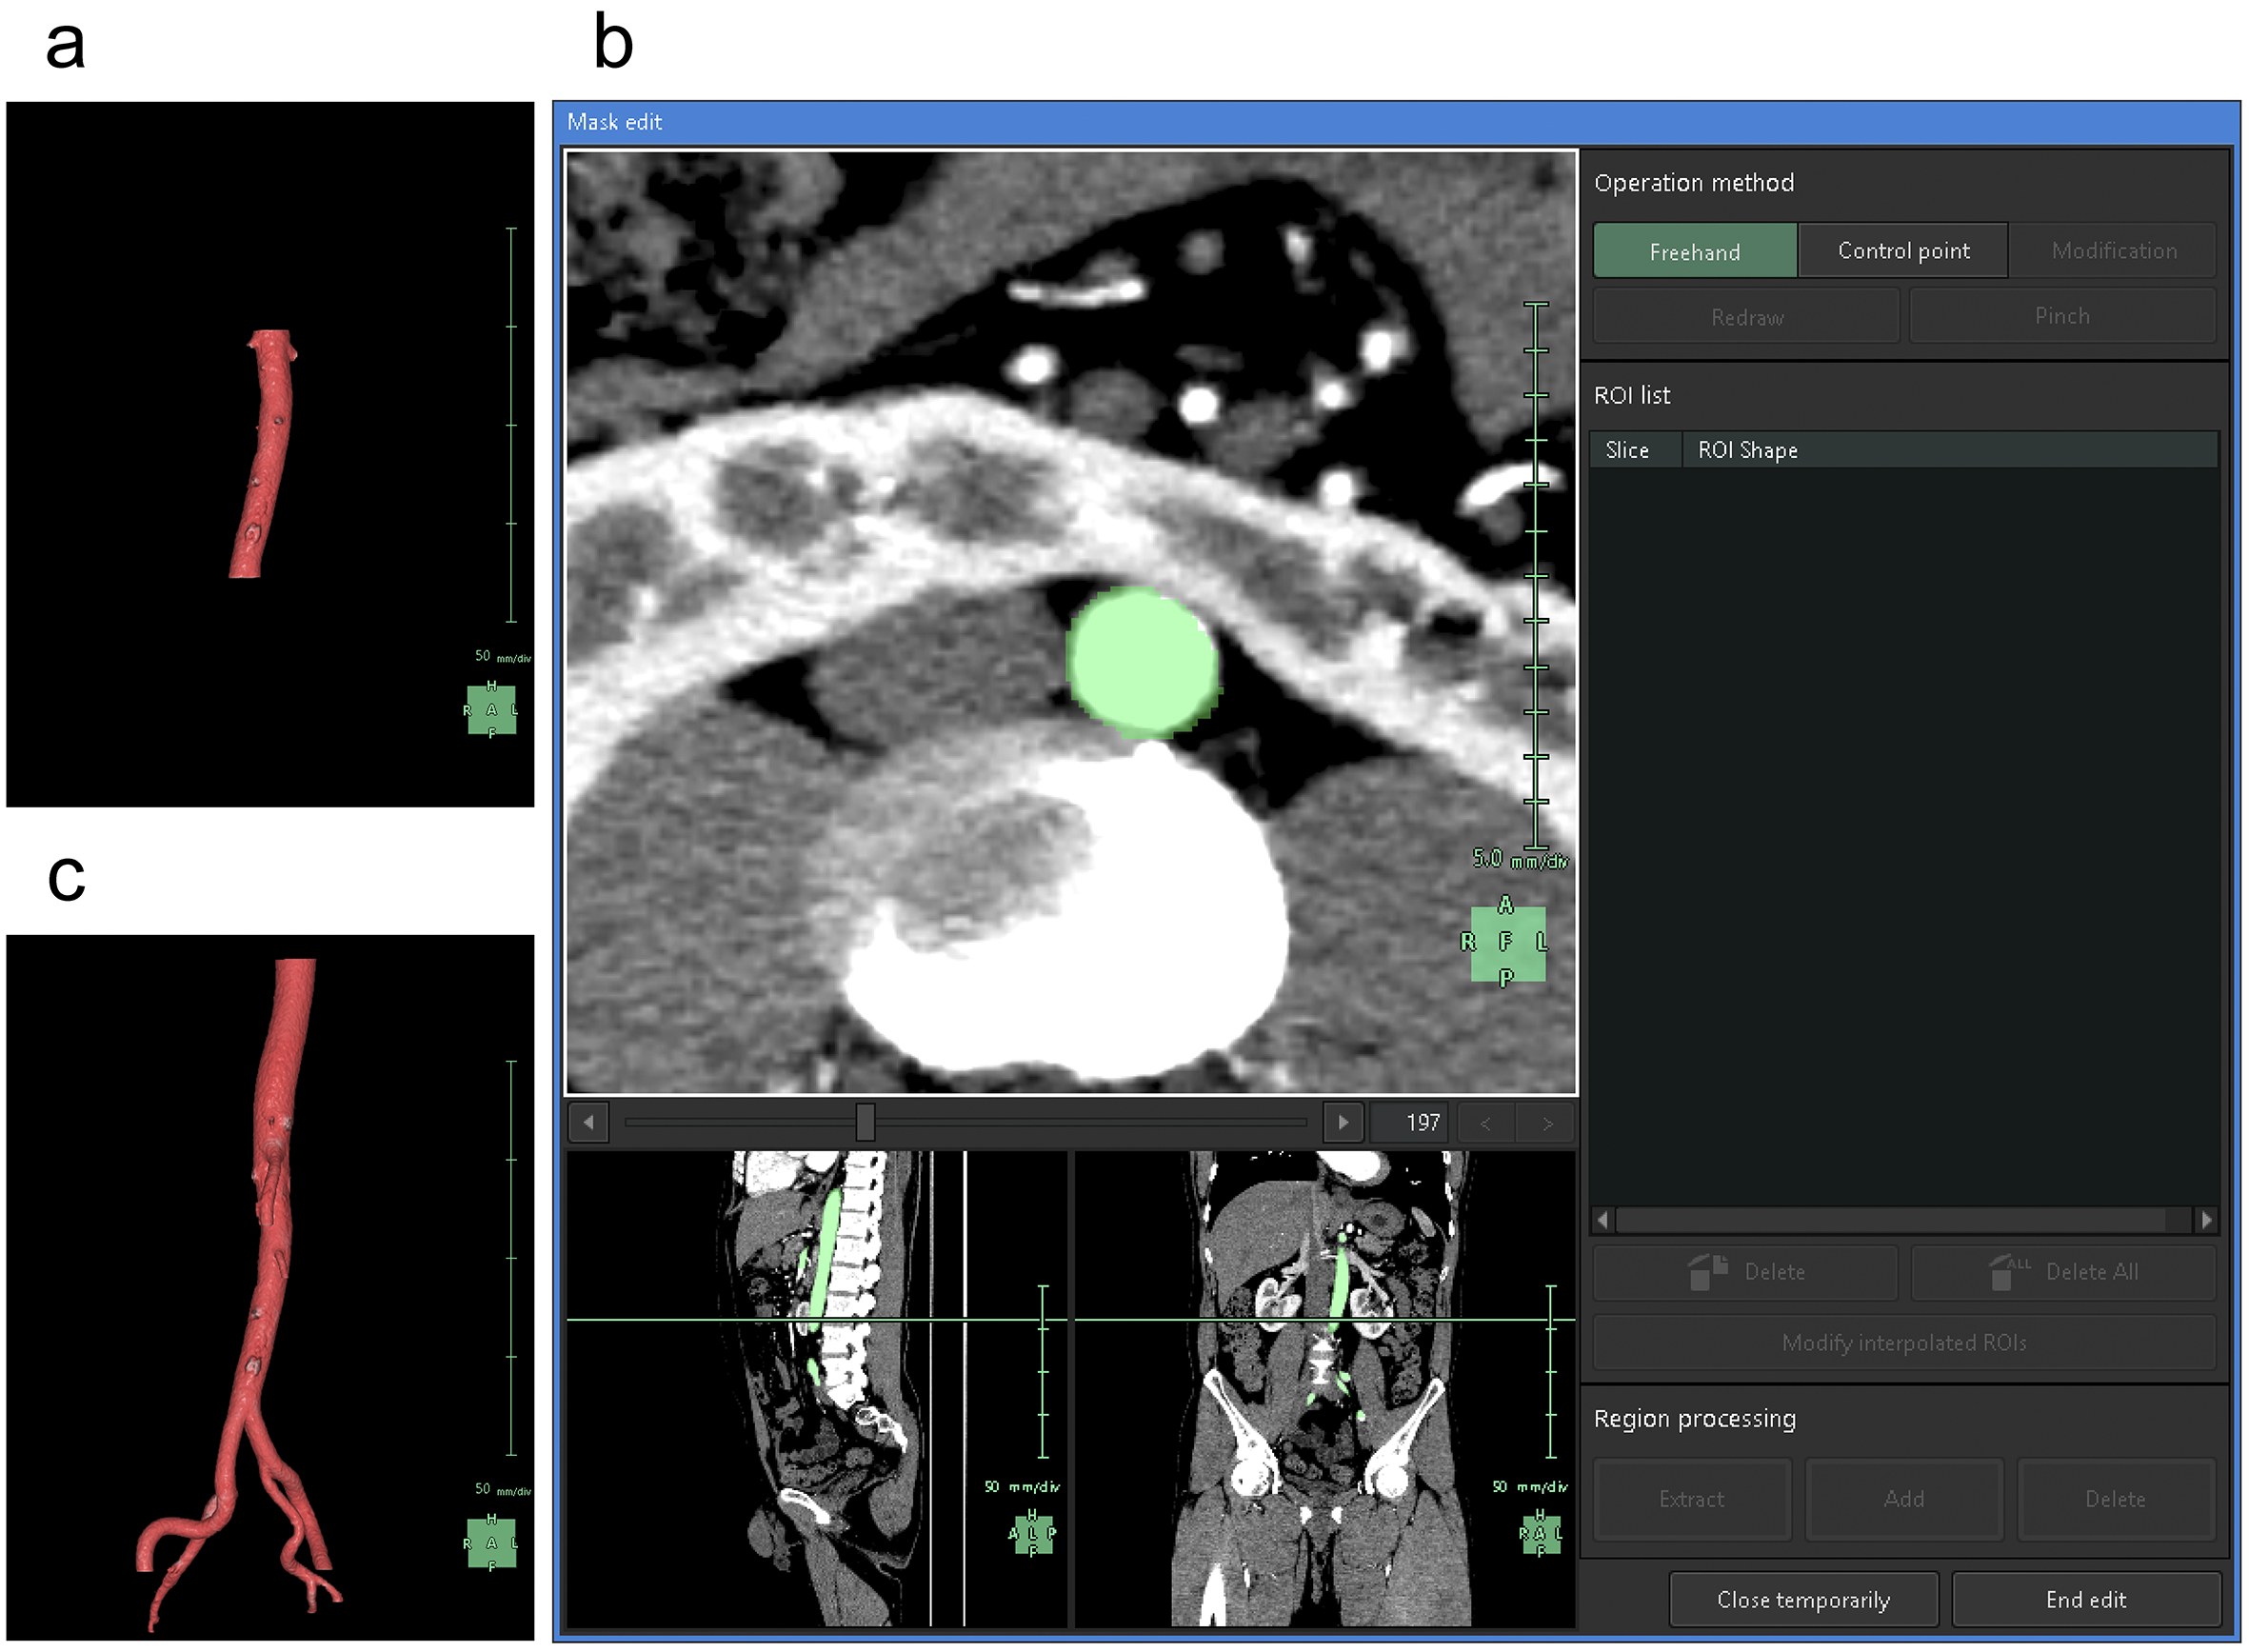
Figure 4. Reconstruction of the renal and testicular arteries.
(a) Artificial intelligence (AI) reconstructs the 3D graphics of the renal arteries.
(b) Manual modification using the “Diameter setting” tool (b1). When we specify the diameters and coordinates at the start and end points of an artery not segmented by the AI, a new artery segmented as a collection of yellow circles is added (b2).
(c) 3D graphics reconstructed after manual modification. We removed the inferior mesenteric artery mistakenly segmented by the AI and newly segmented the fine network of blood vessels that supply blood to the testes.
From: Practical Step-by-step SYNAPSE VINCENT Rendering of Three-dimensional Graphics in Horseshoe Kidney with Bilateral Varicoceles
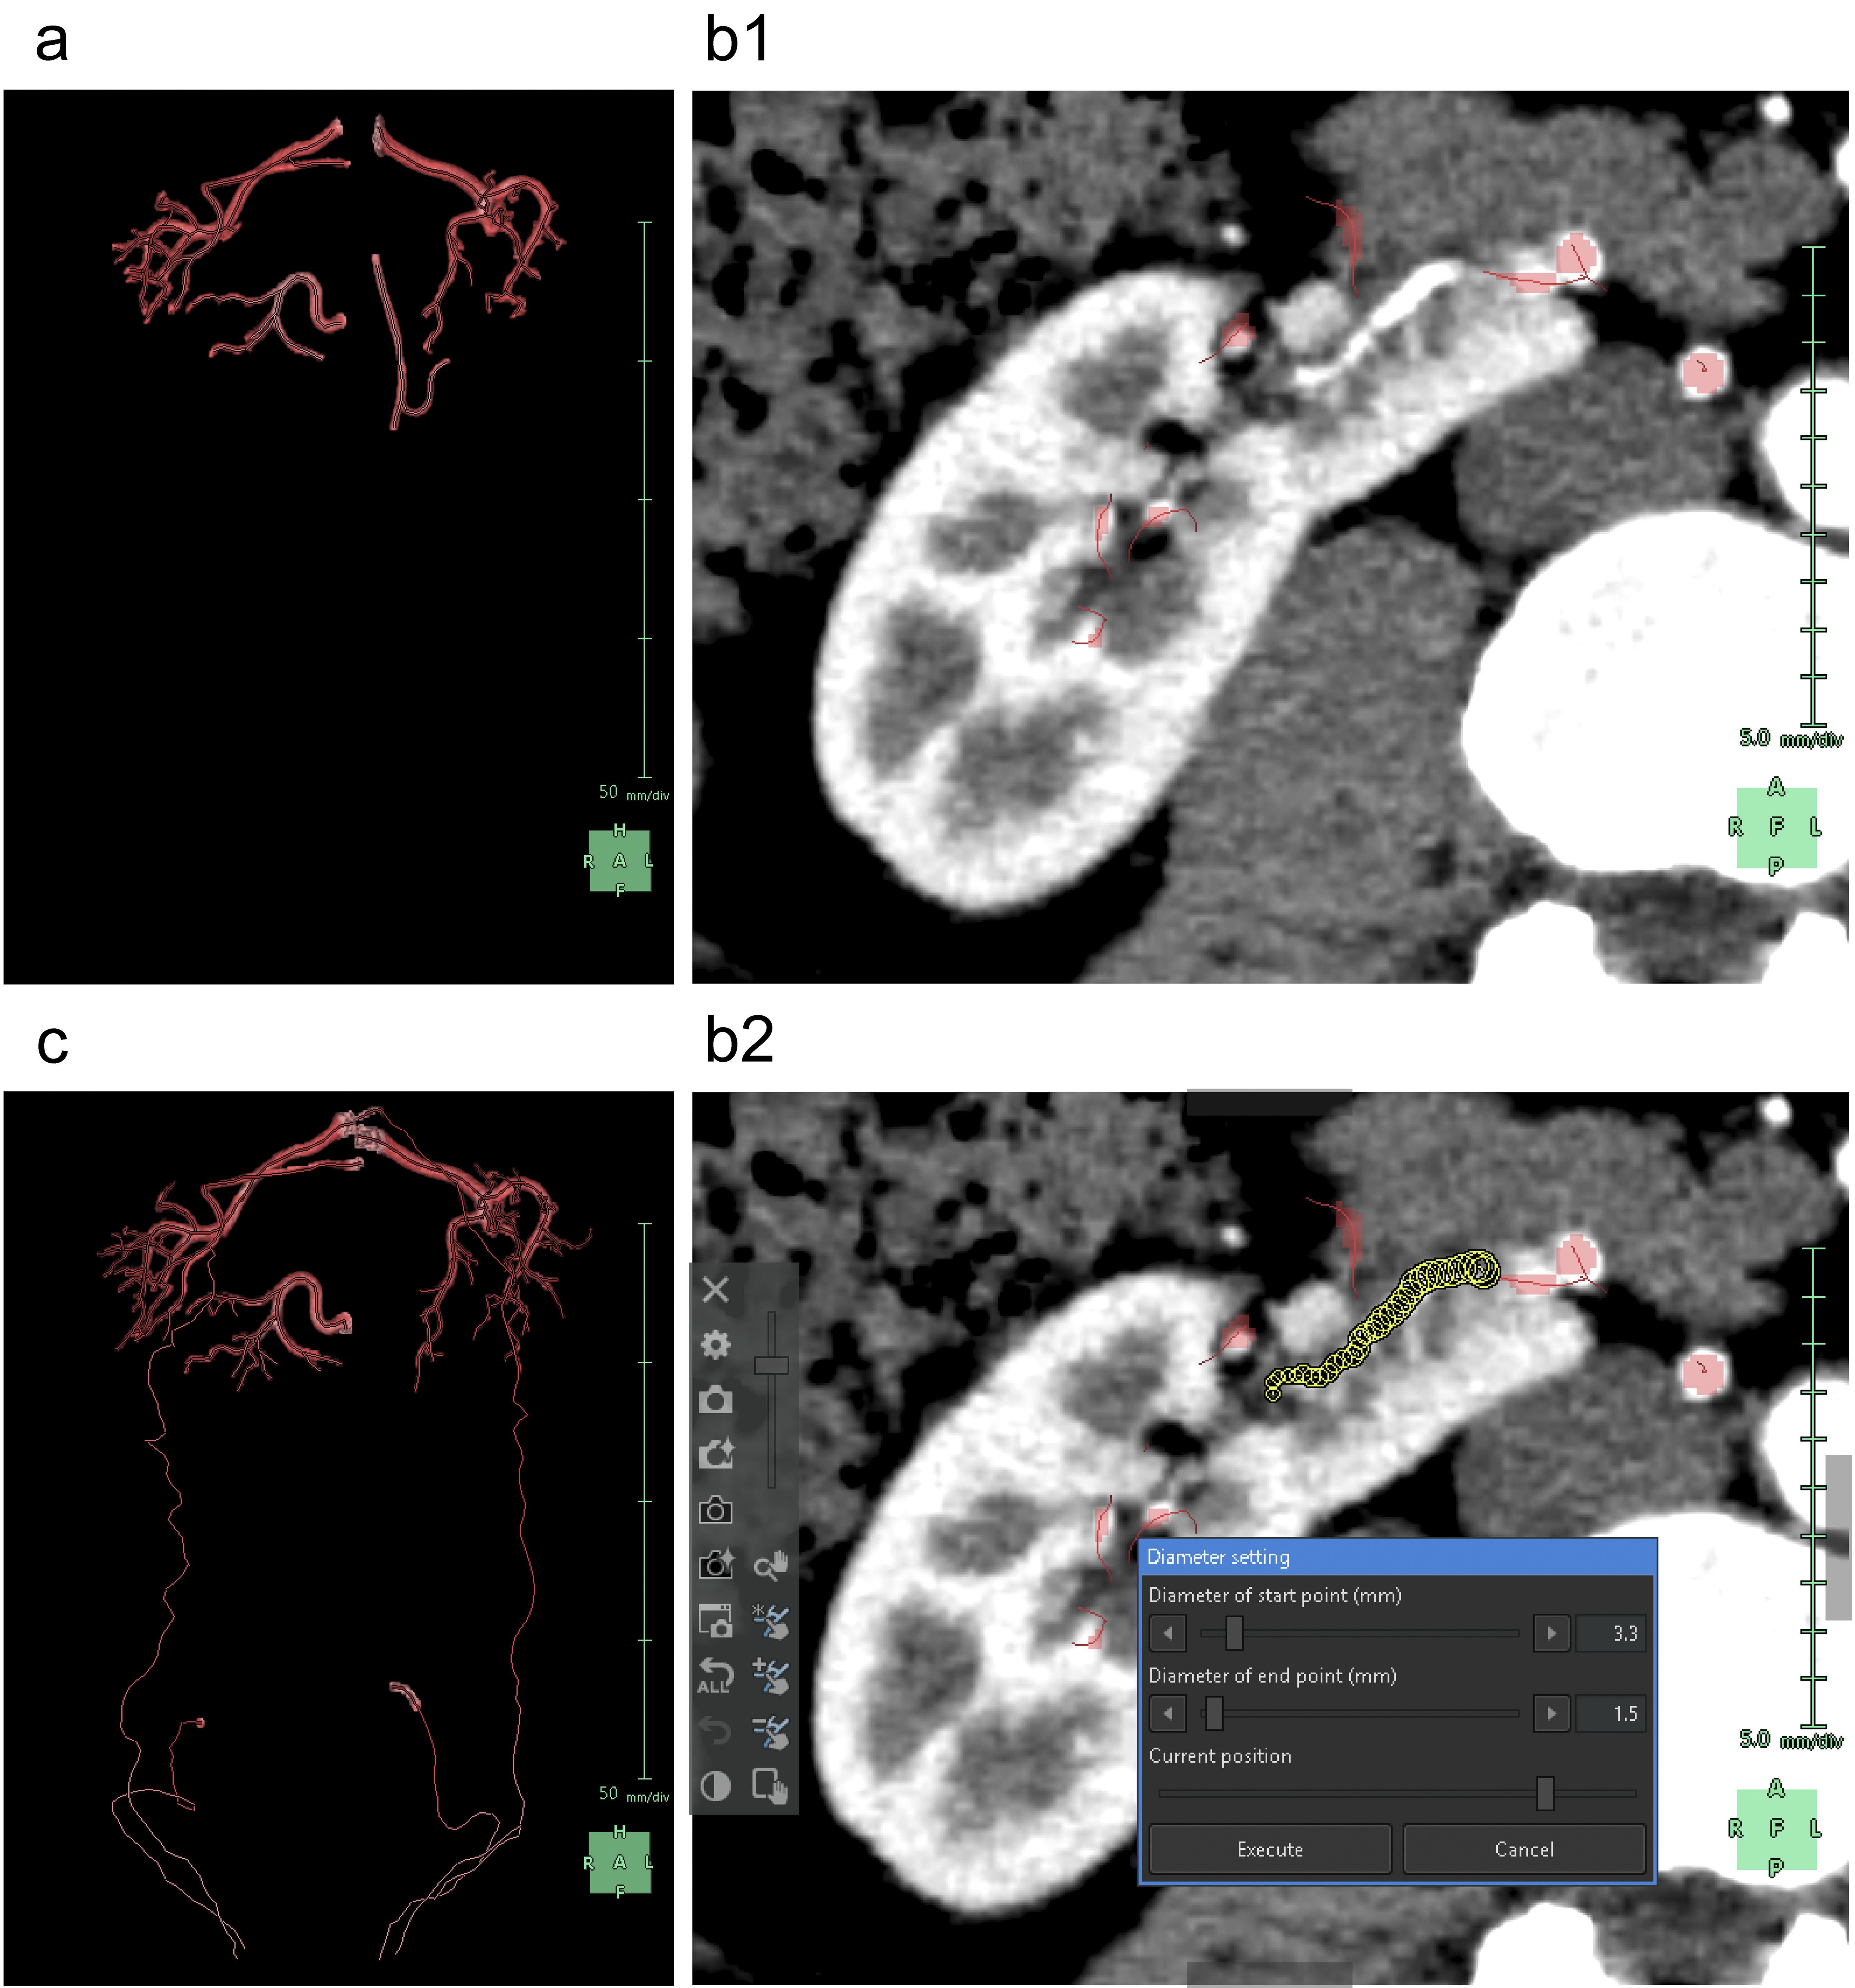
Figure 6. Reconstruction of the inferior vena cava (IVC).
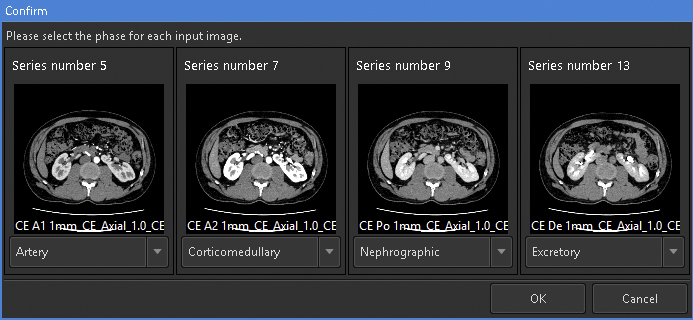
(a) Comparison of the contrast of the IVC at the level of the isthmus. In each of the four phases, namely, artery (a1), corticomedullary (a2), nephrographic (a3), and excretory (a4), we encircle the IVC as the region of interest (ROI) with blue dots and yellow lines.
(b) Artificial intelligence (AI) reconstructs the 3D graphics of the IVC. The ROI is limited to the level of the kidneys.
(c) 3D graphics reconstructed after manual modification. We added the right common iliac vein to the ROI.
From: Practical Step-by-step SYNAPSE VINCENT Rendering of Three-dimensional Graphics in Horseshoe Kidney with Bilateral Varicoceles
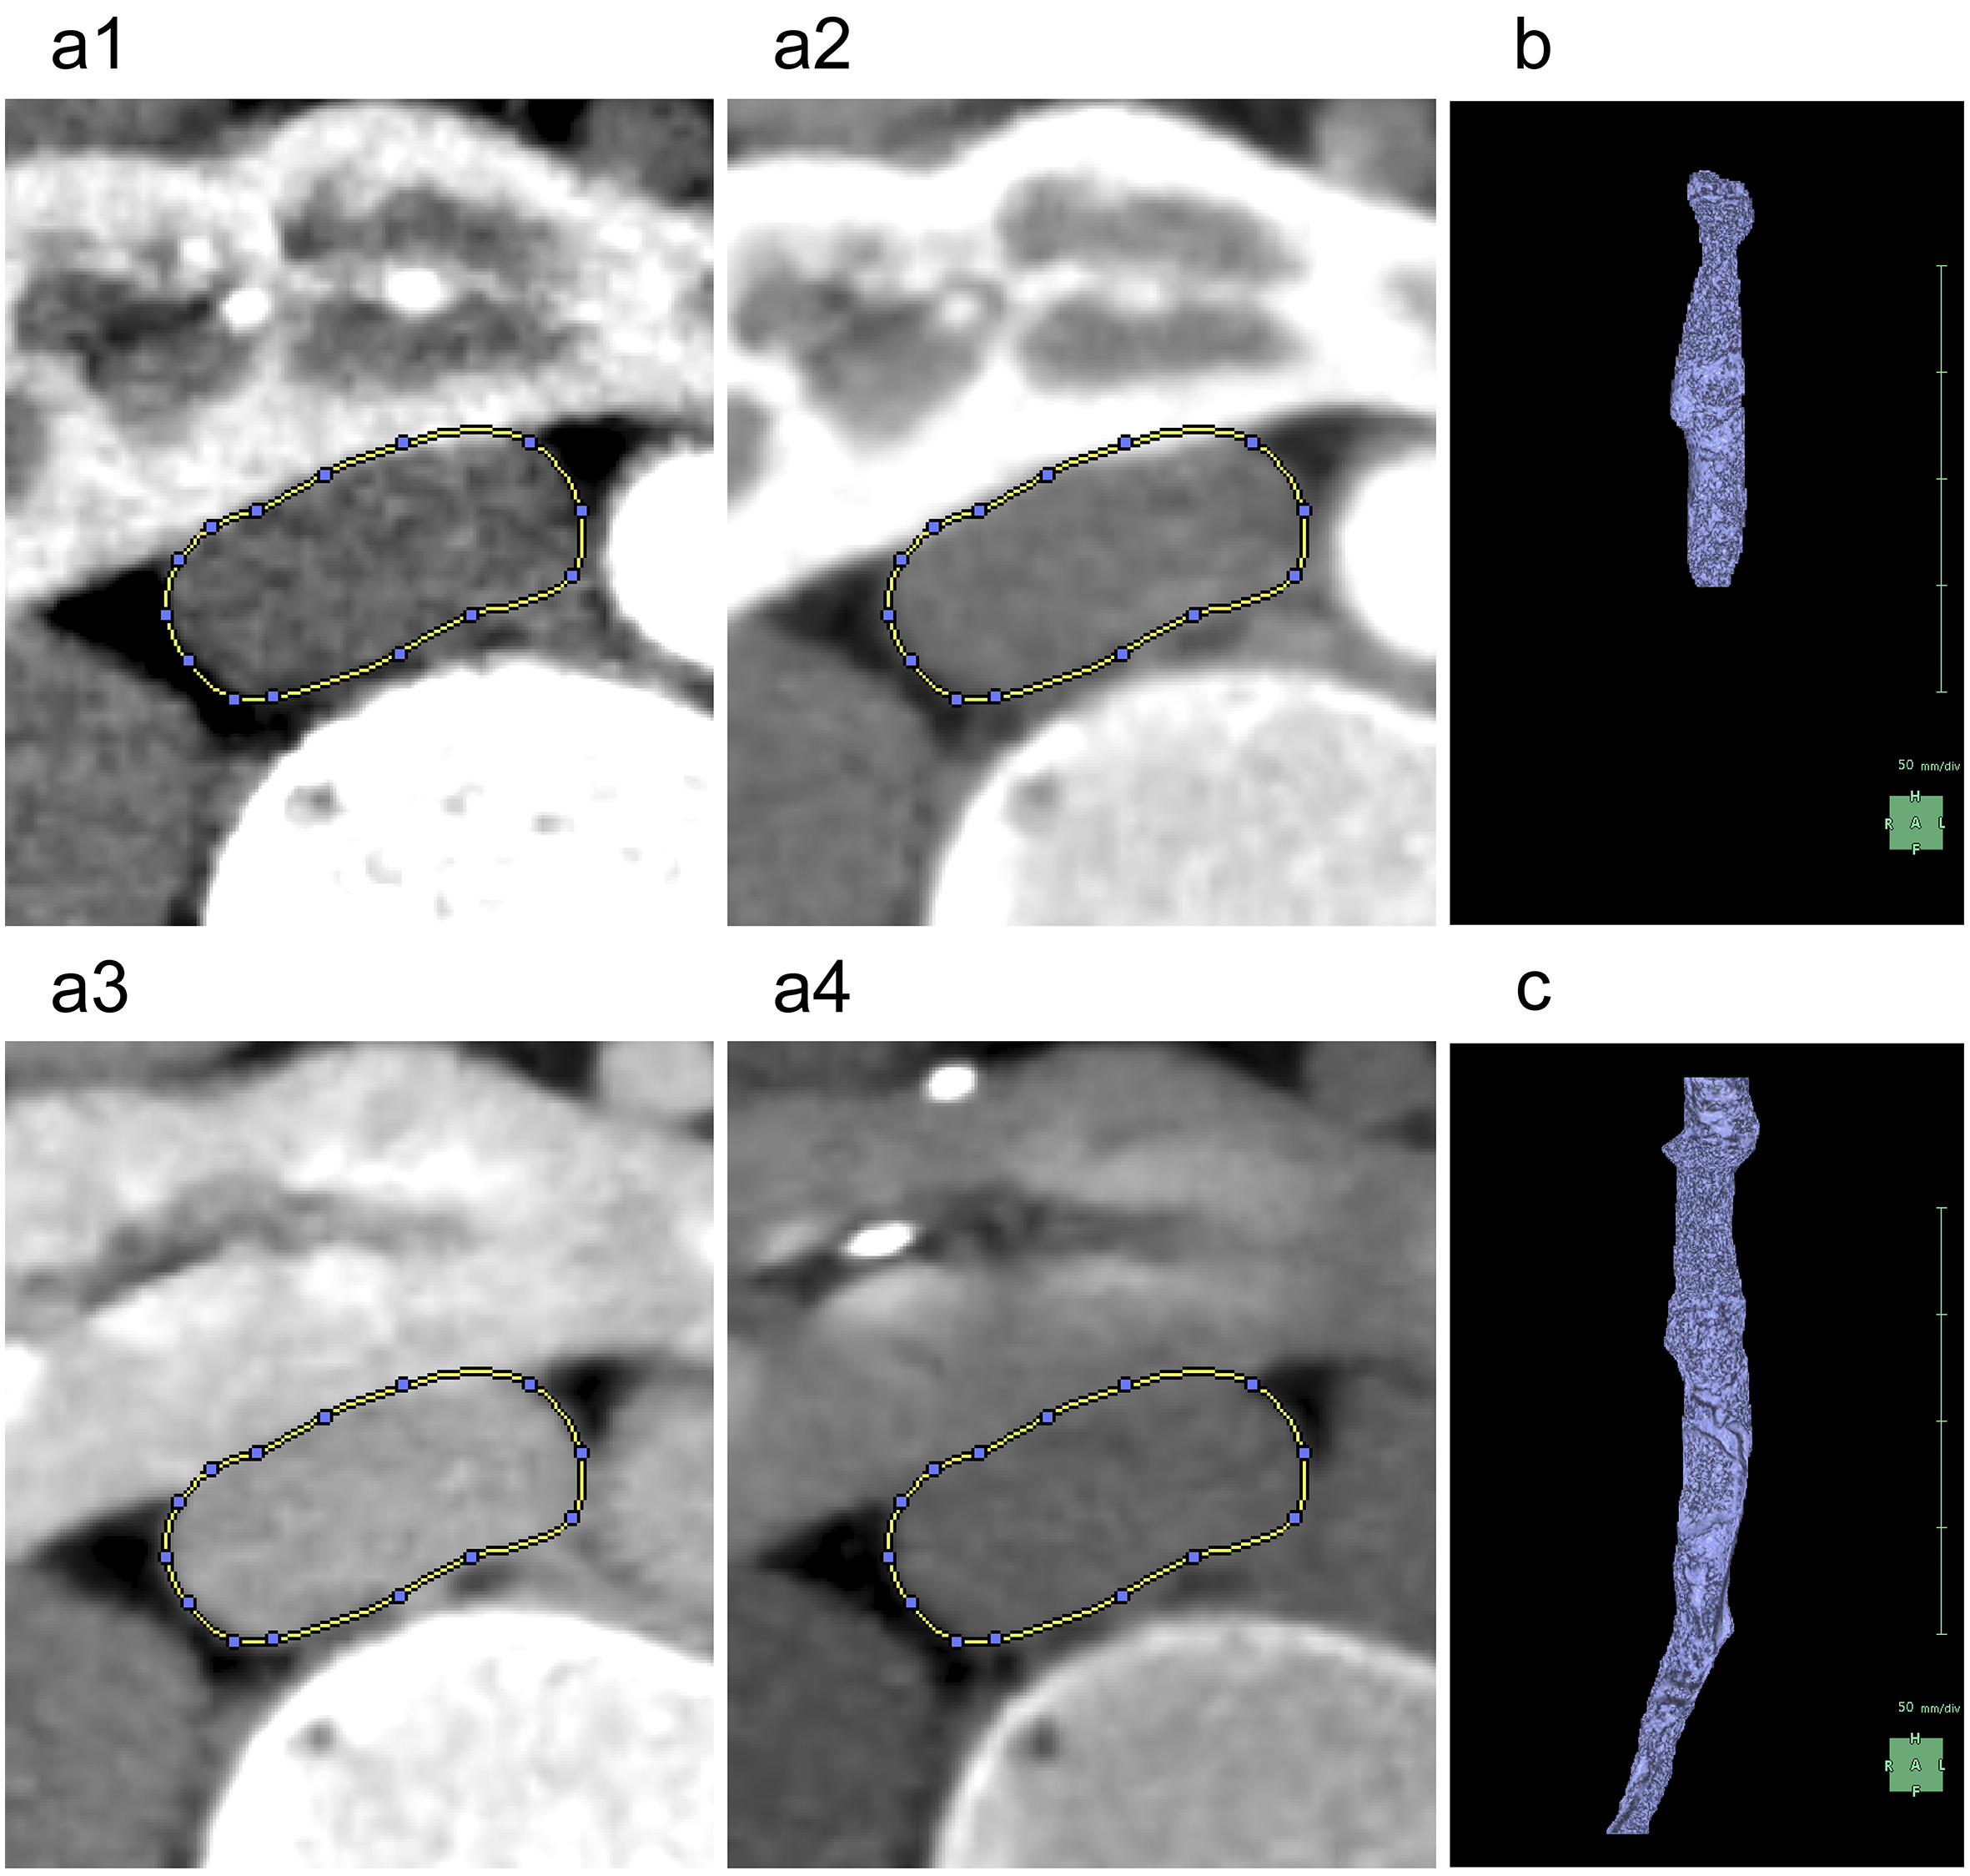
Figure 7. Reconstruction of the renal and testicular veins.
(a) Artificial intelligence (AI) reconstructs the 3D graphics of the renal veins.
(b) 3D graphics reconstructed after manual modification. We removed the artifact areas mistakenly segmented by the AI and newly segmented the pathway for blood return from the testes to the central circulation, including the left common iliac vein.
(c) Segmentation process of the left renal vein compressed and deformed into a spindle shape between the aorta and the superior mesenteric artery (SMA). An axial image at the level where the left renal vein flows into the inferior vena cava (c1). We used the “Diameter setting” tool to set the diameters and coordinates at the start and end points of the left renal vein (c2).
(d) Sagittal image at the level where the SMA branches from the aorta. As the “Diameter setting” tool alone cannot represent the irregular spindle-shaped cross-section of the left renal vein, we also used the “Mask edit” tool to add the region of interest of the left renal vein with purple dots and lines.
From: Practical Step-by-step SYNAPSE VINCENT Rendering of Three-dimensional Graphics in Horseshoe Kidney with Bilateral Varicoceles
Figure 8. Reconstruction of the upper urinary tract.
(a) Coronal section image where the course of the ureter is clearly visible during the excretory phase (a1). We used the “Diameter setting” tool to set the diameters and coordinates at the start and end points of the ureter (a2).
(b) We adjusted the contrast to avoid mistakenly segmenting the solid structure of the renal pyramids, keeping the calyces and renal pelvis white while turning the renal pyramids black. When we used the “Region growing” tool starting from the center of the renal pelvis, the intricate structure of the renal pelvis, described as “coral” or “staghorn,” is depicted in purple.
From: Practical Step-by-step SYNAPSE VINCENT Rendering of Three-dimensional Graphics in Horseshoe Kidney with Bilateral Varicoceles
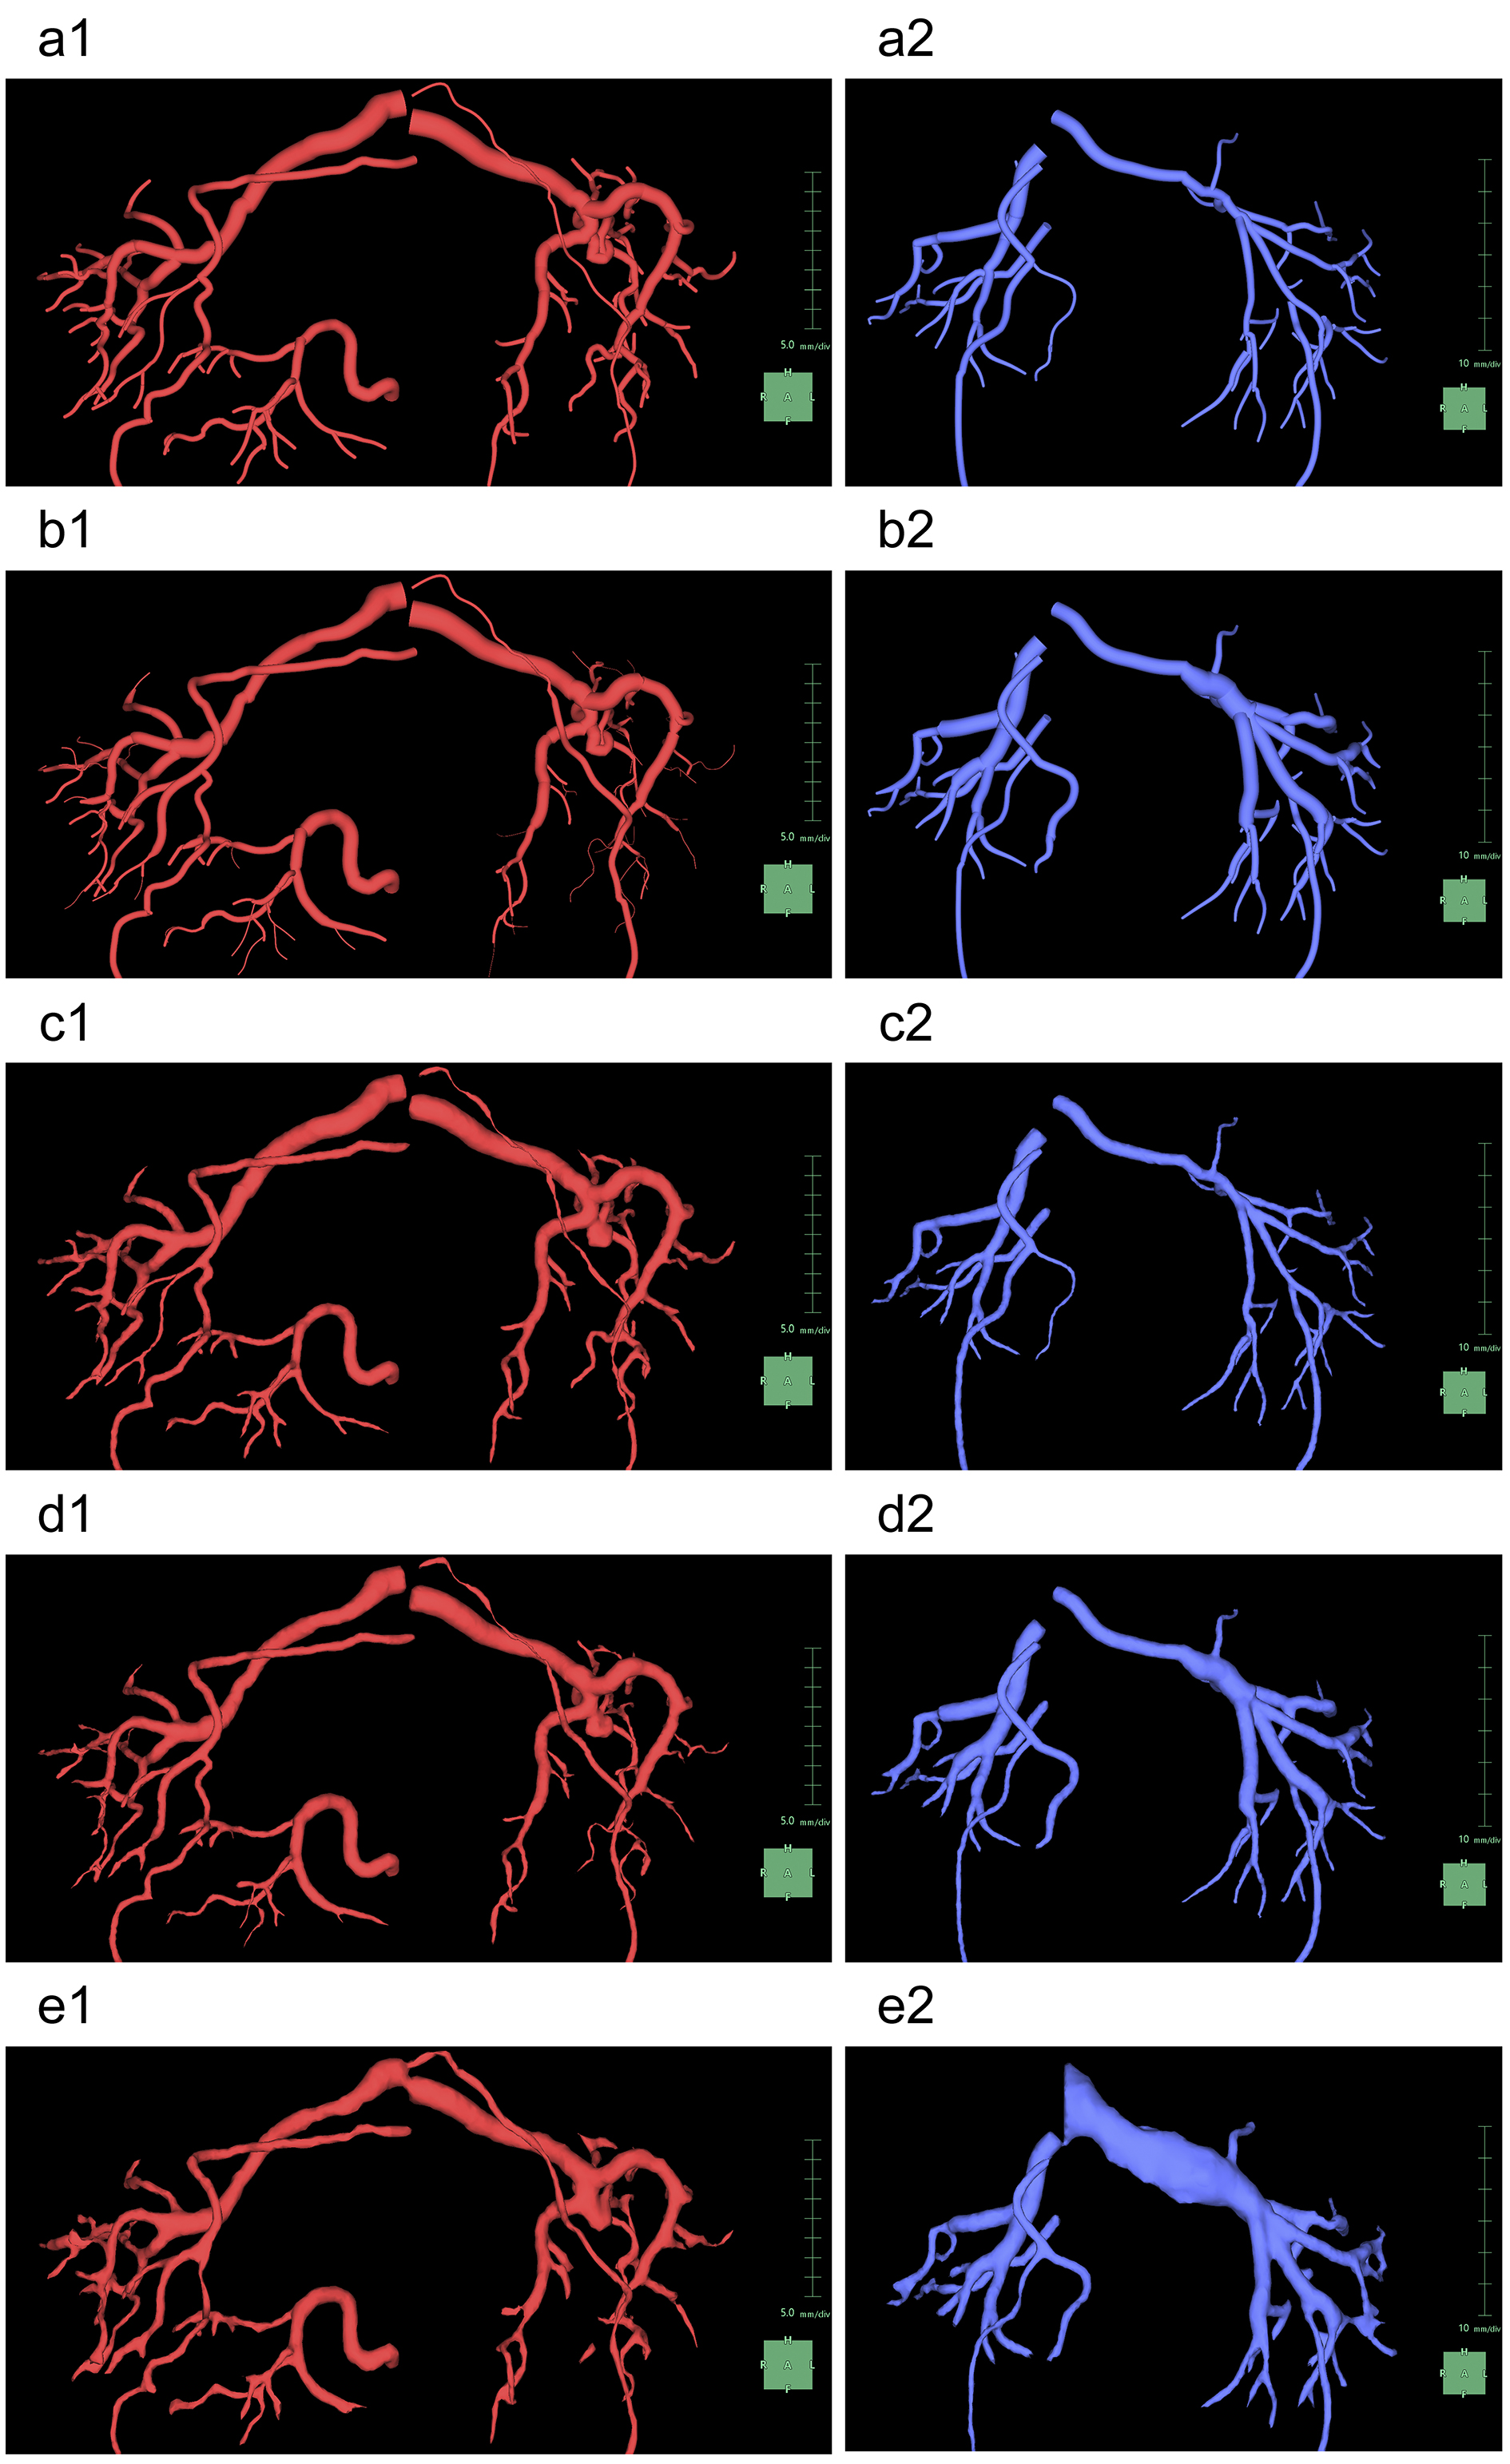
Figure 9. Display of the arteries and vessels for each rendering setting provided by the application.
Arteries are depicted in red (a-e1) and veins in blue (a-e2).
(a) “Cylinders” mode and “Monotonically decreased” mode.
(b) “Cylinders” mode and “Estimated diameter from image” mode.
(c) “Region” mode and “Monotonically decreased” mode.
(d) “Region” mode and “Estimated diameter from image” mode.
(e) “Keep image” mode. Note that in this mode, there is no difference in display between “Cylinders” mode and “Region” mode. Furthermore, it is the only mode where the segmentation complemented by the “Mask Edit” tool is displayed.
From: Practical Step-by-step SYNAPSE VINCENT Rendering of Three-dimensional Graphics in Horseshoe Kidney with Bilateral Varicoceles