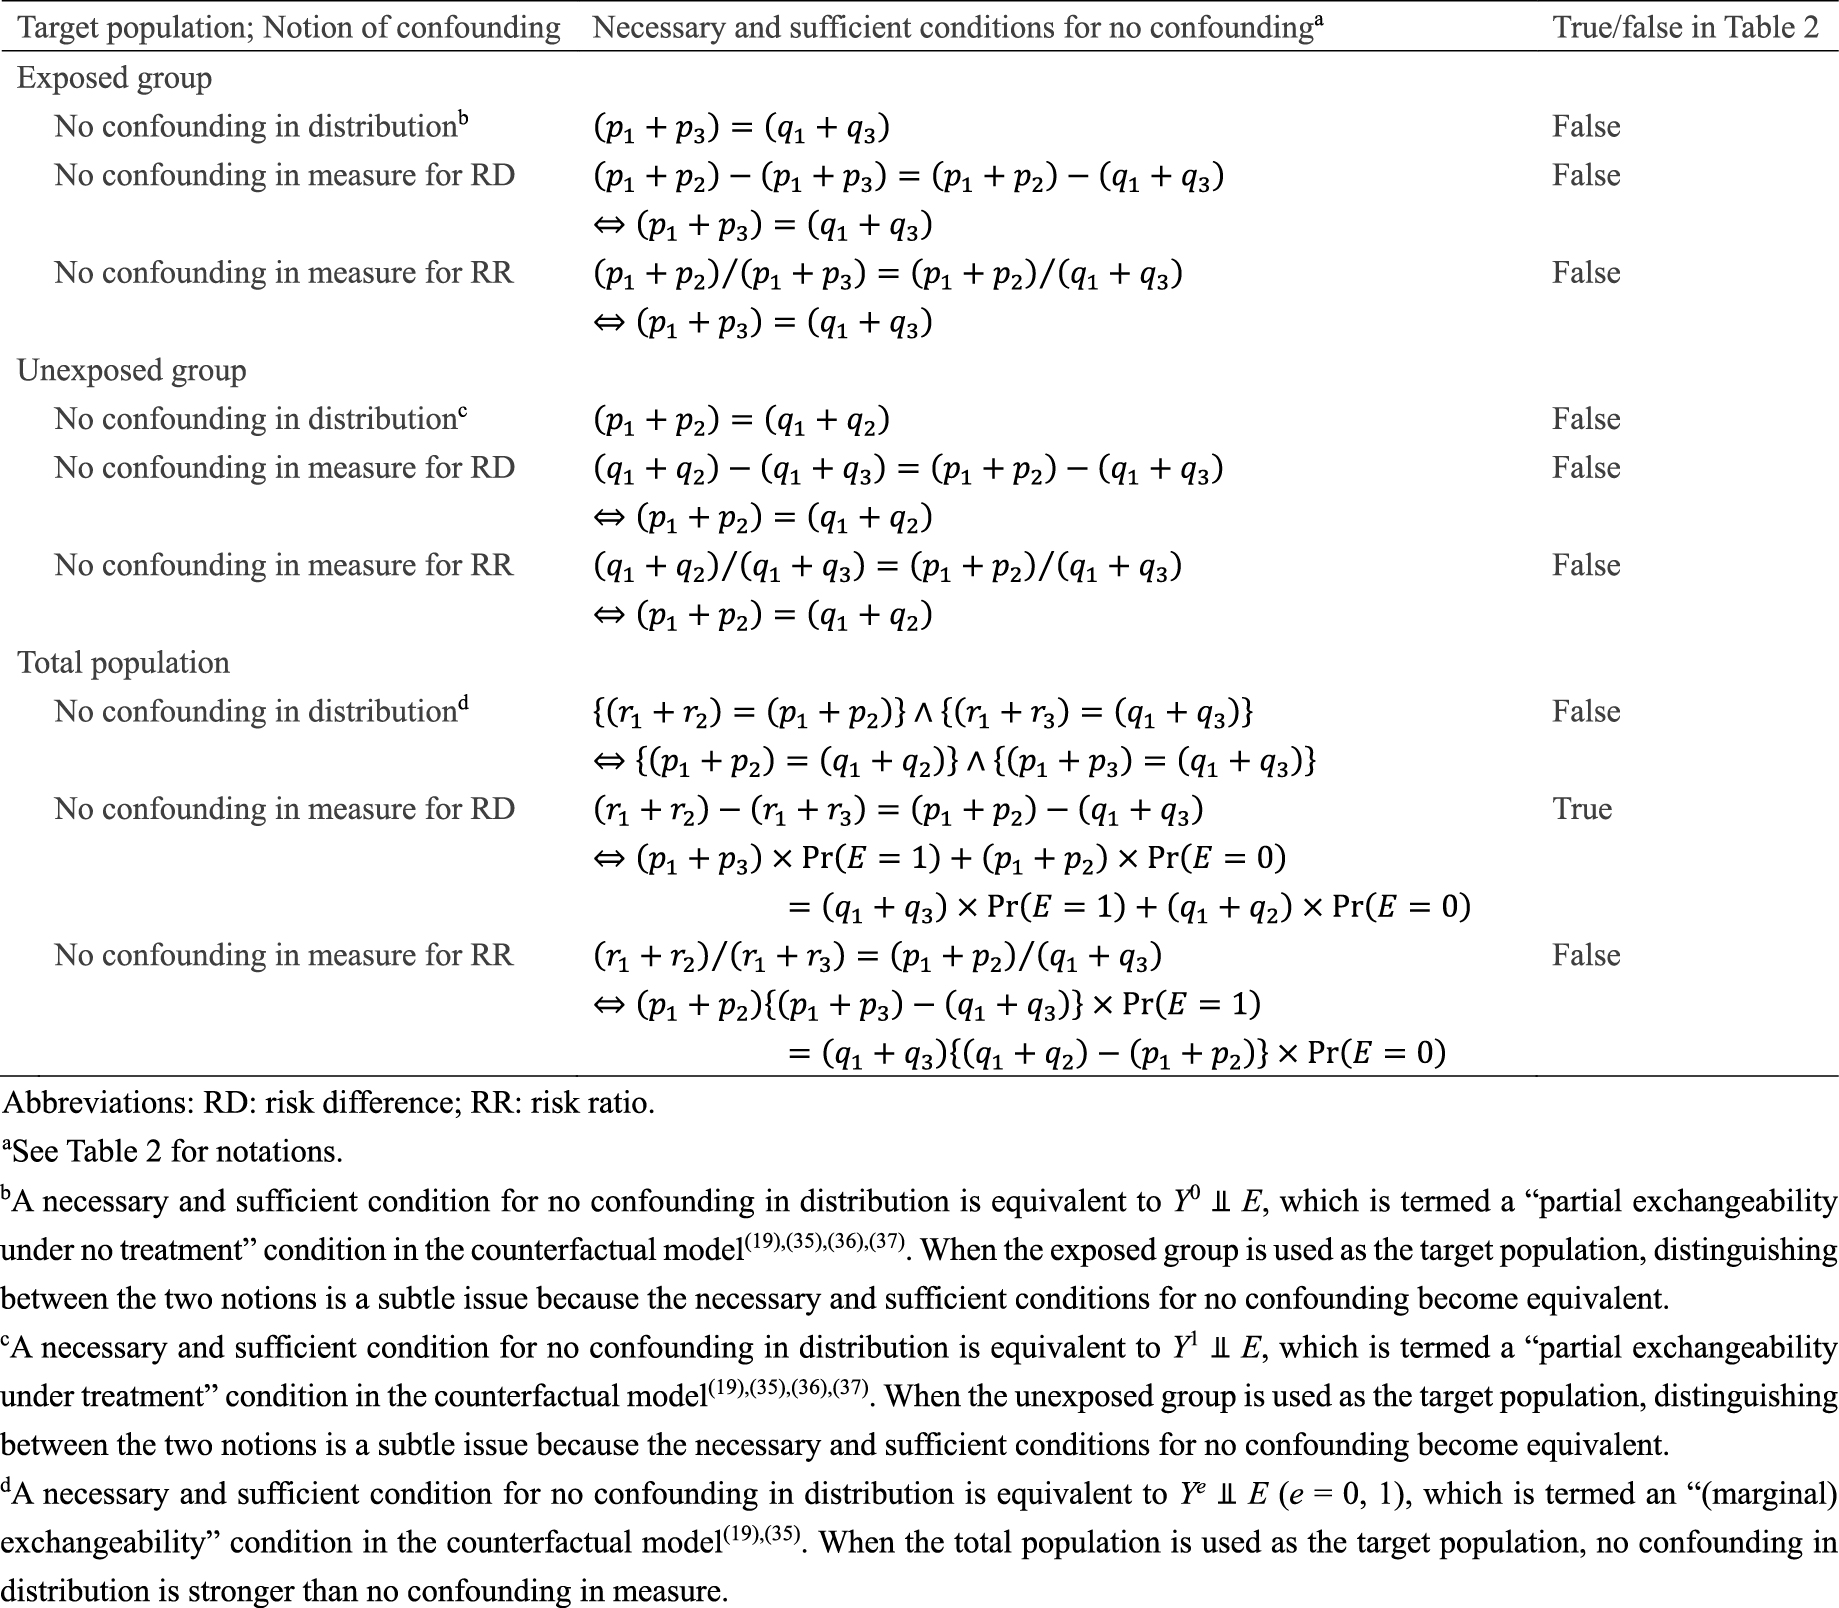
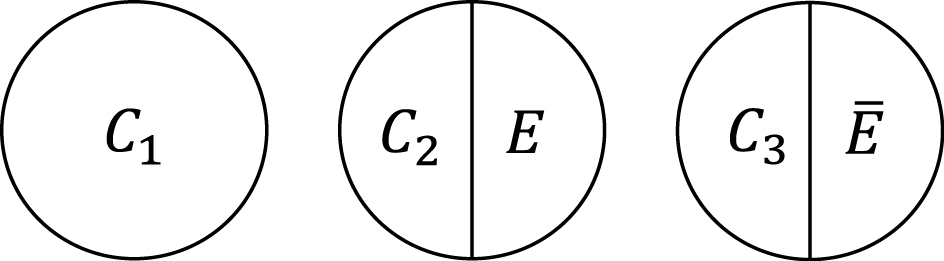
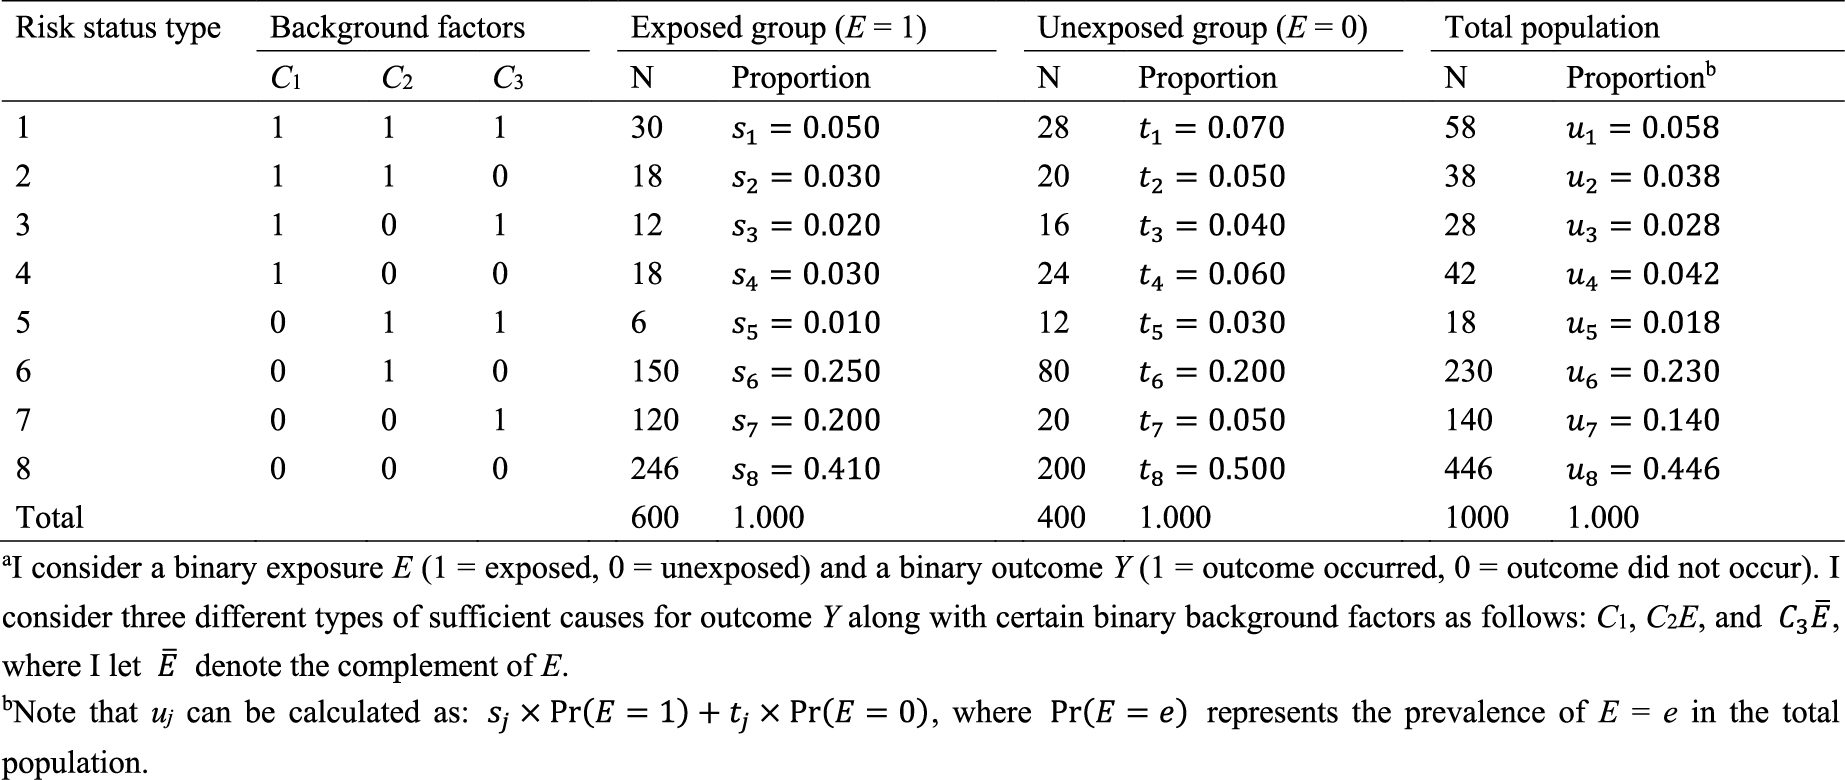
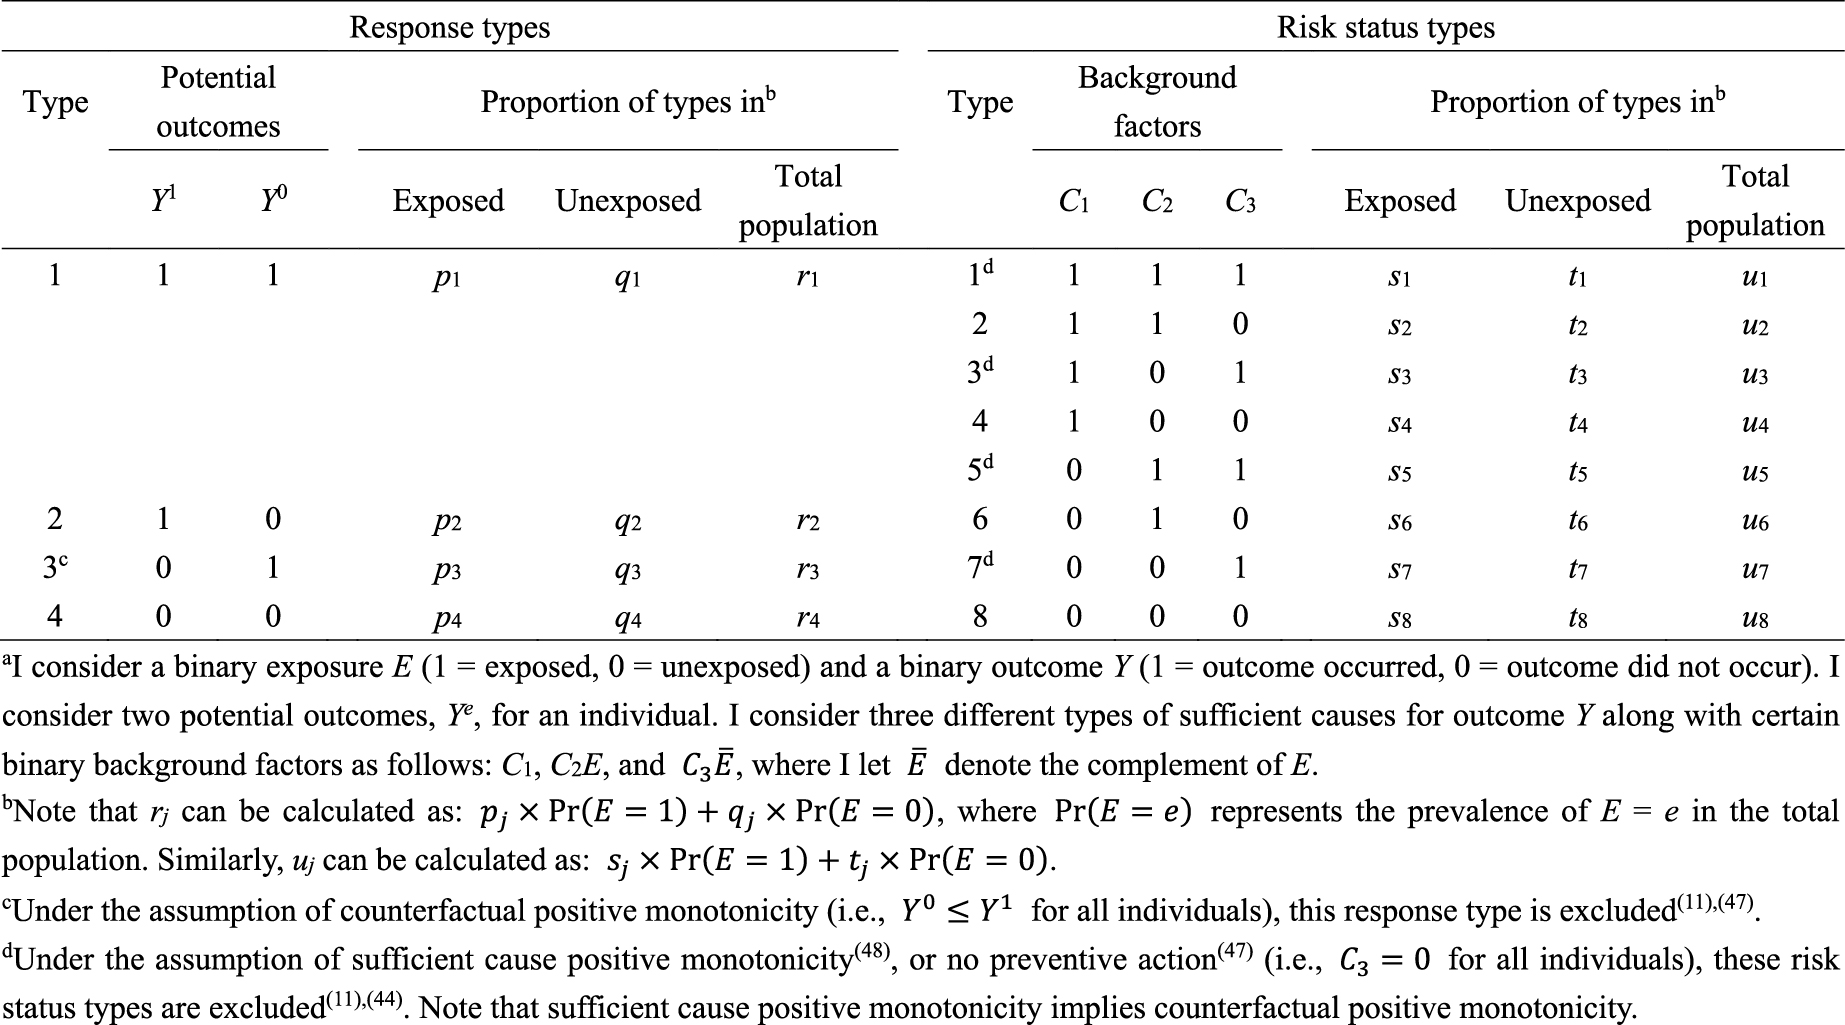
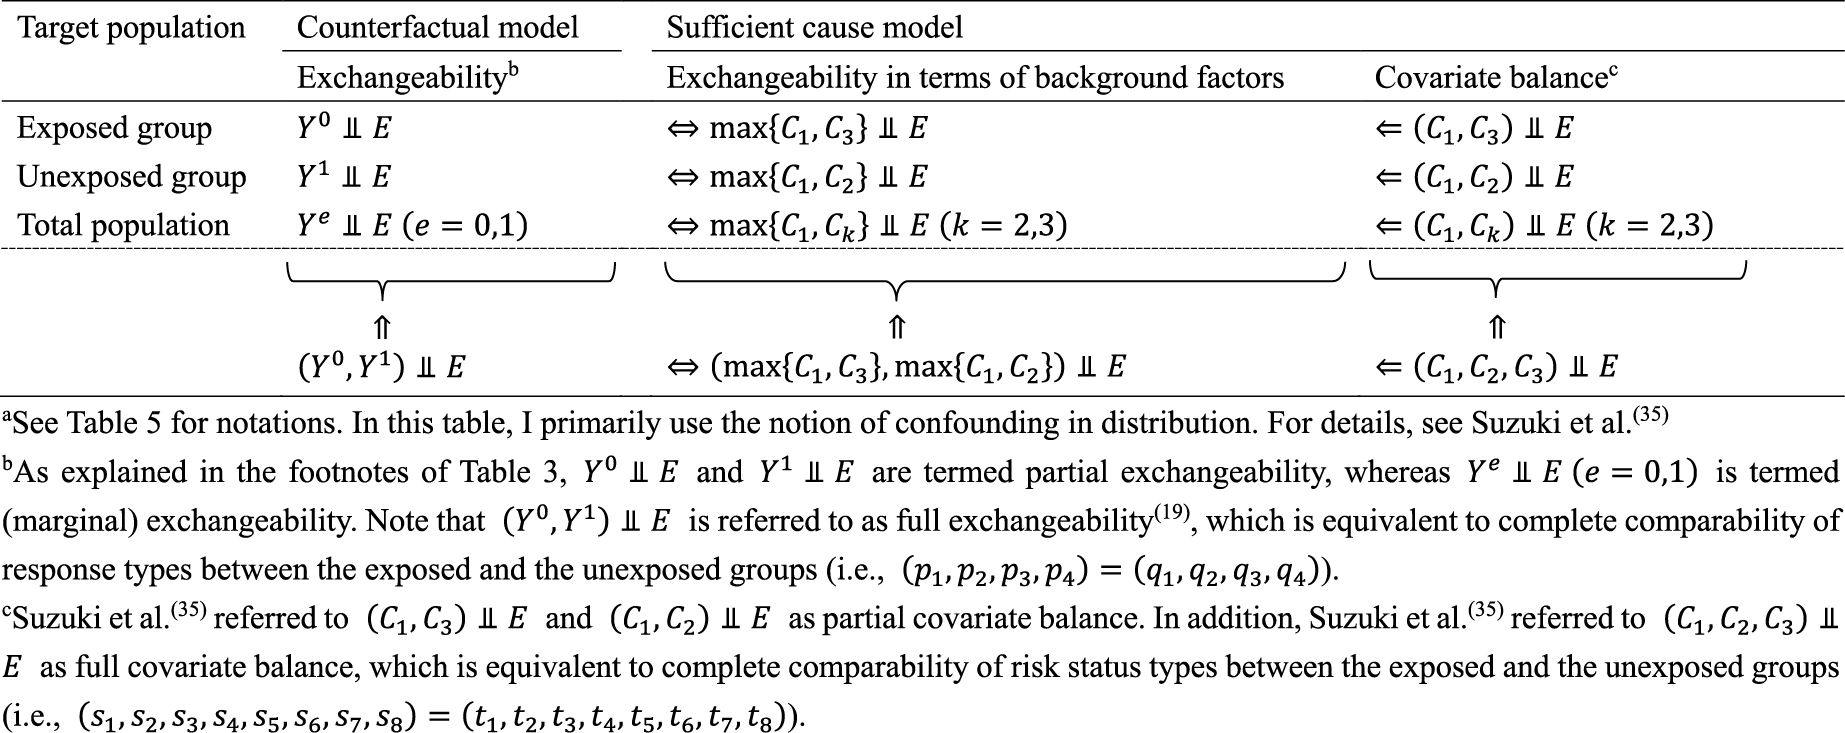
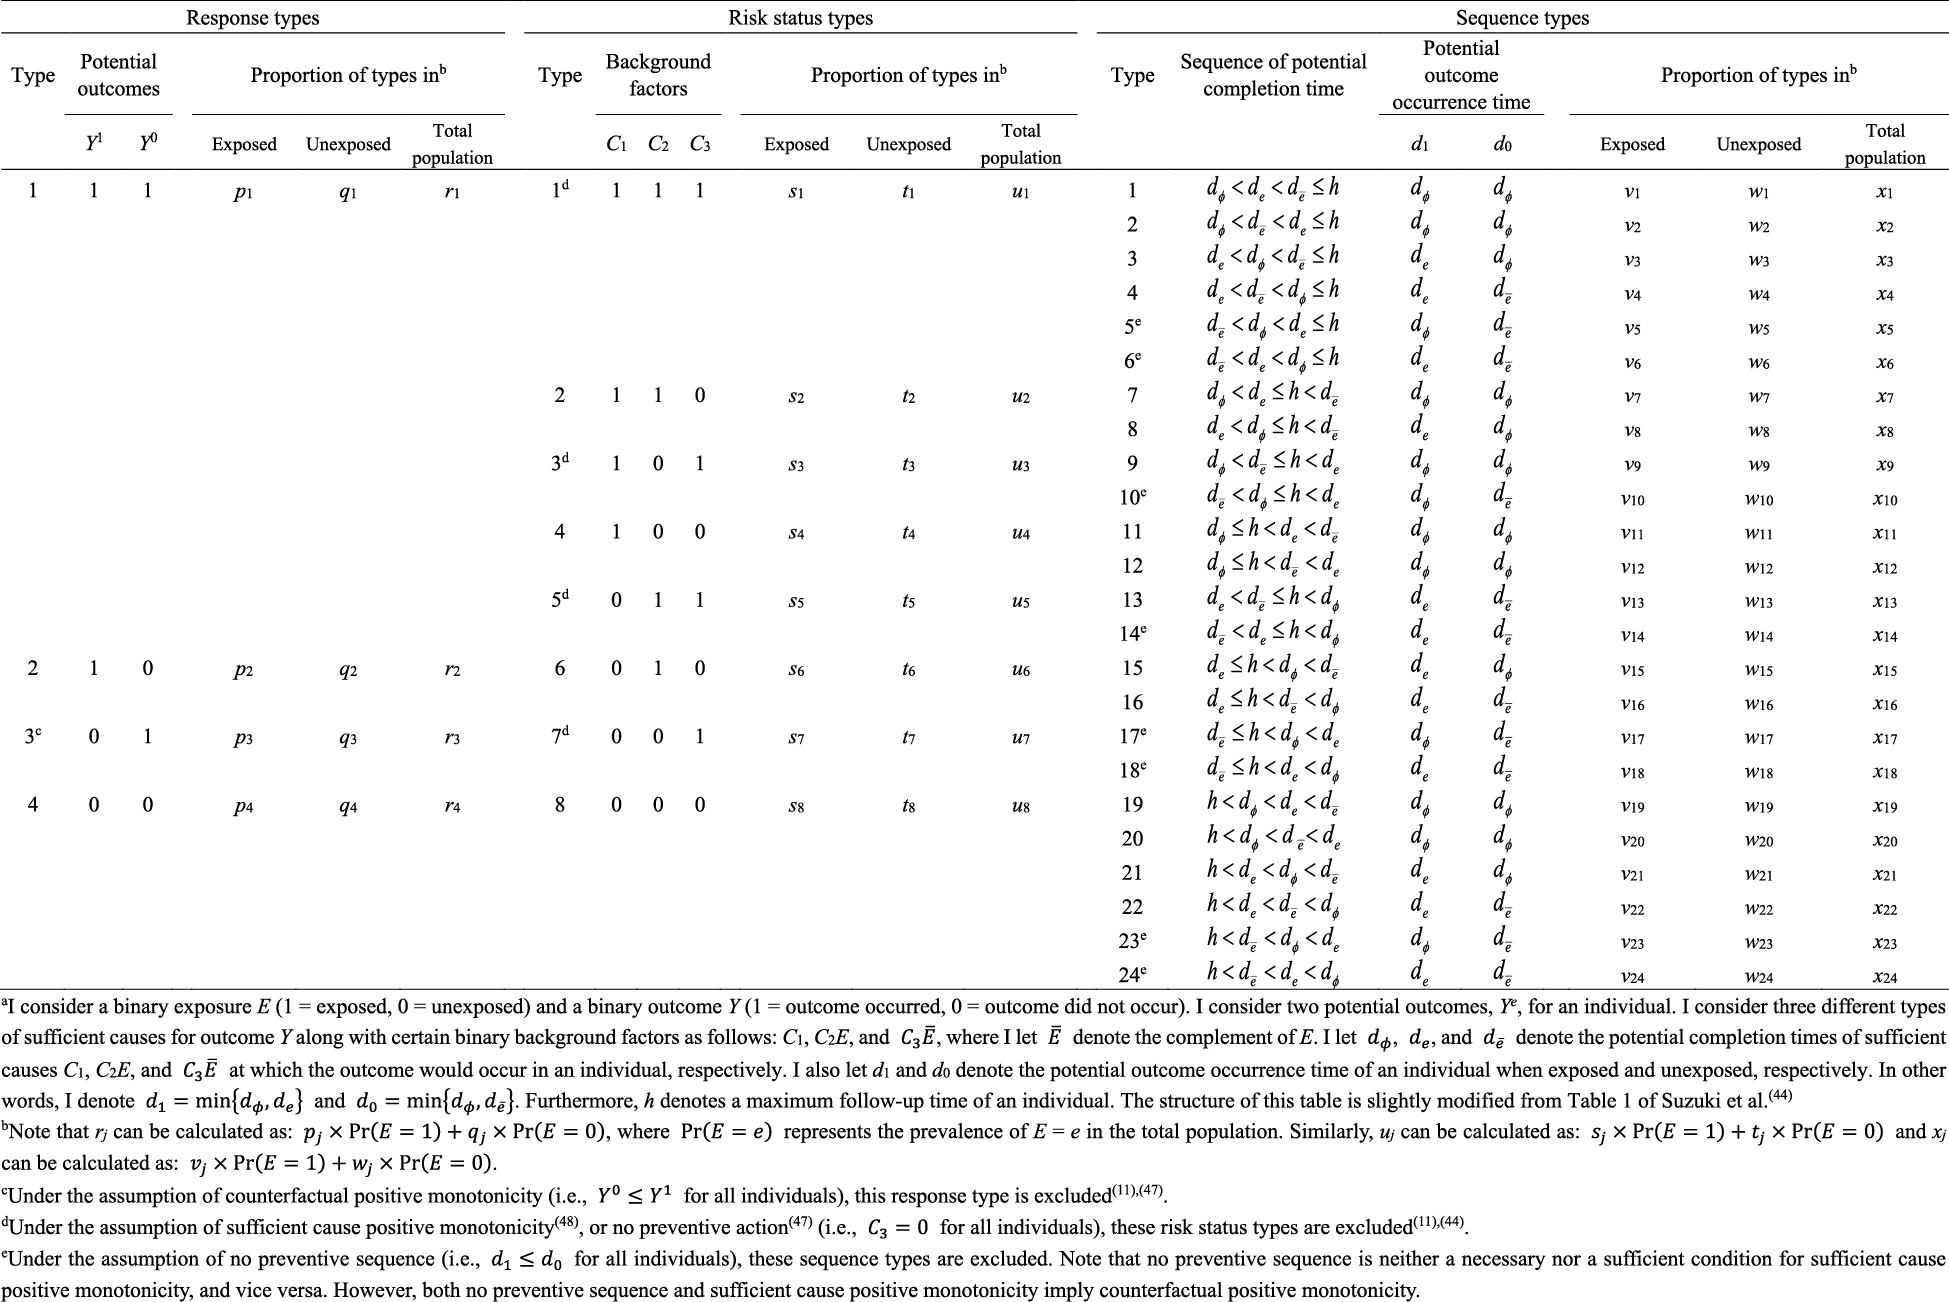
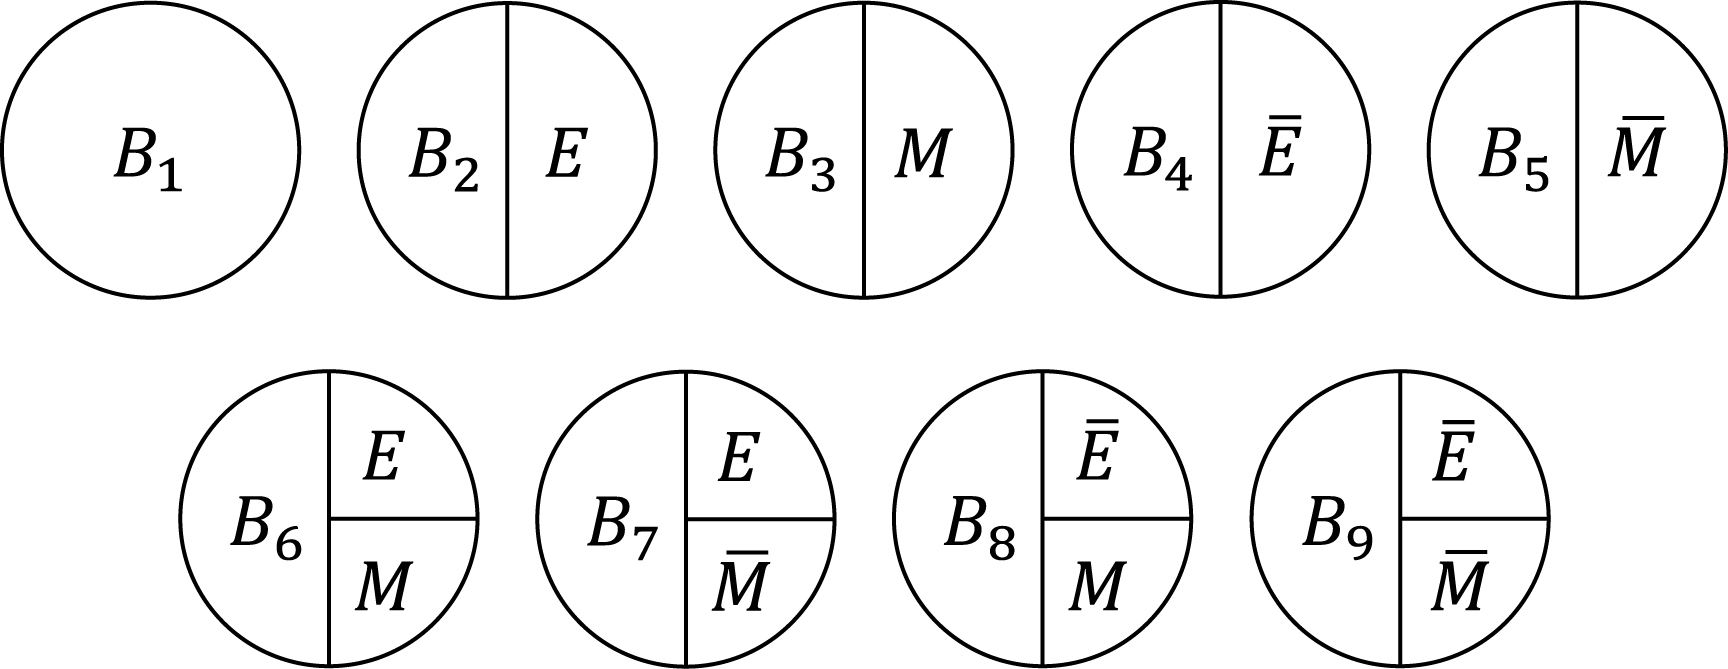
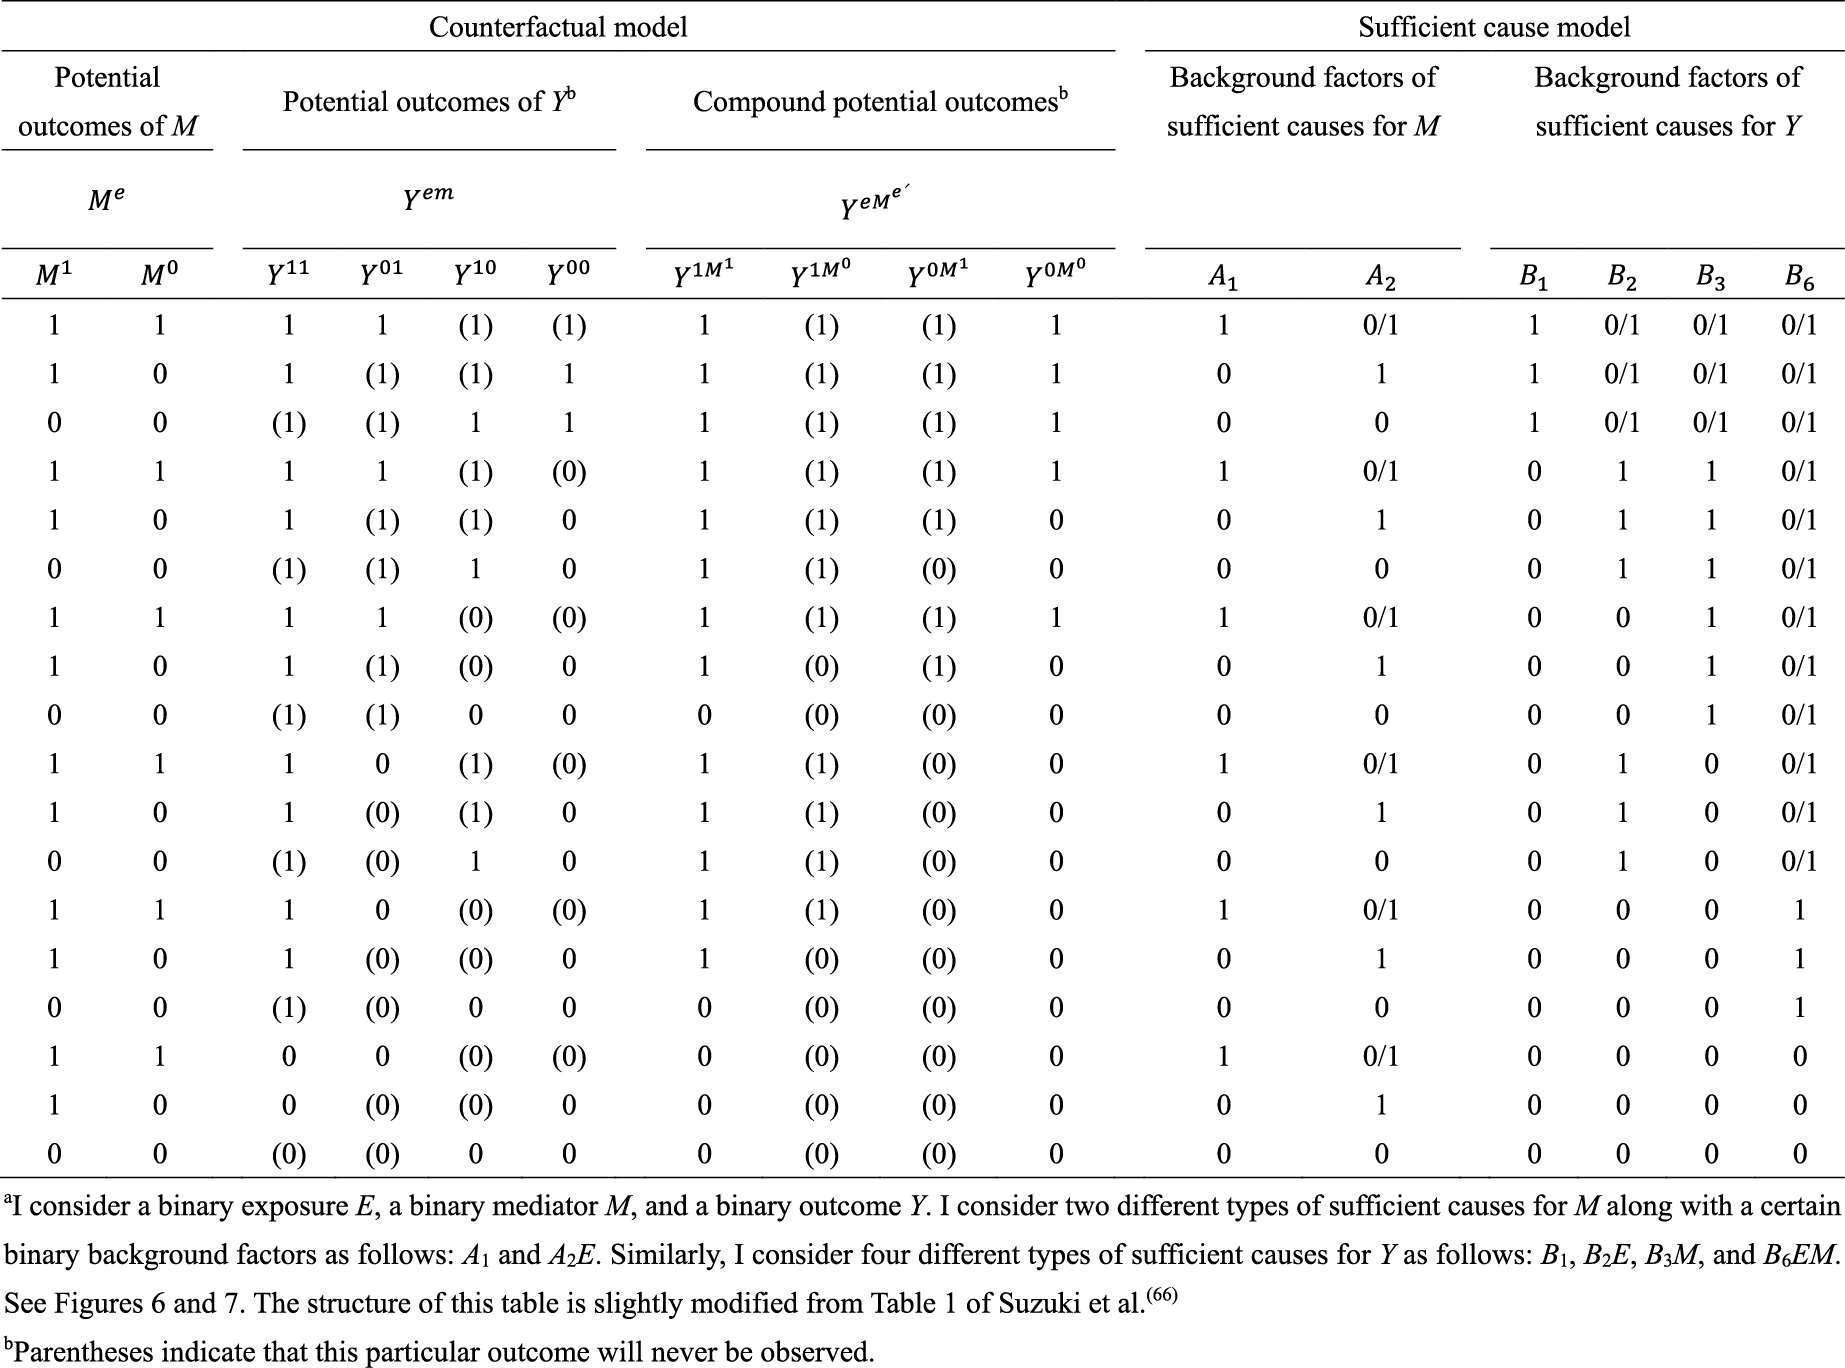
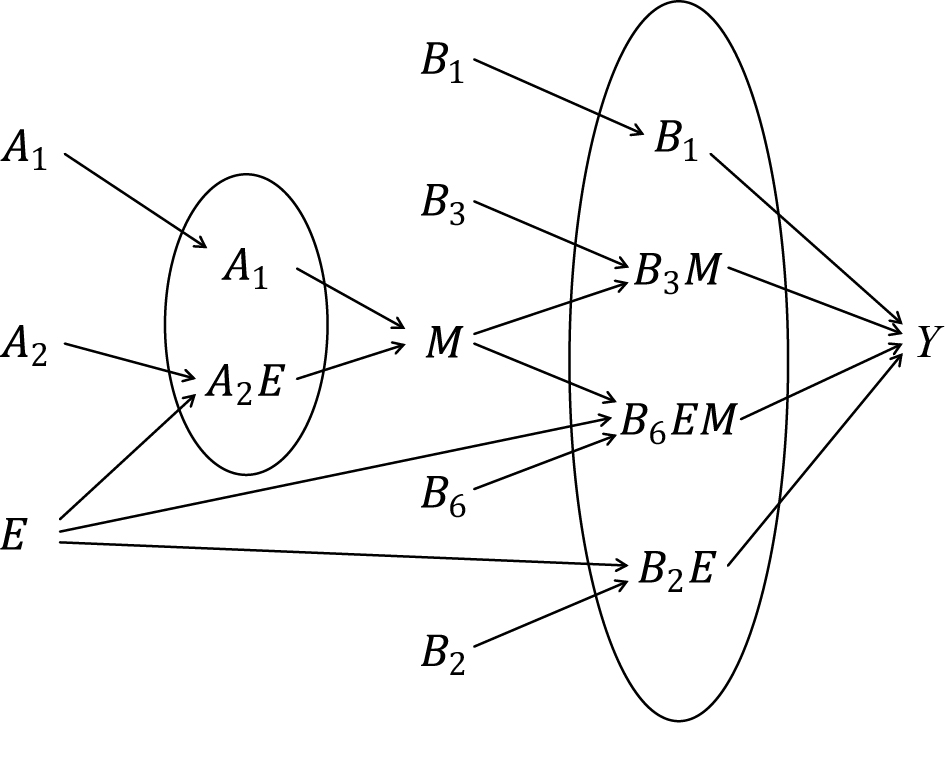
From: Unraveling Causality: Innovations in Epidemiologic Methods
From: Unraveling Causality: Innovations in Epidemiologic Methods

From: Unraveling Causality: Innovations in Epidemiologic Methods
From: Unraveling Causality: Innovations in Epidemiologic Methods
From: Unraveling Causality: Innovations in Epidemiologic Methods
From: Unraveling Causality: Innovations in Epidemiologic Methods
From: Unraveling Causality: Innovations in Epidemiologic Methods
From: Unraveling Causality: Innovations in Epidemiologic Methods

From: Unraveling Causality: Innovations in Epidemiologic Methods
From: Unraveling Causality: Innovations in Epidemiologic Methods
From: Unraveling Causality: Innovations in Epidemiologic Methods
From: Unraveling Causality: Innovations in Epidemiologic Methods
From: Unraveling Causality: Innovations in Epidemiologic Methods
From: Unraveling Causality: Innovations in Epidemiologic Methods
From: Unraveling Causality: Innovations in Epidemiologic Methods
From: Unraveling Causality: Innovations in Epidemiologic Methods
From: Unraveling Causality: Innovations in Epidemiologic Methods