Figure 1. Symptoms by history of vaccination in individuals without (blue plots) and with (red plots) COVID-19.
Data are the mean body temperature (A) and the proportions for fatigue (B), headache (C), rhinorrhea (D), sore throat (E), and cough (F) adjusted for sex, age, and risk factors for severe illness. The error bars indicate 95% confidence intervals. *P < 0.05 versus unvaccinated individuals; +P < 0.05 versus those vaccinated within 2 months. The solid line indicates the cubic spline for months after the last vaccination, whereas the dotted lines denote the upper and lower limits of its 95% confidence interval.
From: Association between History of Vaccination and Symptoms at Diagnosis of Coronavirus Disease 2019
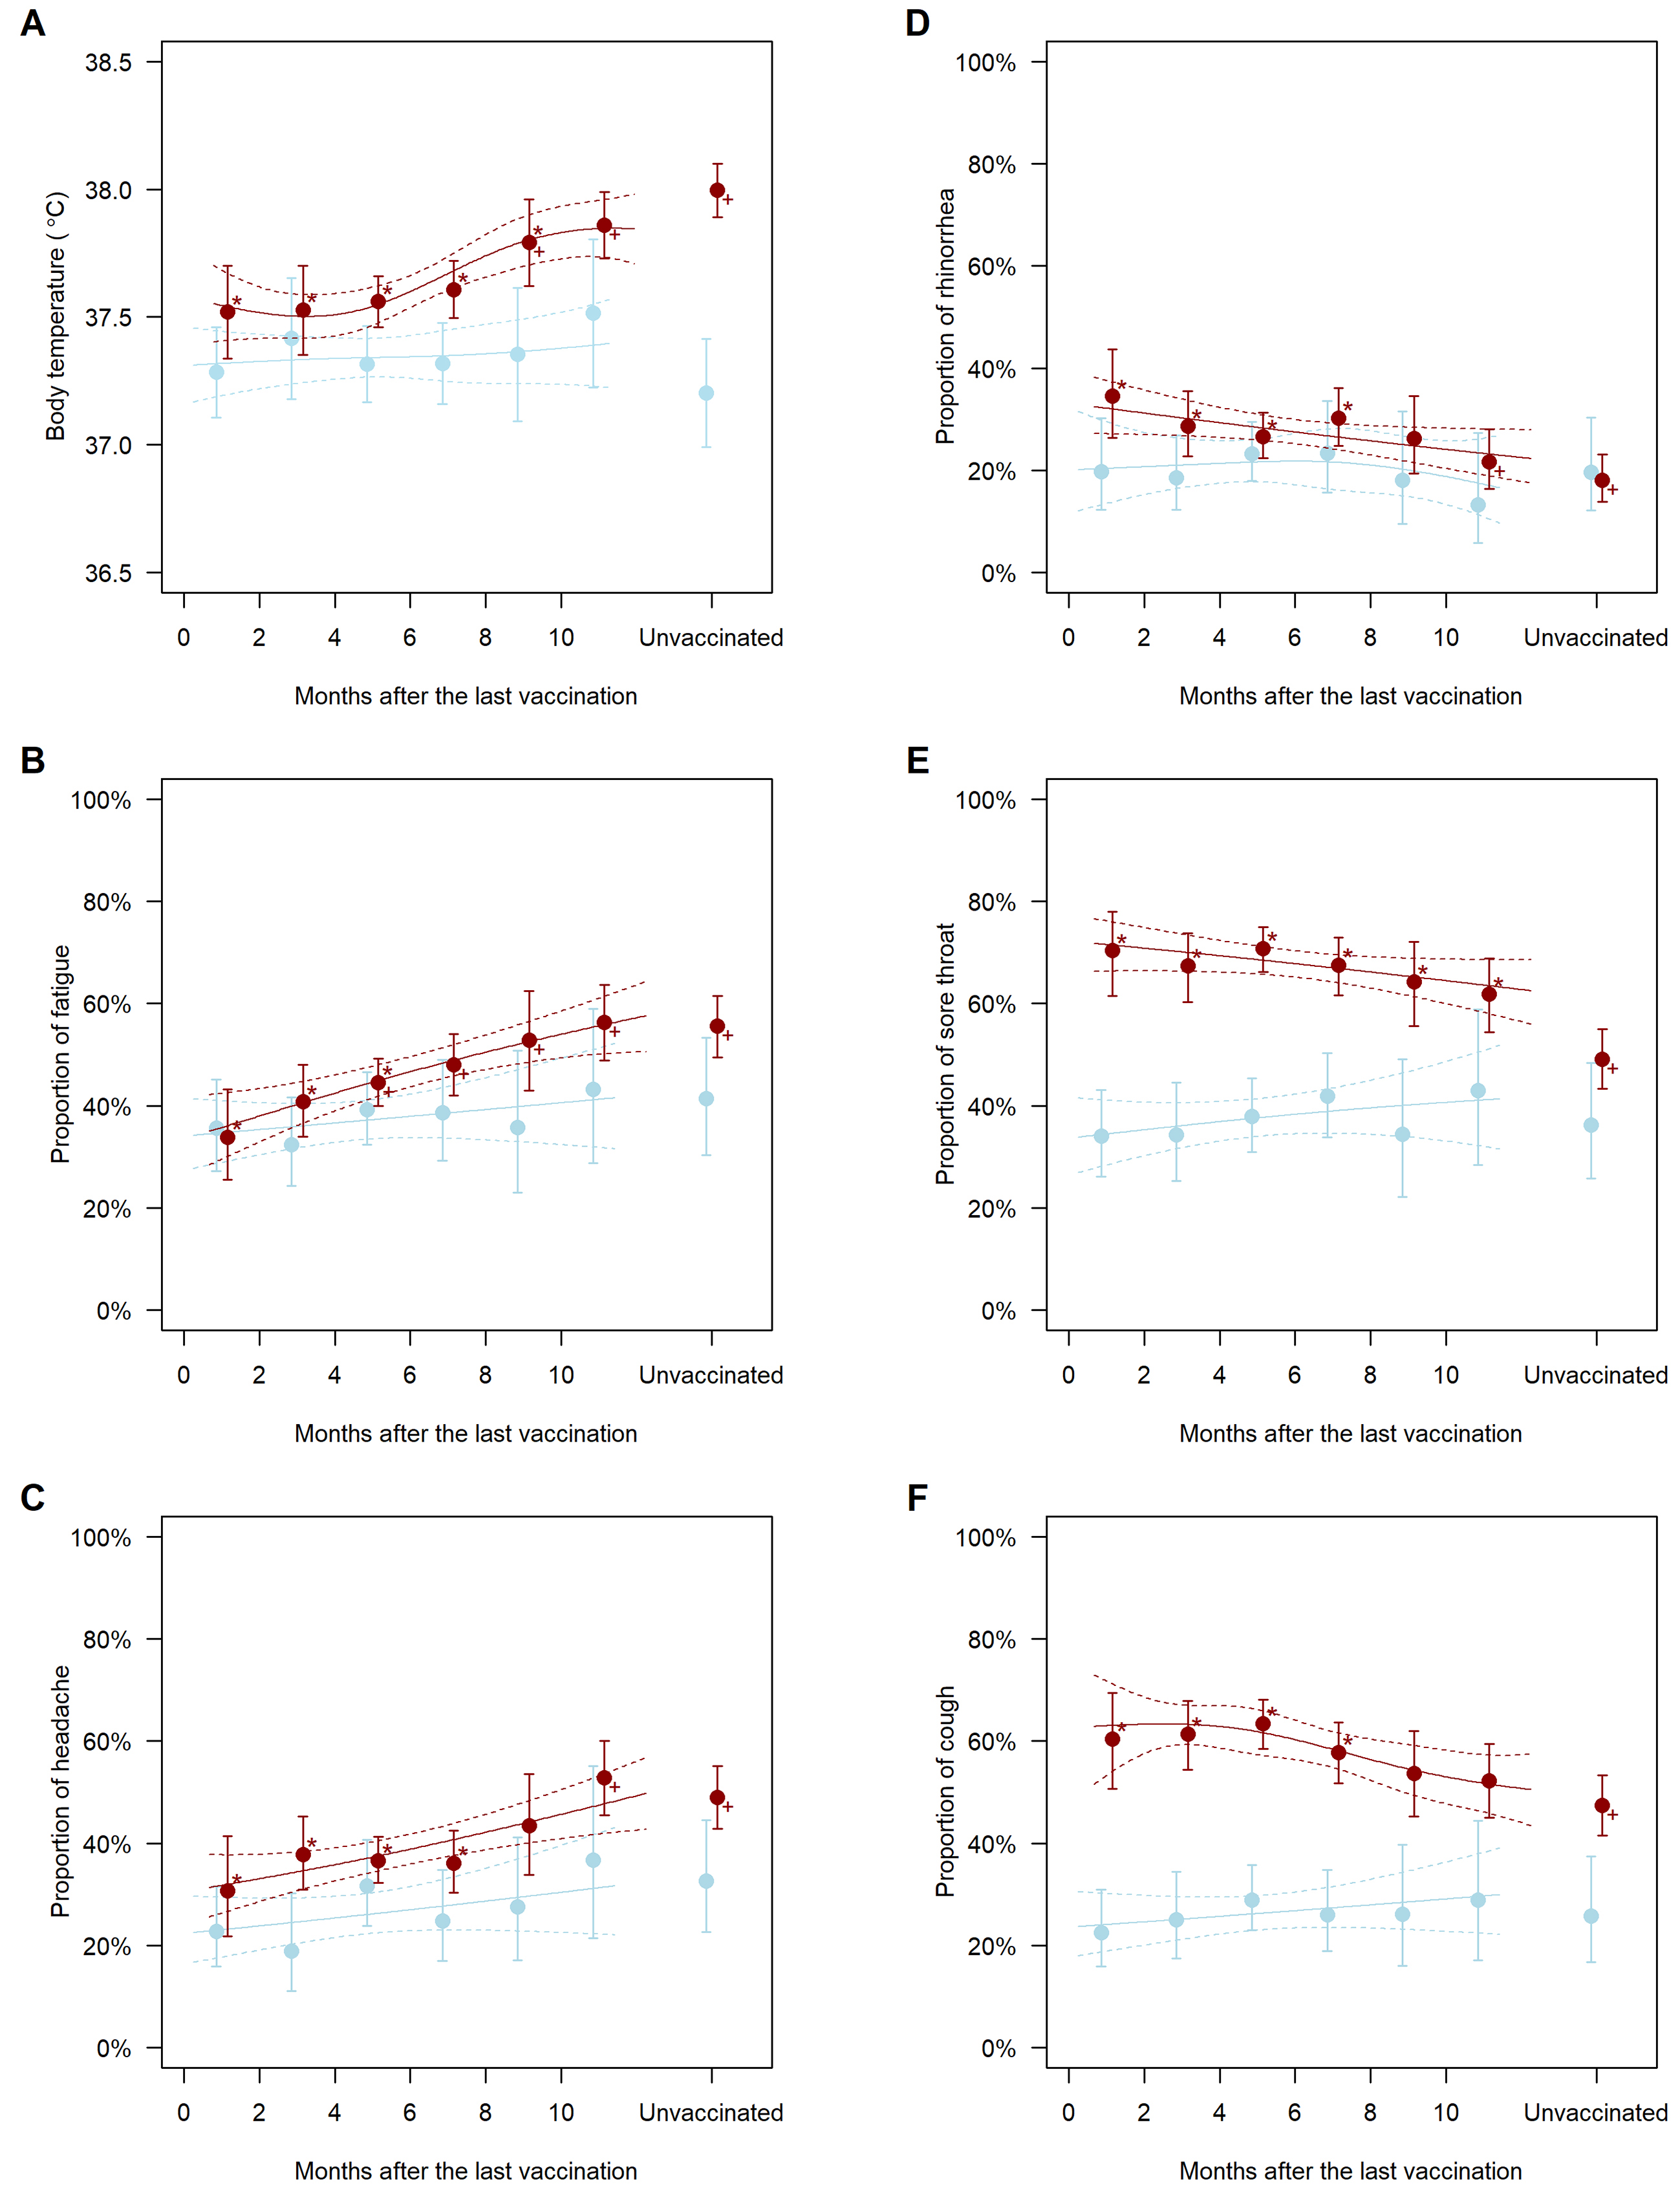
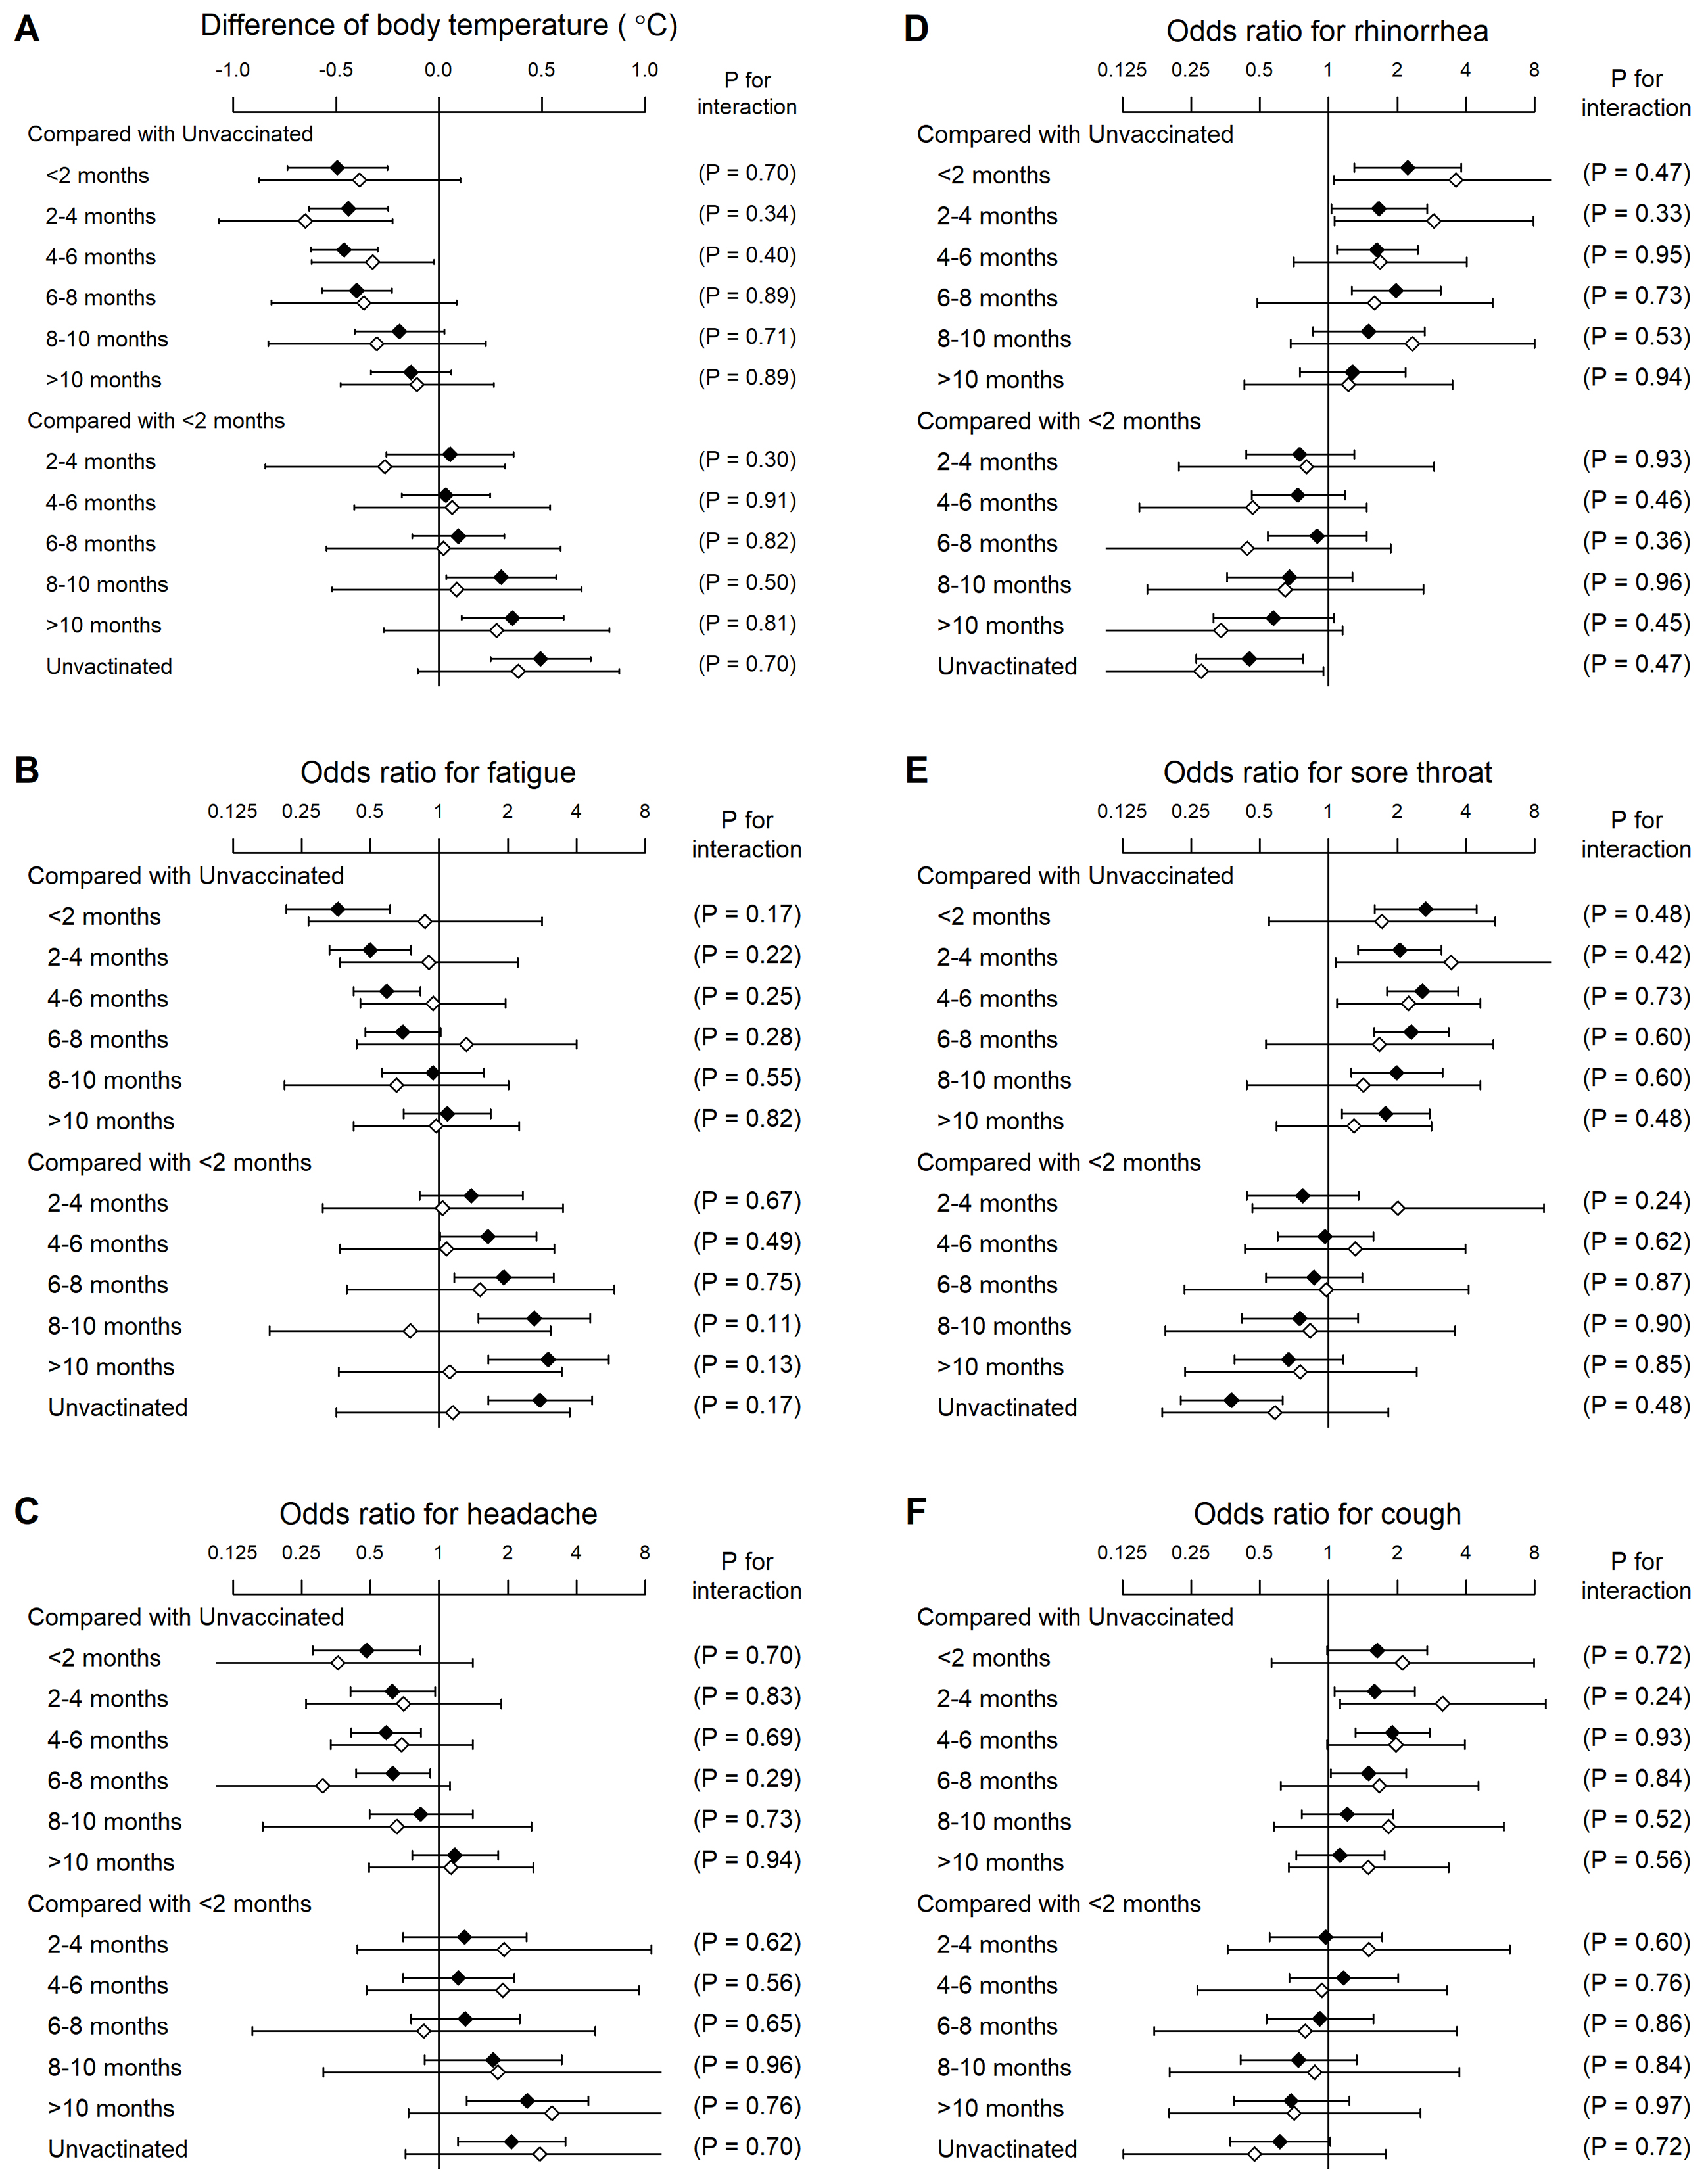
Figure 2. Interaction effect of clinical (blank diamonds) versus laboratory (filled diamonds) diagnosis with COVID-19 on the association between history of vaccination and symptoms in COVID-19 individuals.
Data are the mean body temperature (A) and the proportions for fatigue (B), headache (C), rhinorrhea (D), sore throat (E), and cough (F) adjusted for sex, age, and risk factors for severe illness. The error bars indicate 95% confidence intervals. P values are for the interaction of clinical and laboratory diagnoses with COVID-19.
From: Association between History of Vaccination and Symptoms at Diagnosis of Coronavirus Disease 2019