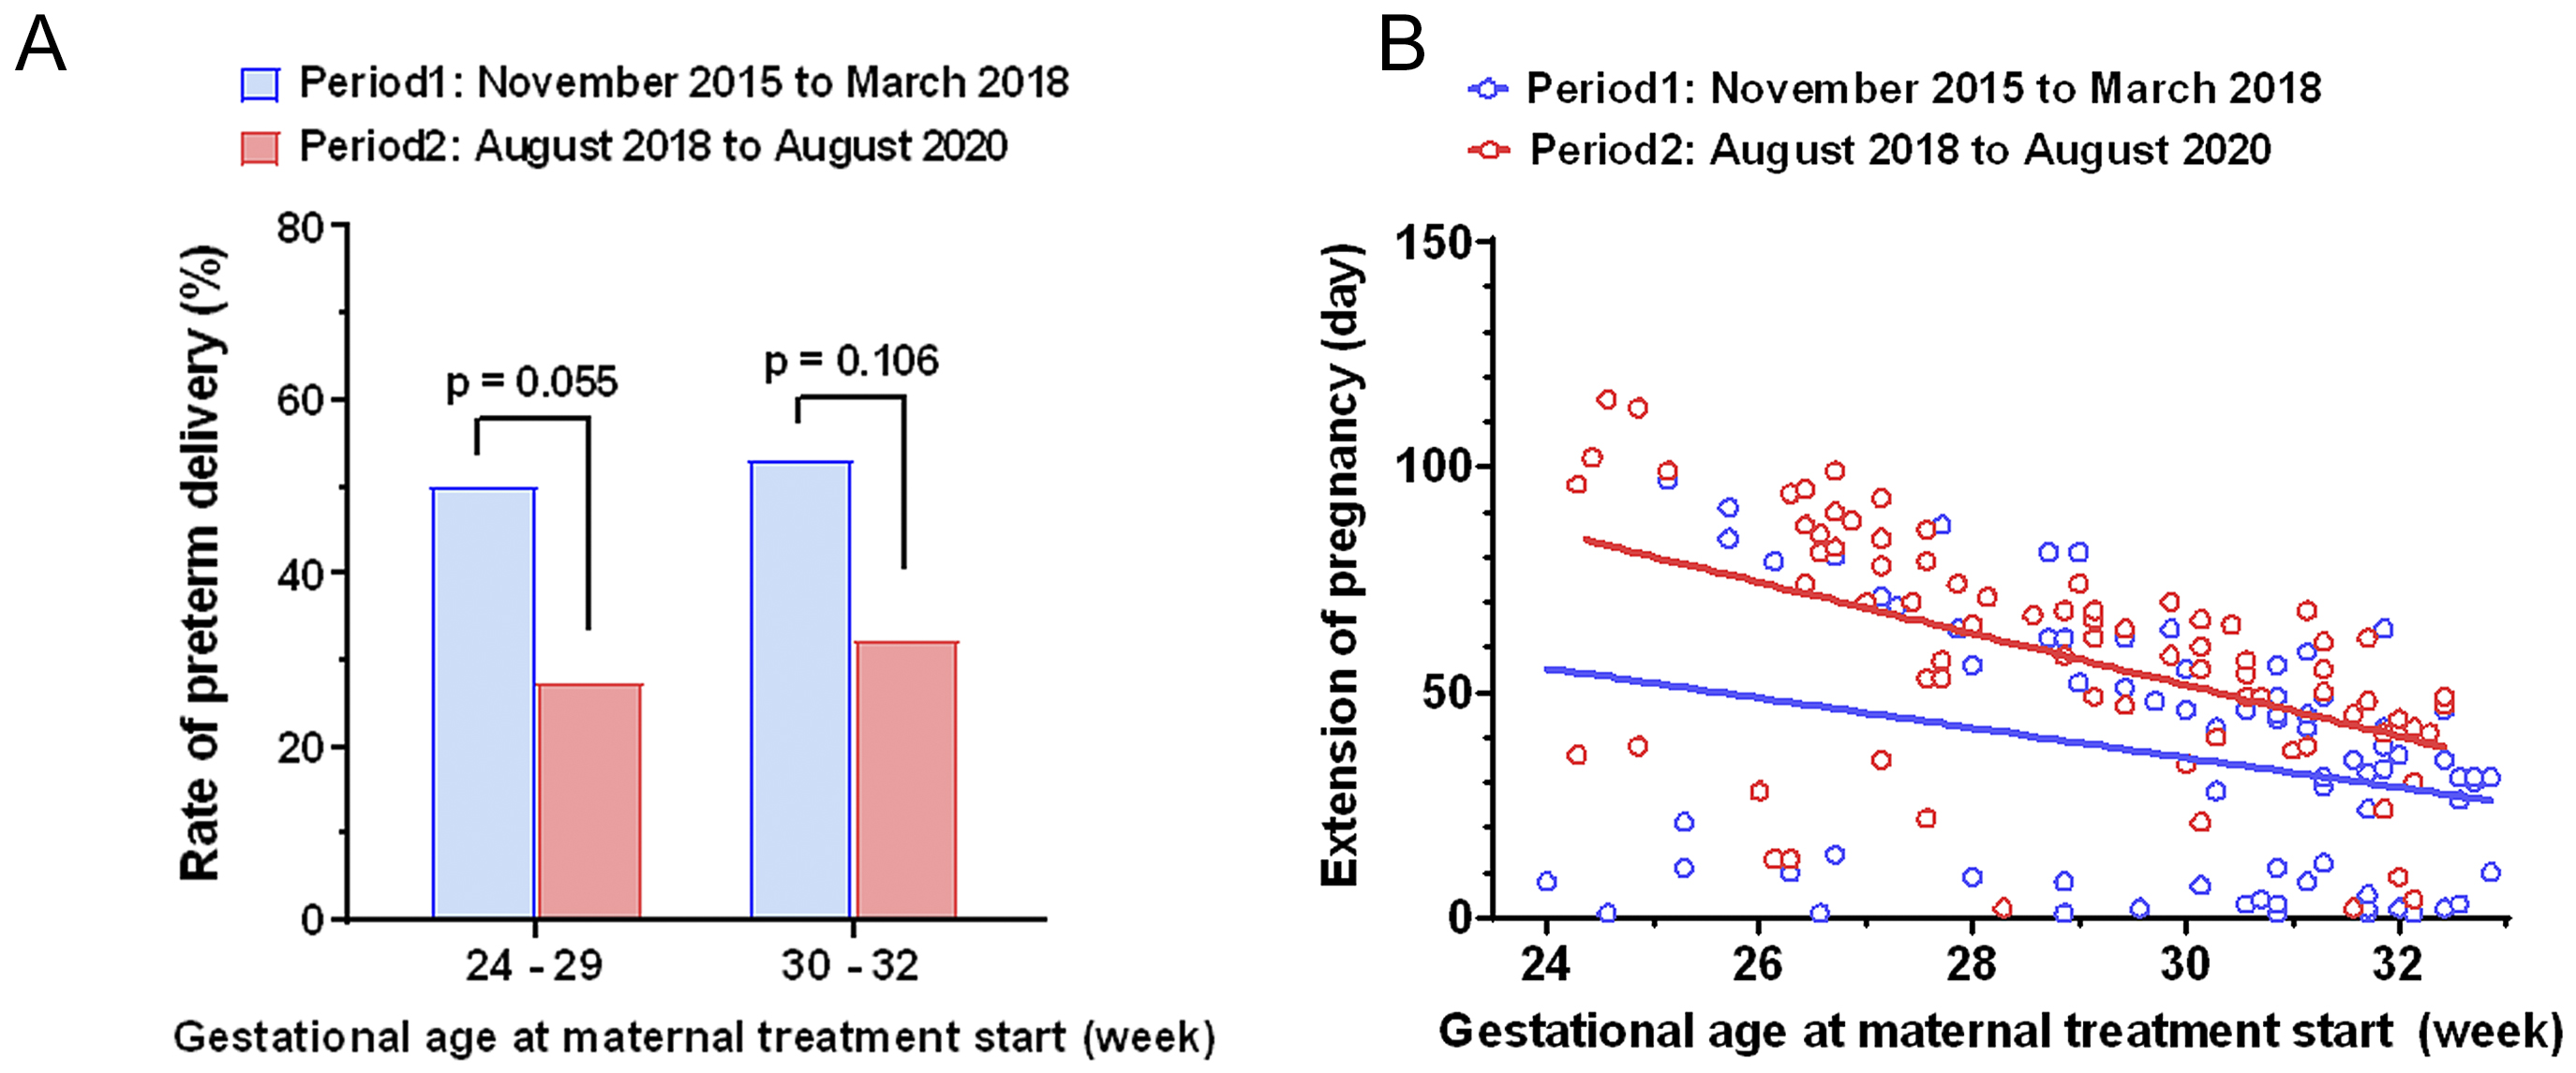
Figure 2. A) Comparison of preterm delivery rates in each period; 24-29 weeks or 30-32 weeks of gestation. The blue bar represents Period 1, and the red bar indicates Period 2. B) Scatterplots depicting the relationship between the number of days of pregnancy extension and the gestational age at which maternal treatment was initiated. The blue circles and line represent the values for each patient and best-fit line in Period 1, whereas the red circles and line indicate those in Period 2. A trend was observed in the correlation coefficients between the two groups, but it was not statistically significant (Fisher’s z transformation; p = 0.099).
From: Possible Efficacy of Vaginal Progesterone on Asymptomatic Women with a Short Cervix after 24 Weeks of Gestation: A Historical Cohort Study in Japan