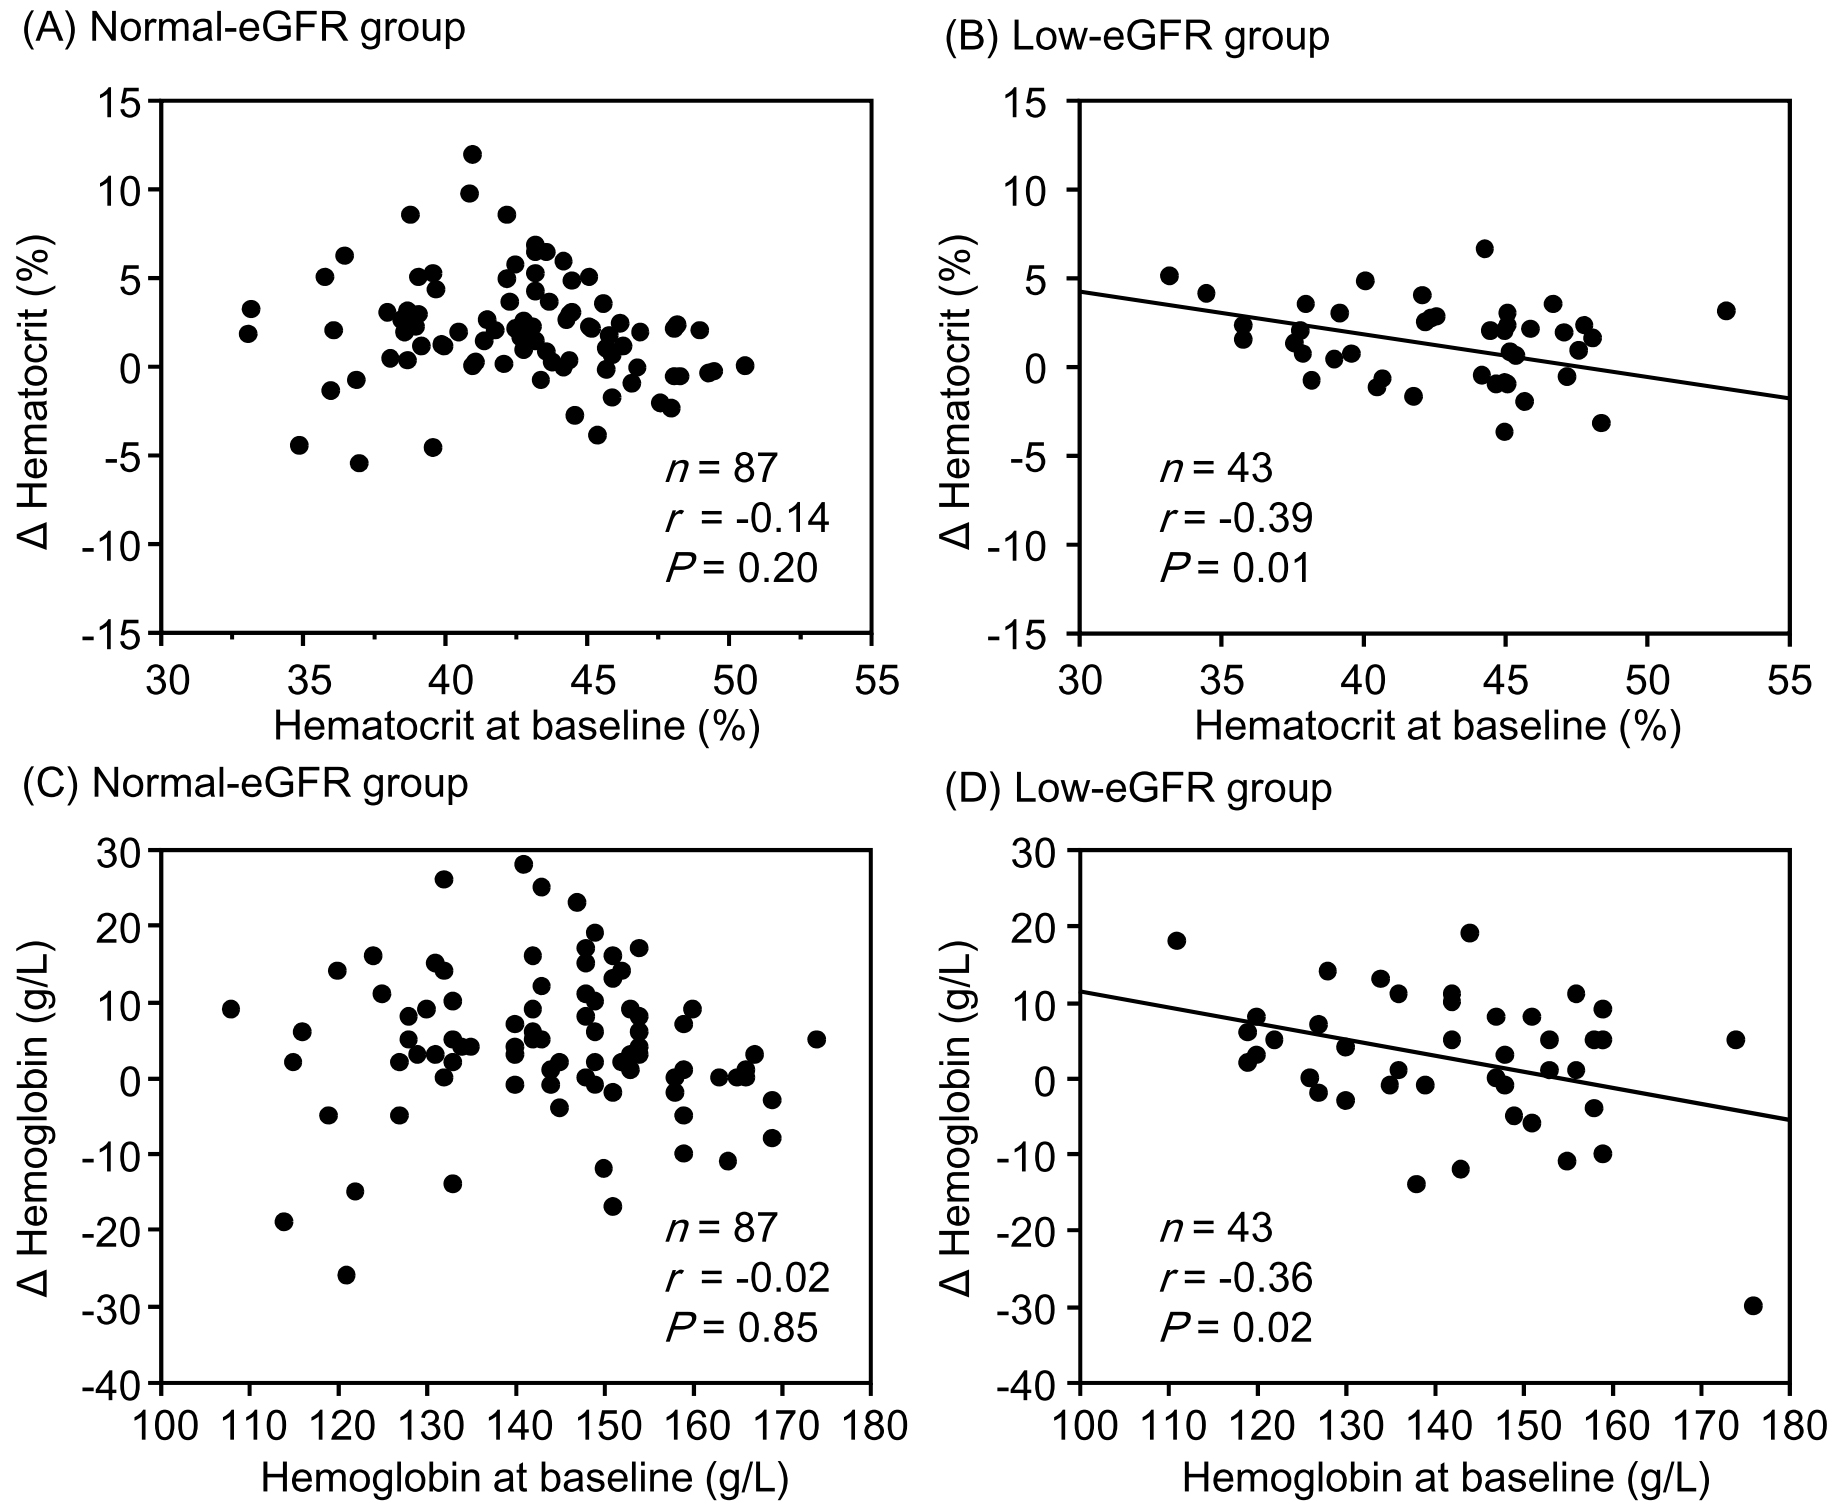
Figure 1. Relationship between changes in hematocrit and hemoglobin and their corresponding baseline values. Hematocrit levels in the normal- (A) and low-estimated glomerular filtration rate (eGFR) (B) groups. Hemoglobin levels in the normal- (C) and low-eGFR (D) groups.
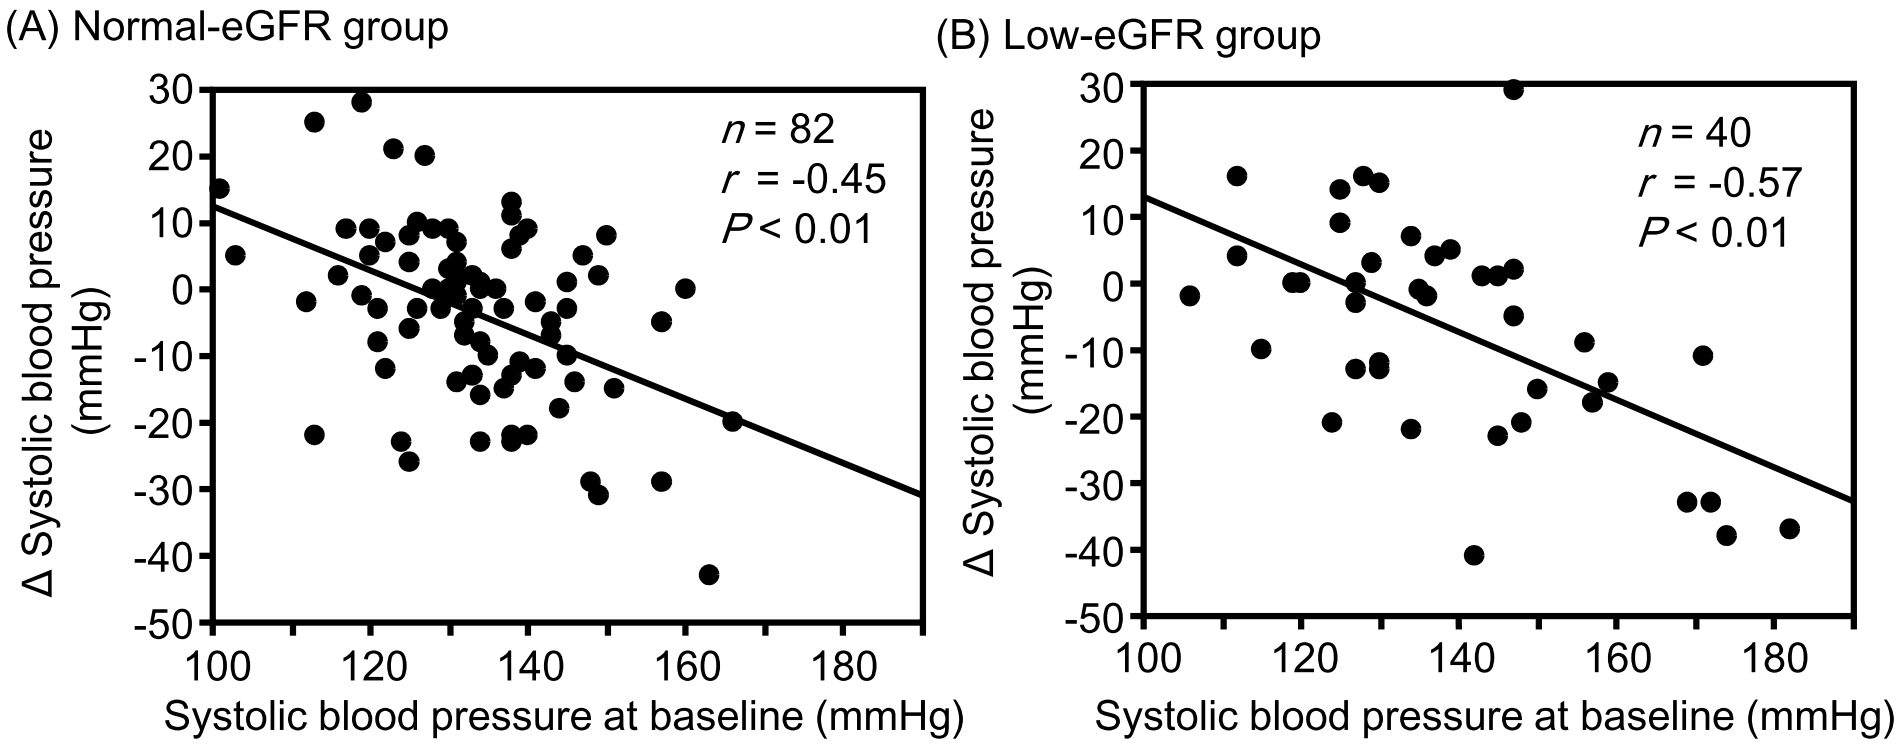
Figure 2. Relationship between changes in systolic blood pressure and baseline values. The normal- (A) and low-estimated glomerular filtration rate (eGFR) (B) groups.
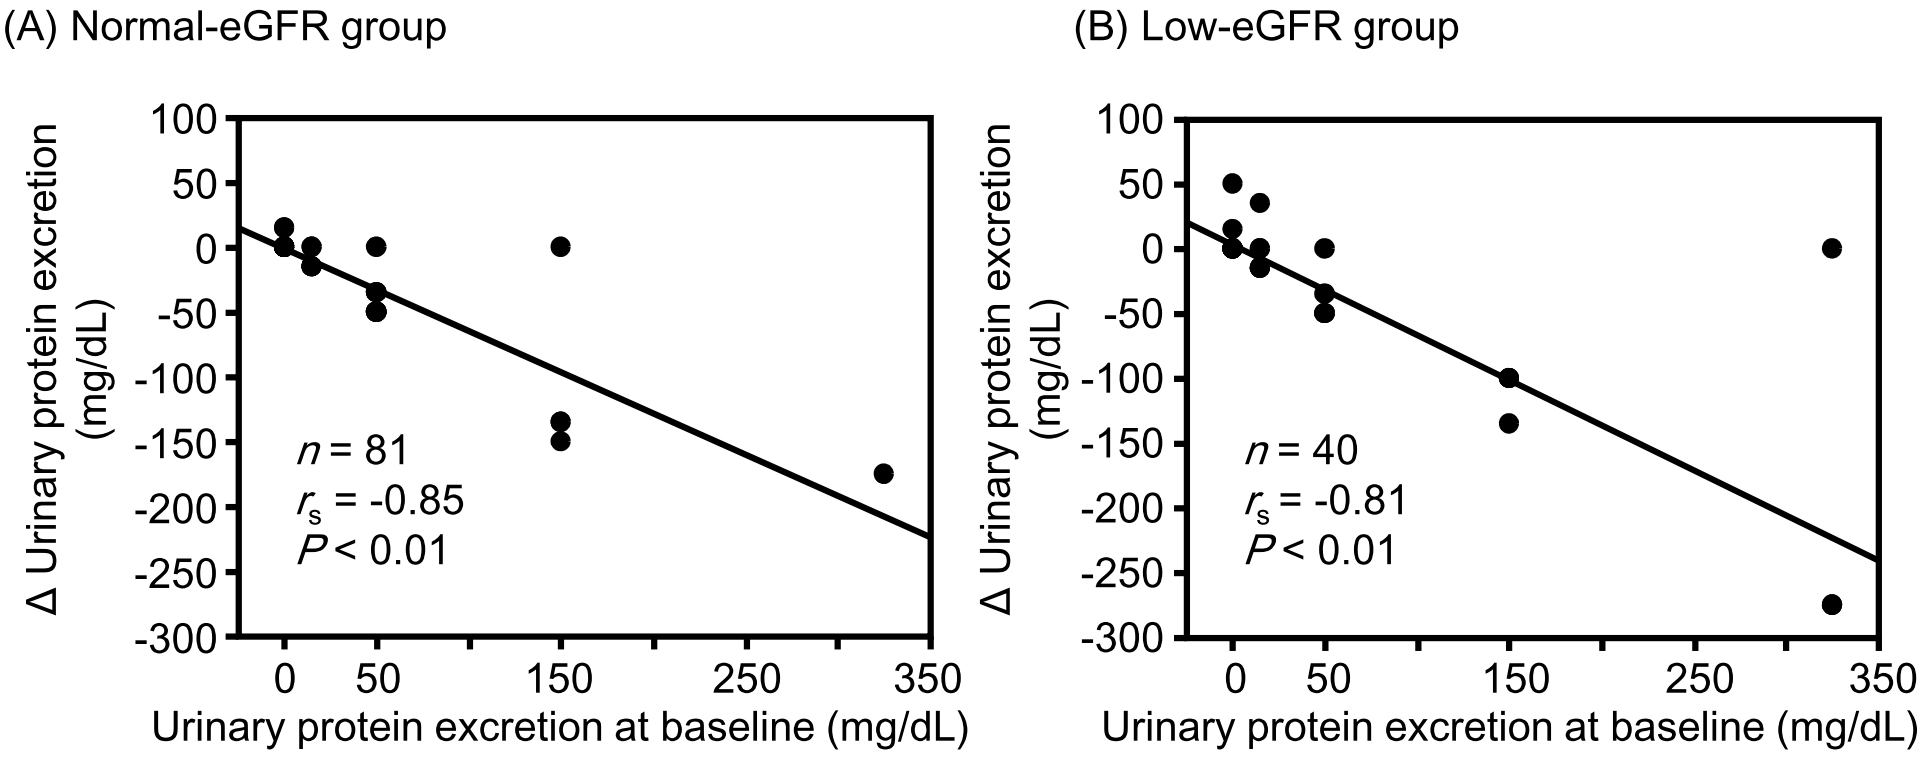
Figure 3. Relationship between changes in urinary protein excretion and the baseline values. The normal- (A) and low-estimated glomerular filtration rate (eGFR) (B) groups.