Figure 1. Schematic of the neural network architecture
A neural network mimics the structure of human brain cells and comprises input, hidden, and output layers. The neuron, which is the basic unit of the neural network, contains adjustable parameters called weights. Each neuron calculates output values from the inputs and weights and then passes these individual outputs to the next neurons. In the final output layer, the network computes the aggregated values from the preceding neurons and applies an activation function (e.g., sigmoid for binary classification and softmax for multiple classifications) to generate the final output. The loss, which is defined as the difference between the predicted output and ground truth, is minimized during the training process. Neural networks can be stacked to greater depths, which allows them to approximate various functions and handle diverse input types.
From: Deep Learning Applications in 12-lead Electrocardiogram and Echocardiogram
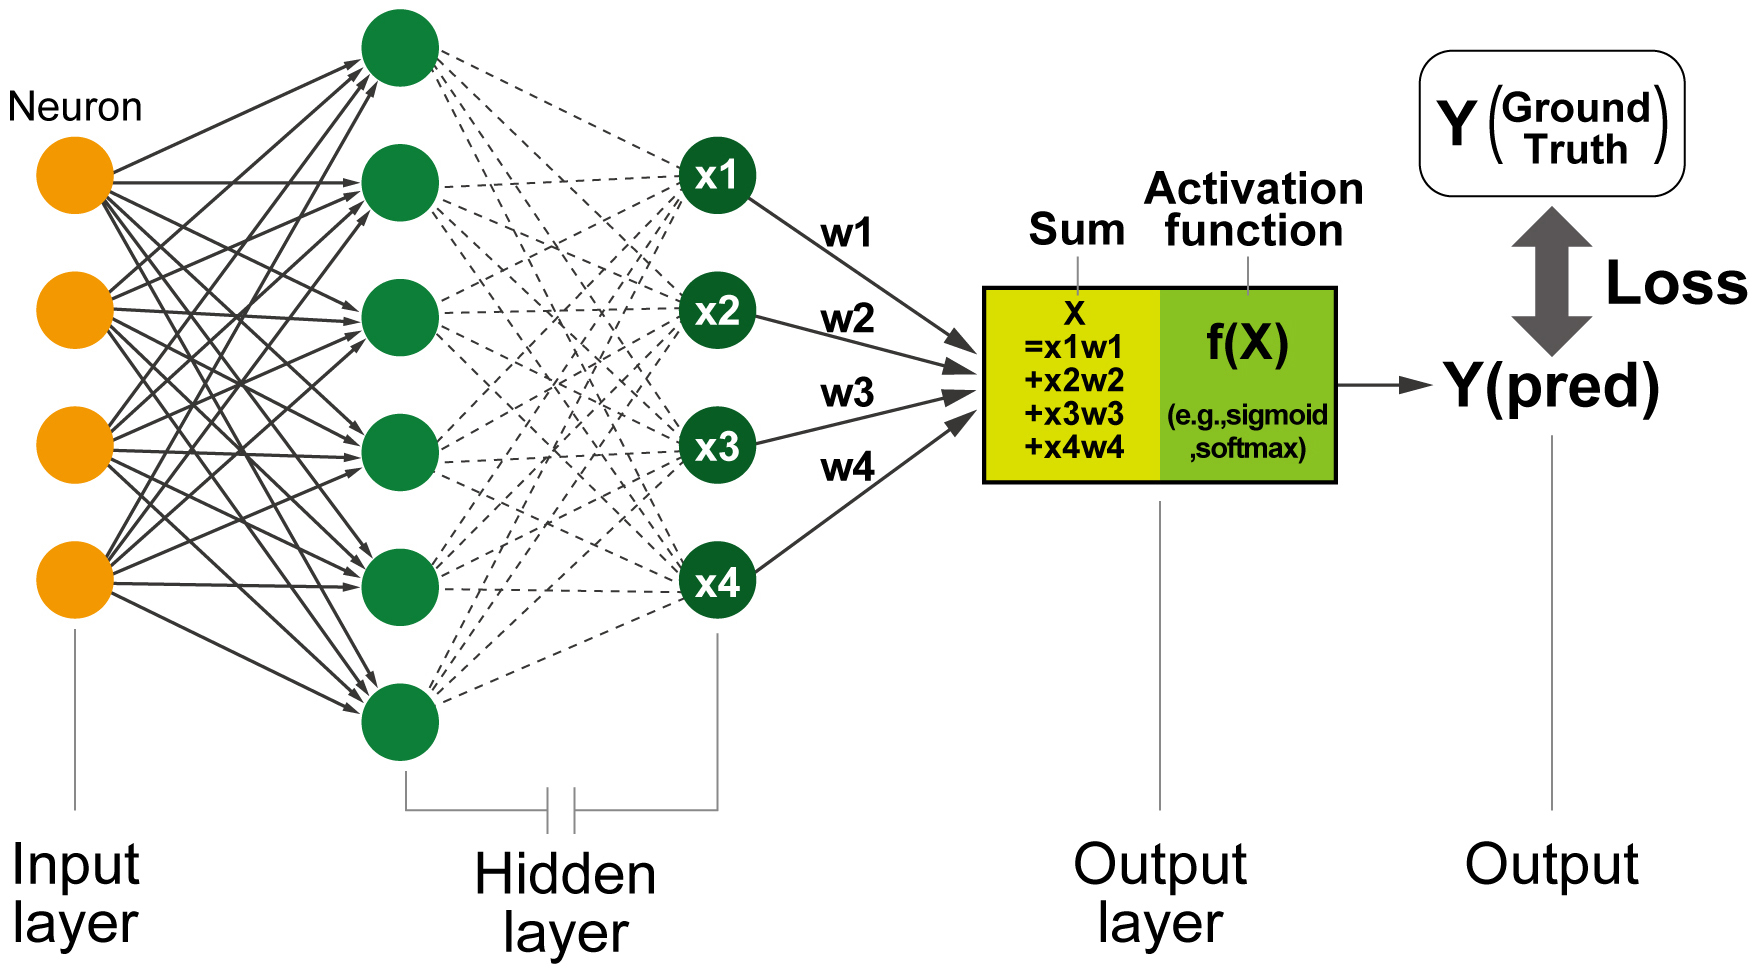
Figure 2. Overview of 12-lead electrocardiogram (ECG) signal data
A. A common ECG records cardiac electrical activities from 12 different angles and directions over a 10-s period on the body surface. Each heartbeat is characterized by distinct components of the waveforms, and various measurements are derived.
B. The recorded 12-lead ECG comprises numerical values corresponding to the amplitudes of the raw ECG signal. An example 2D matrix of 12-lead ECG is shown with units of microvolts versus milliseconds. ECG data typically consist of recordings from 12 leads over 10 s at either 250 or 500 Hz, represented as a 12 × 2500 or 12 × 5000 matrix.
From: Deep Learning Applications in 12-lead Electrocardiogram and Echocardiogram
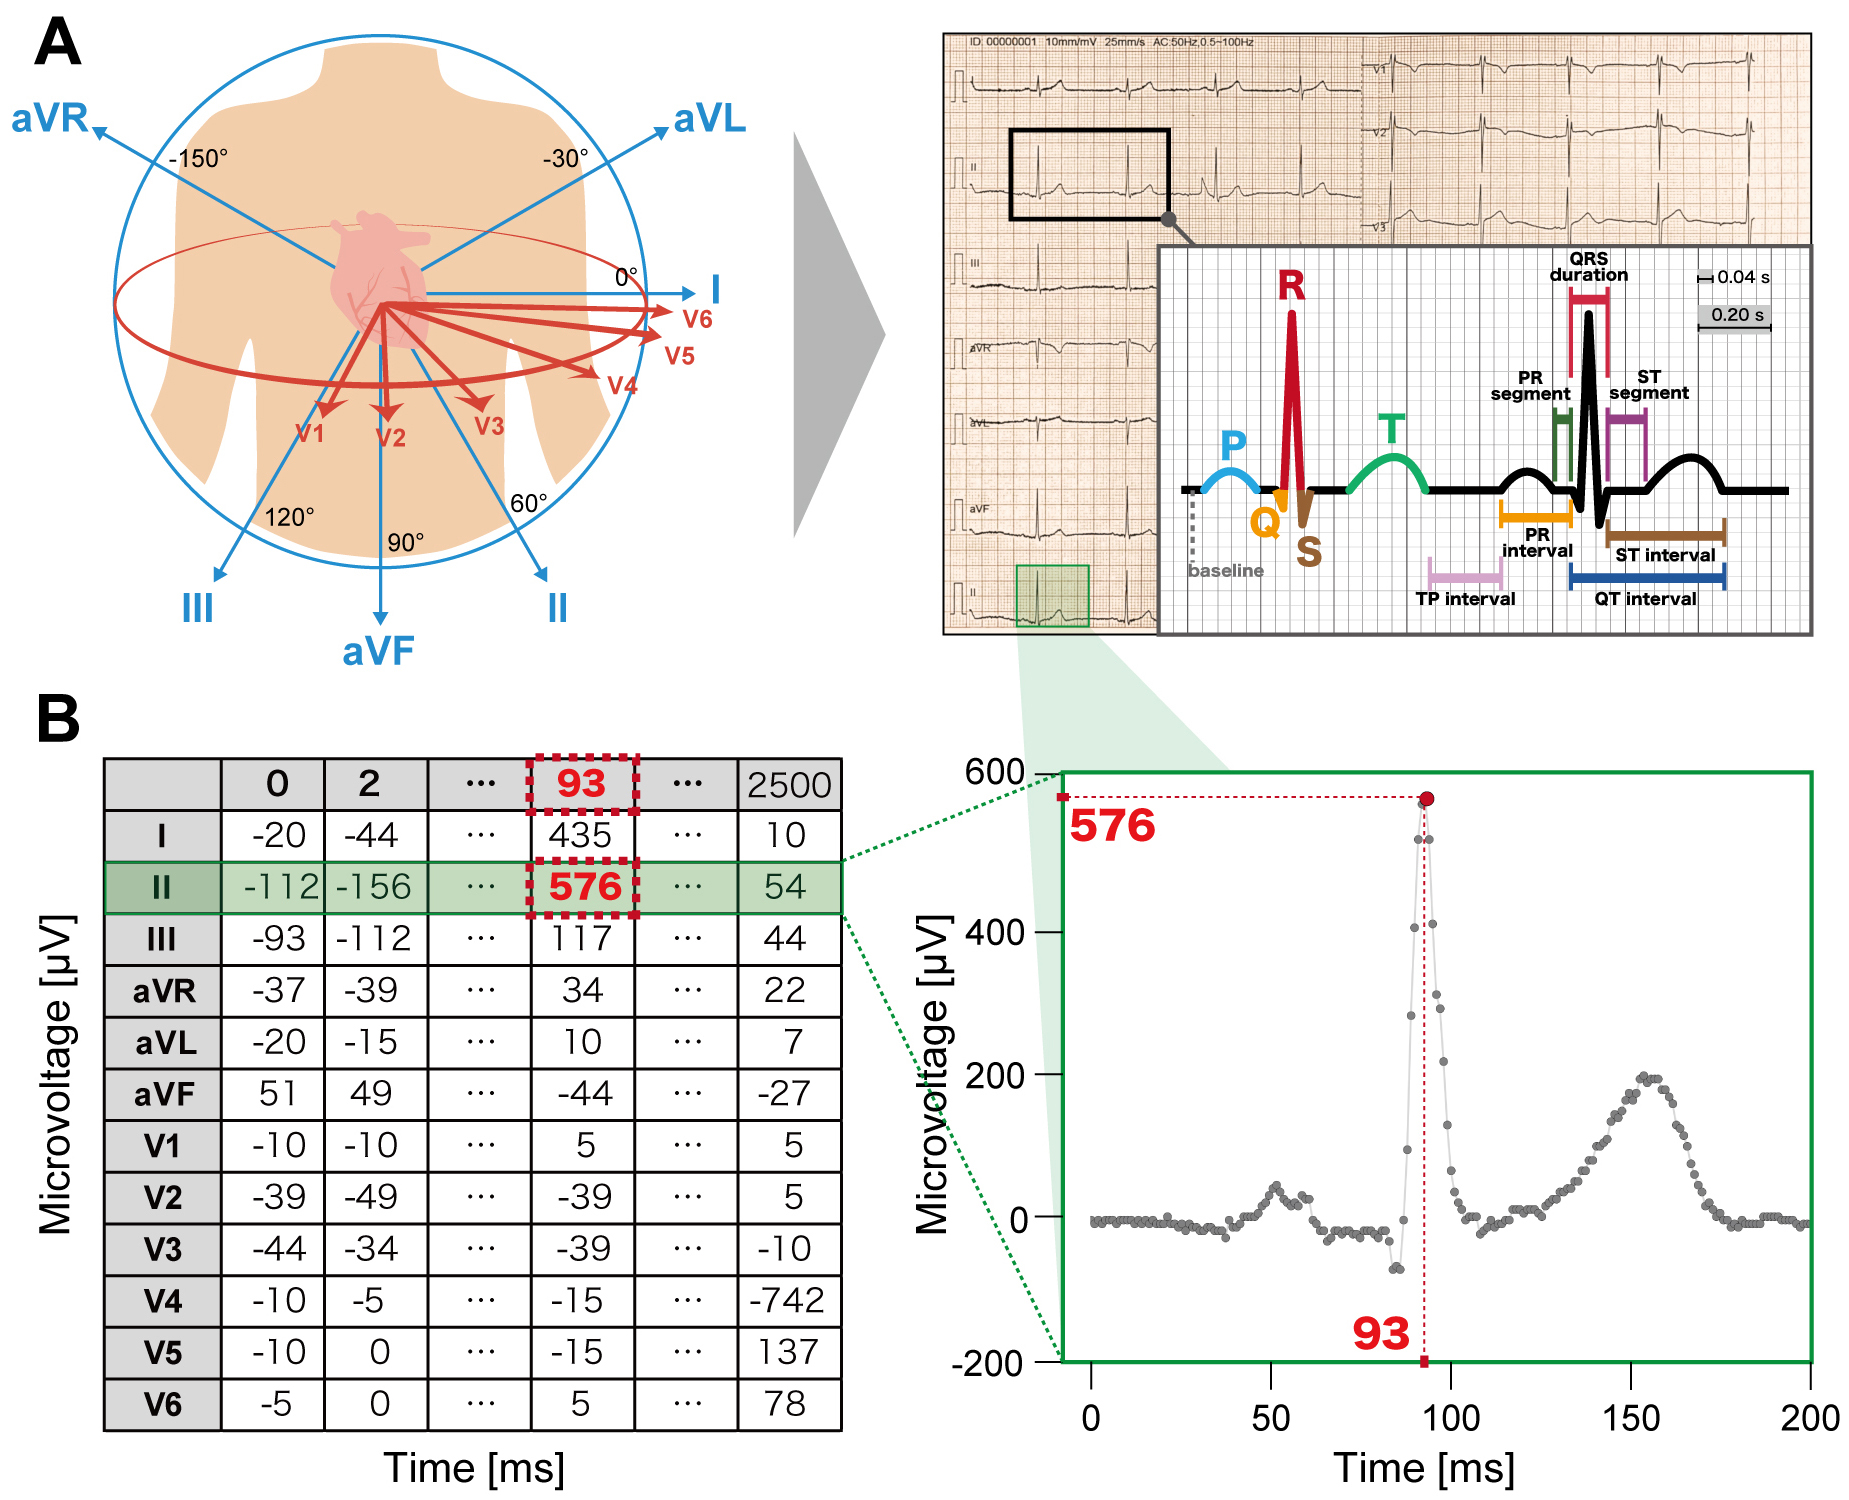
Figure 3. Comparison of echocardiogram video data as 2D and 3D arrays as inputs for DL models
The echocardiogram video is a series of frame images stacked in the time direction. While inputting frame images as a 2D array into a DL model loses the dynamic information along the time axis, a 3D array, which stacks frame images, retains both temporal and spatial dynamics as a 3D shape. DL, deep learning; CNN, convolutional neural network.
From: Deep Learning Applications in 12-lead Electrocardiogram and Echocardiogram
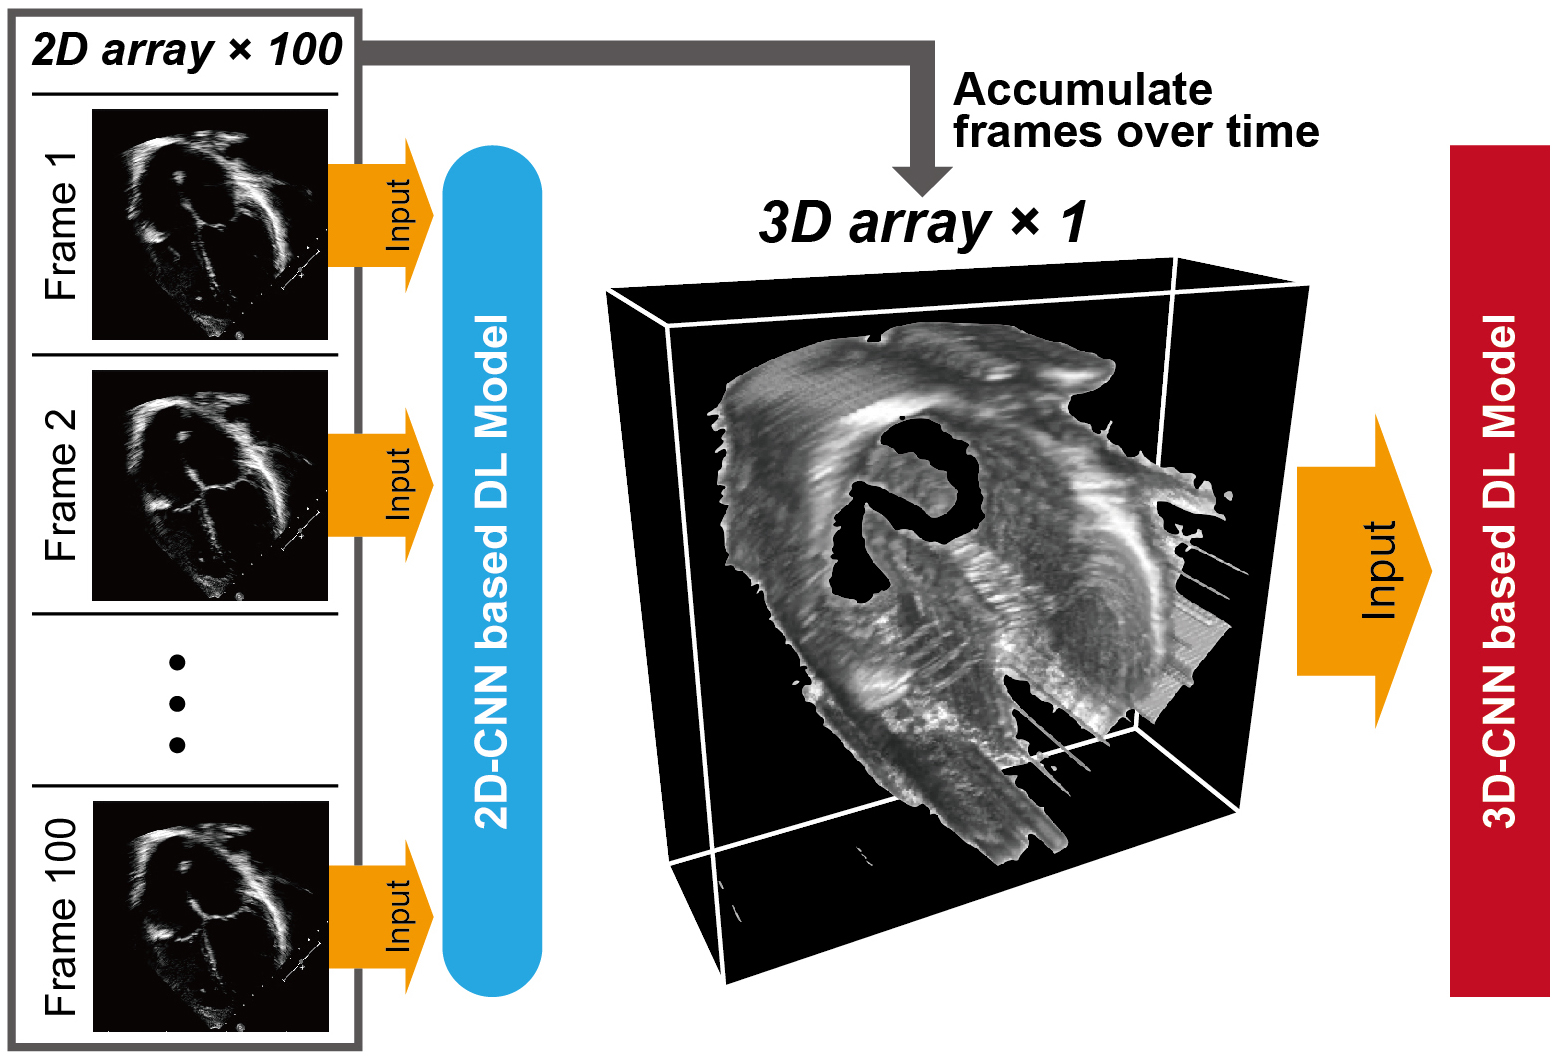
Figure 4. Schematic of federated learning
The proposed method trains a deep learning (DL) model without data sharing. The same model architectures are distributed to multiple institutions for training on local data. The trained weights, which are no longer interpretable, are sent to a central server for aggregation. The central server then sends the aggregated weights back to each institution for further training.
From: Deep Learning Applications in 12-lead Electrocardiogram and Echocardiogram
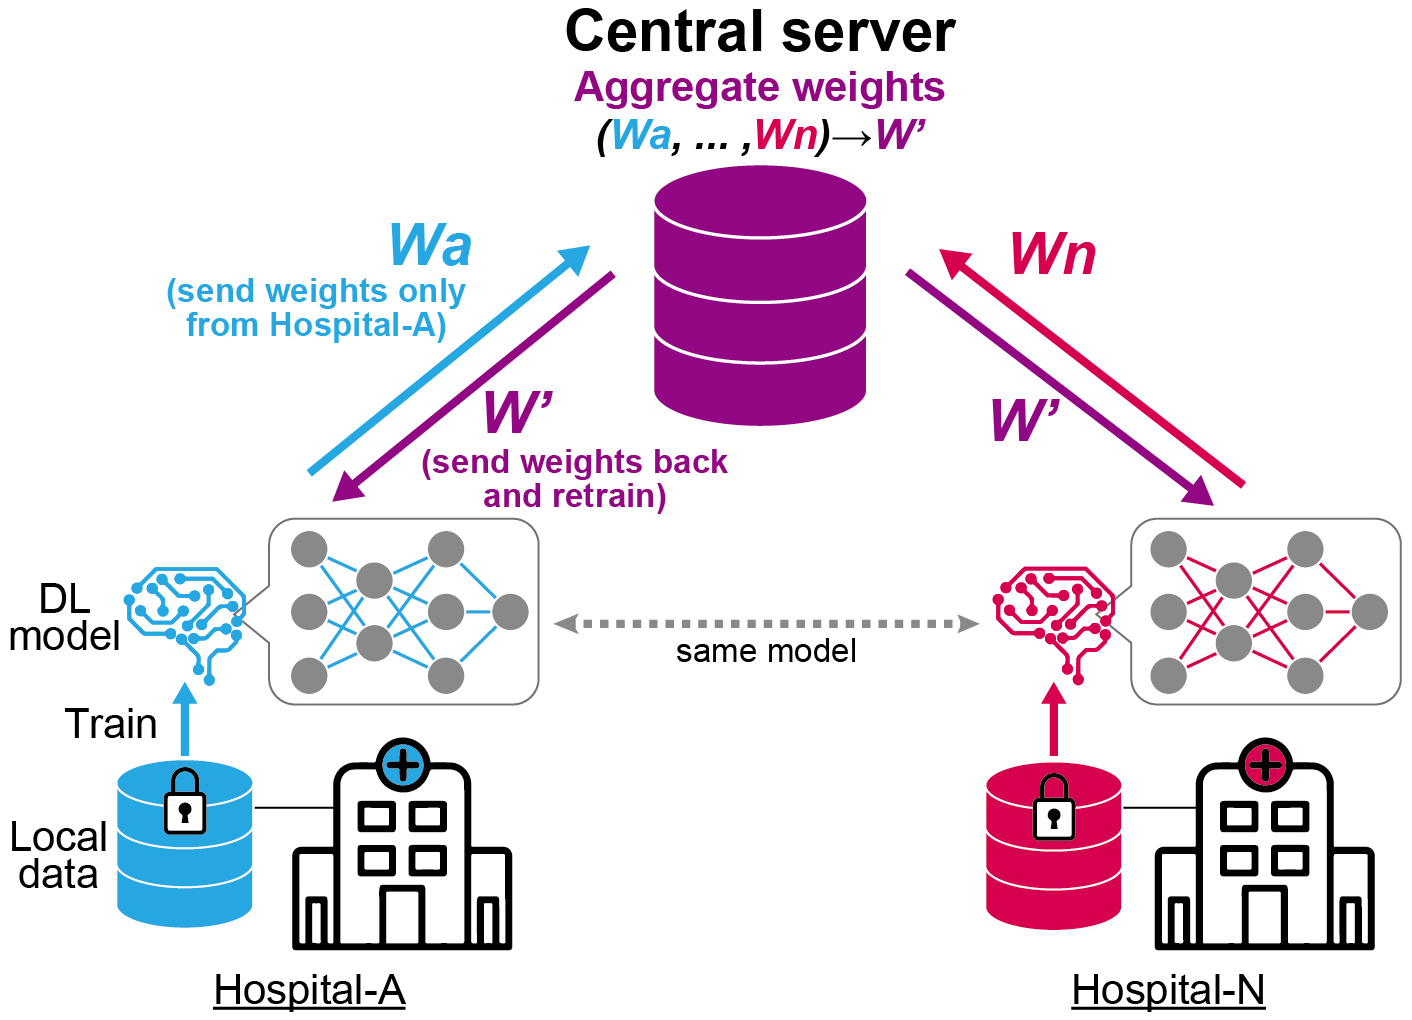
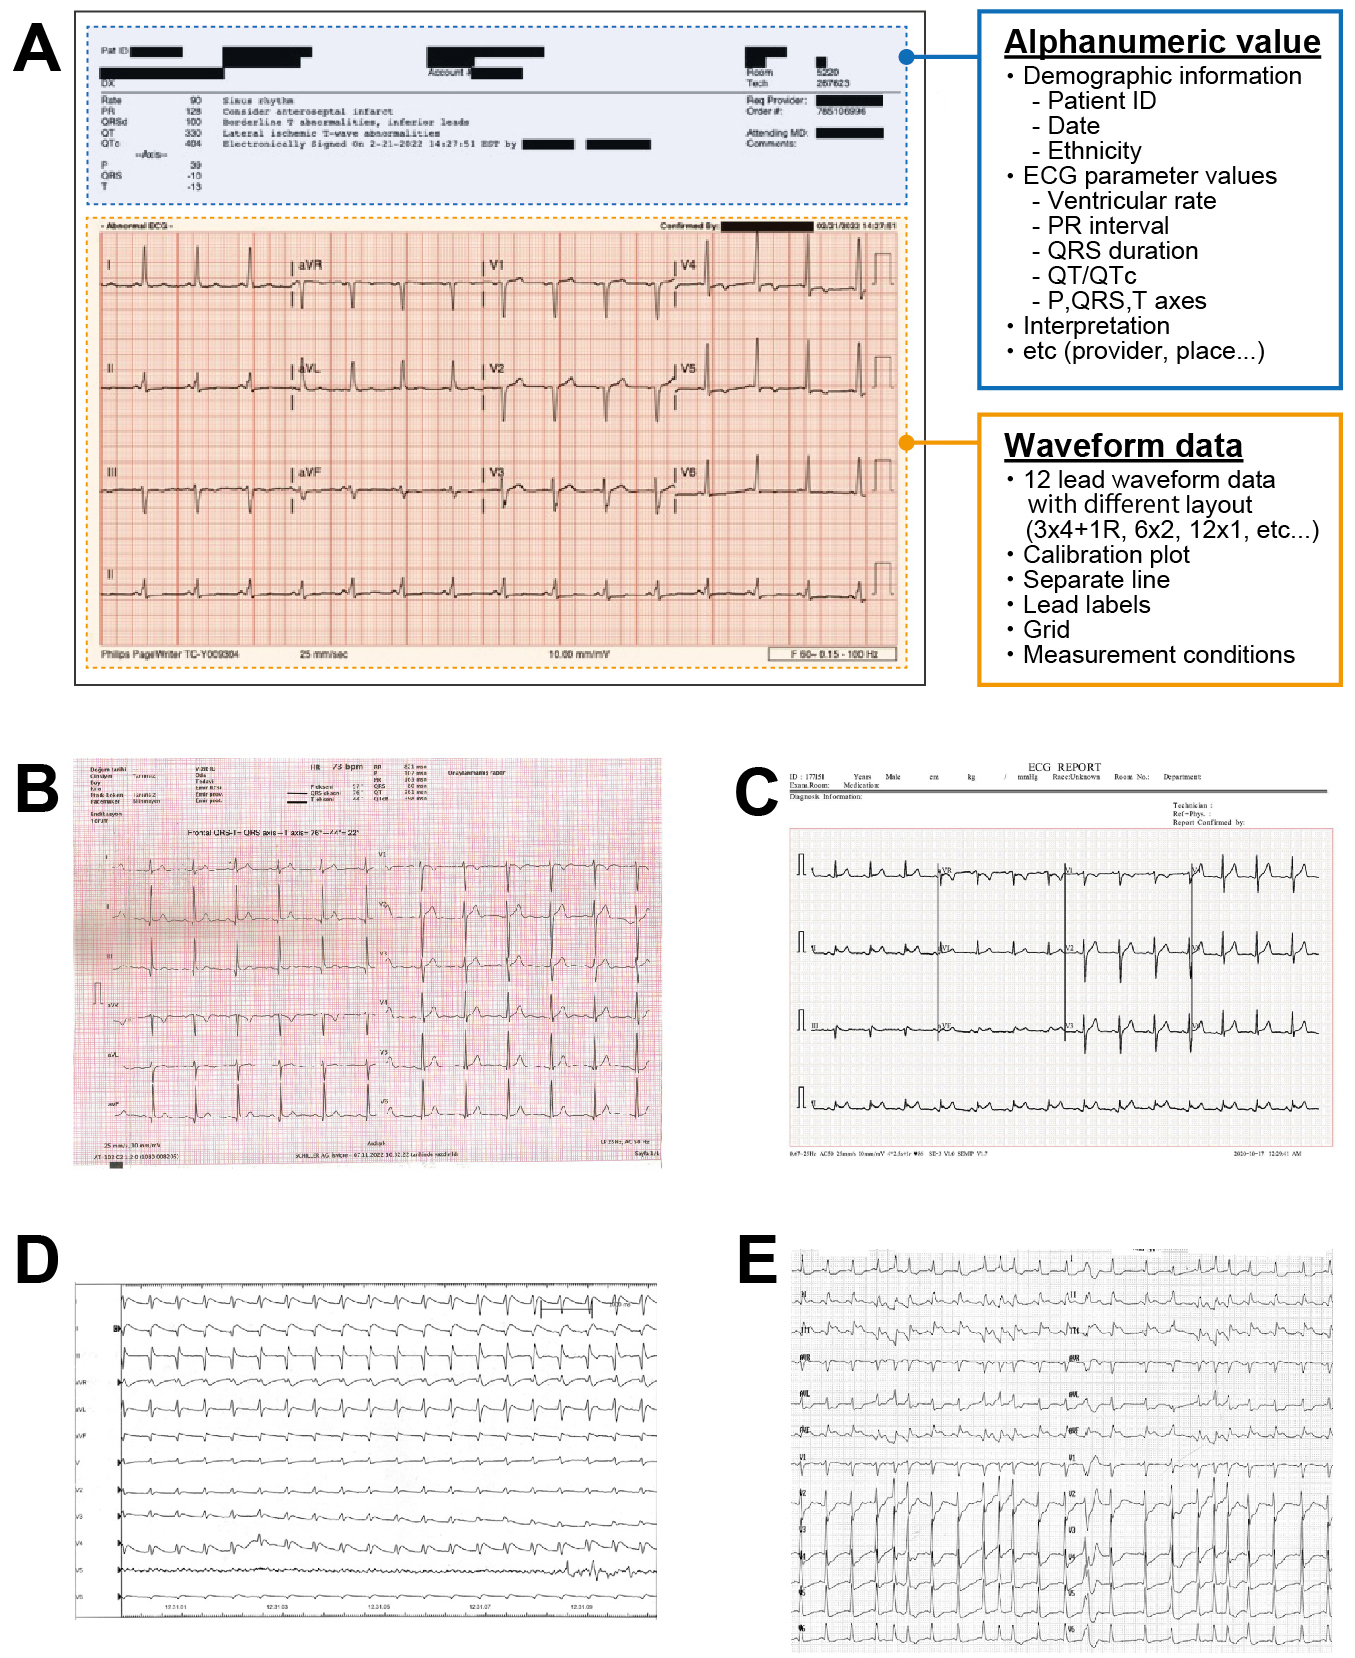
Figure 5. Schematic of ECG format variability
ECG reports are typically recorded either on paper or as electronic PDF data. The ECG format includes various pieces of information, such as patient details, time, measurements, and automatic diagnostic results. One of the most significant differences in these formats is the table layout for displaying the 12 leads, which can be arranged in formats such as 3 × 4, 6 × 2, or 12 × 1. Additionally, the formats differ in the color or thickness of the grid, size, font, and location of captions, shape and size of calibration plots, and separation between adjacent leads.
A. The ECG report is recorded as 3 × 4 + 1R with the calibration plots shown on the right.
B. The ECG report is recorded on full grid paper as 6 × 2 with a single calibration plot.
C. The ECG report is recorded as 3 × 4 + 1R with the calibration plots shown on the left.
D. The ECG is recorded as 12 × 1 without the grid and calibration plot.
E. The ECG is recorded as 12 × 2 with each of the 12 leads having two lead labels per waveform.
ECG images are from references (60), (61), (62), (63).
From: Deep Learning Applications in 12-lead Electrocardiogram and Echocardiogram