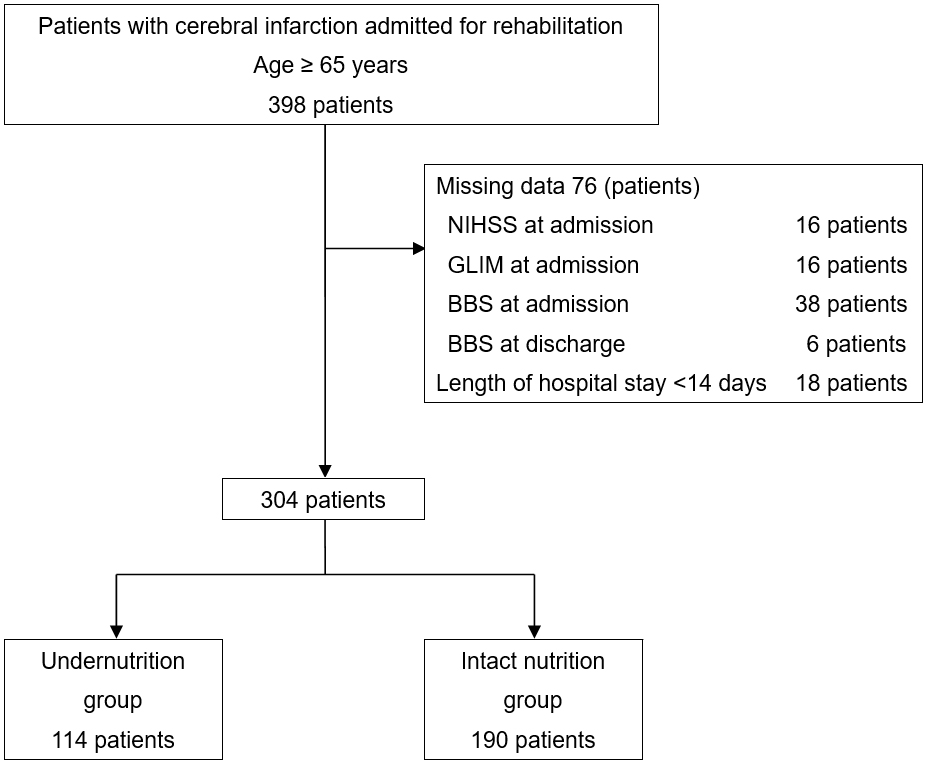
Figure 1. Patient inclusion diagram NIHSS, National Institutes of Health Stroke Scale; GLIM, Global Leadership Initiative on Malnutrition; BBS, Berg Balance Scale.
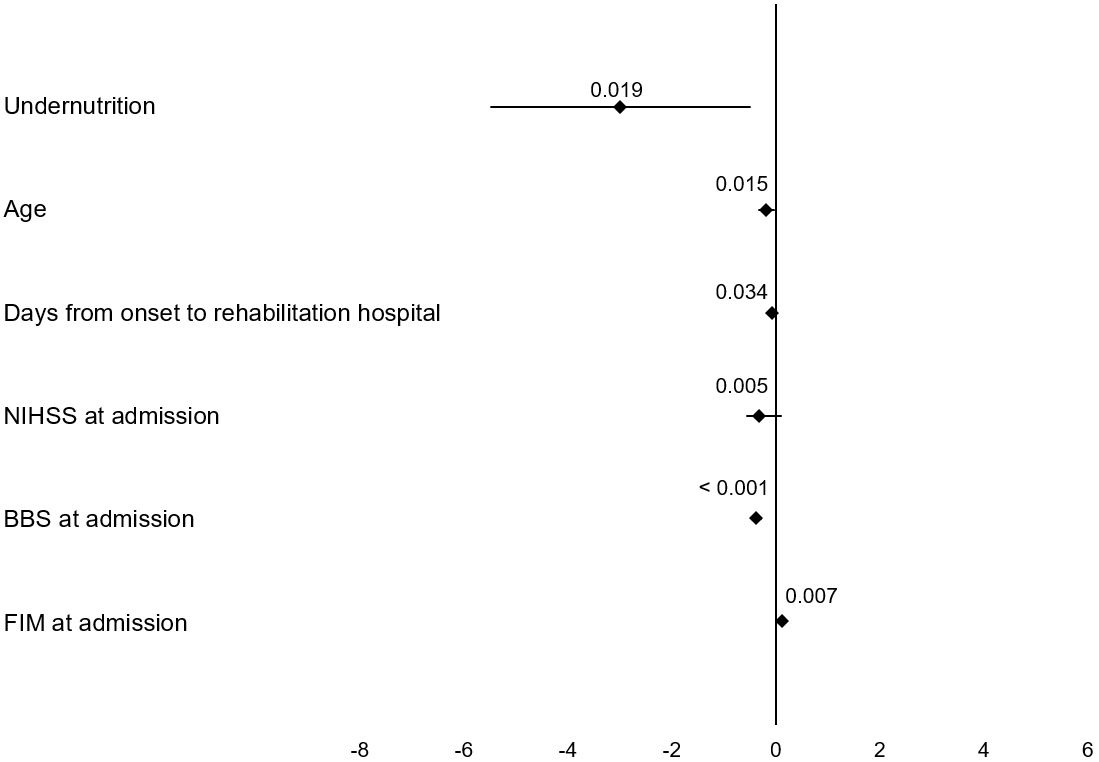
Figure 2. Multiple linear regression analyses for changes in BBS scores Undernutrition was associated with a smaller change in the BBS score (coefficient = −2.988, 95% CI = −5.481 to −0.495, p = 0.019). BBS, Berg Balance Scale; NIHSS, National Institutes of Health Stroke Scale; FIM, Functional Independence Measure.