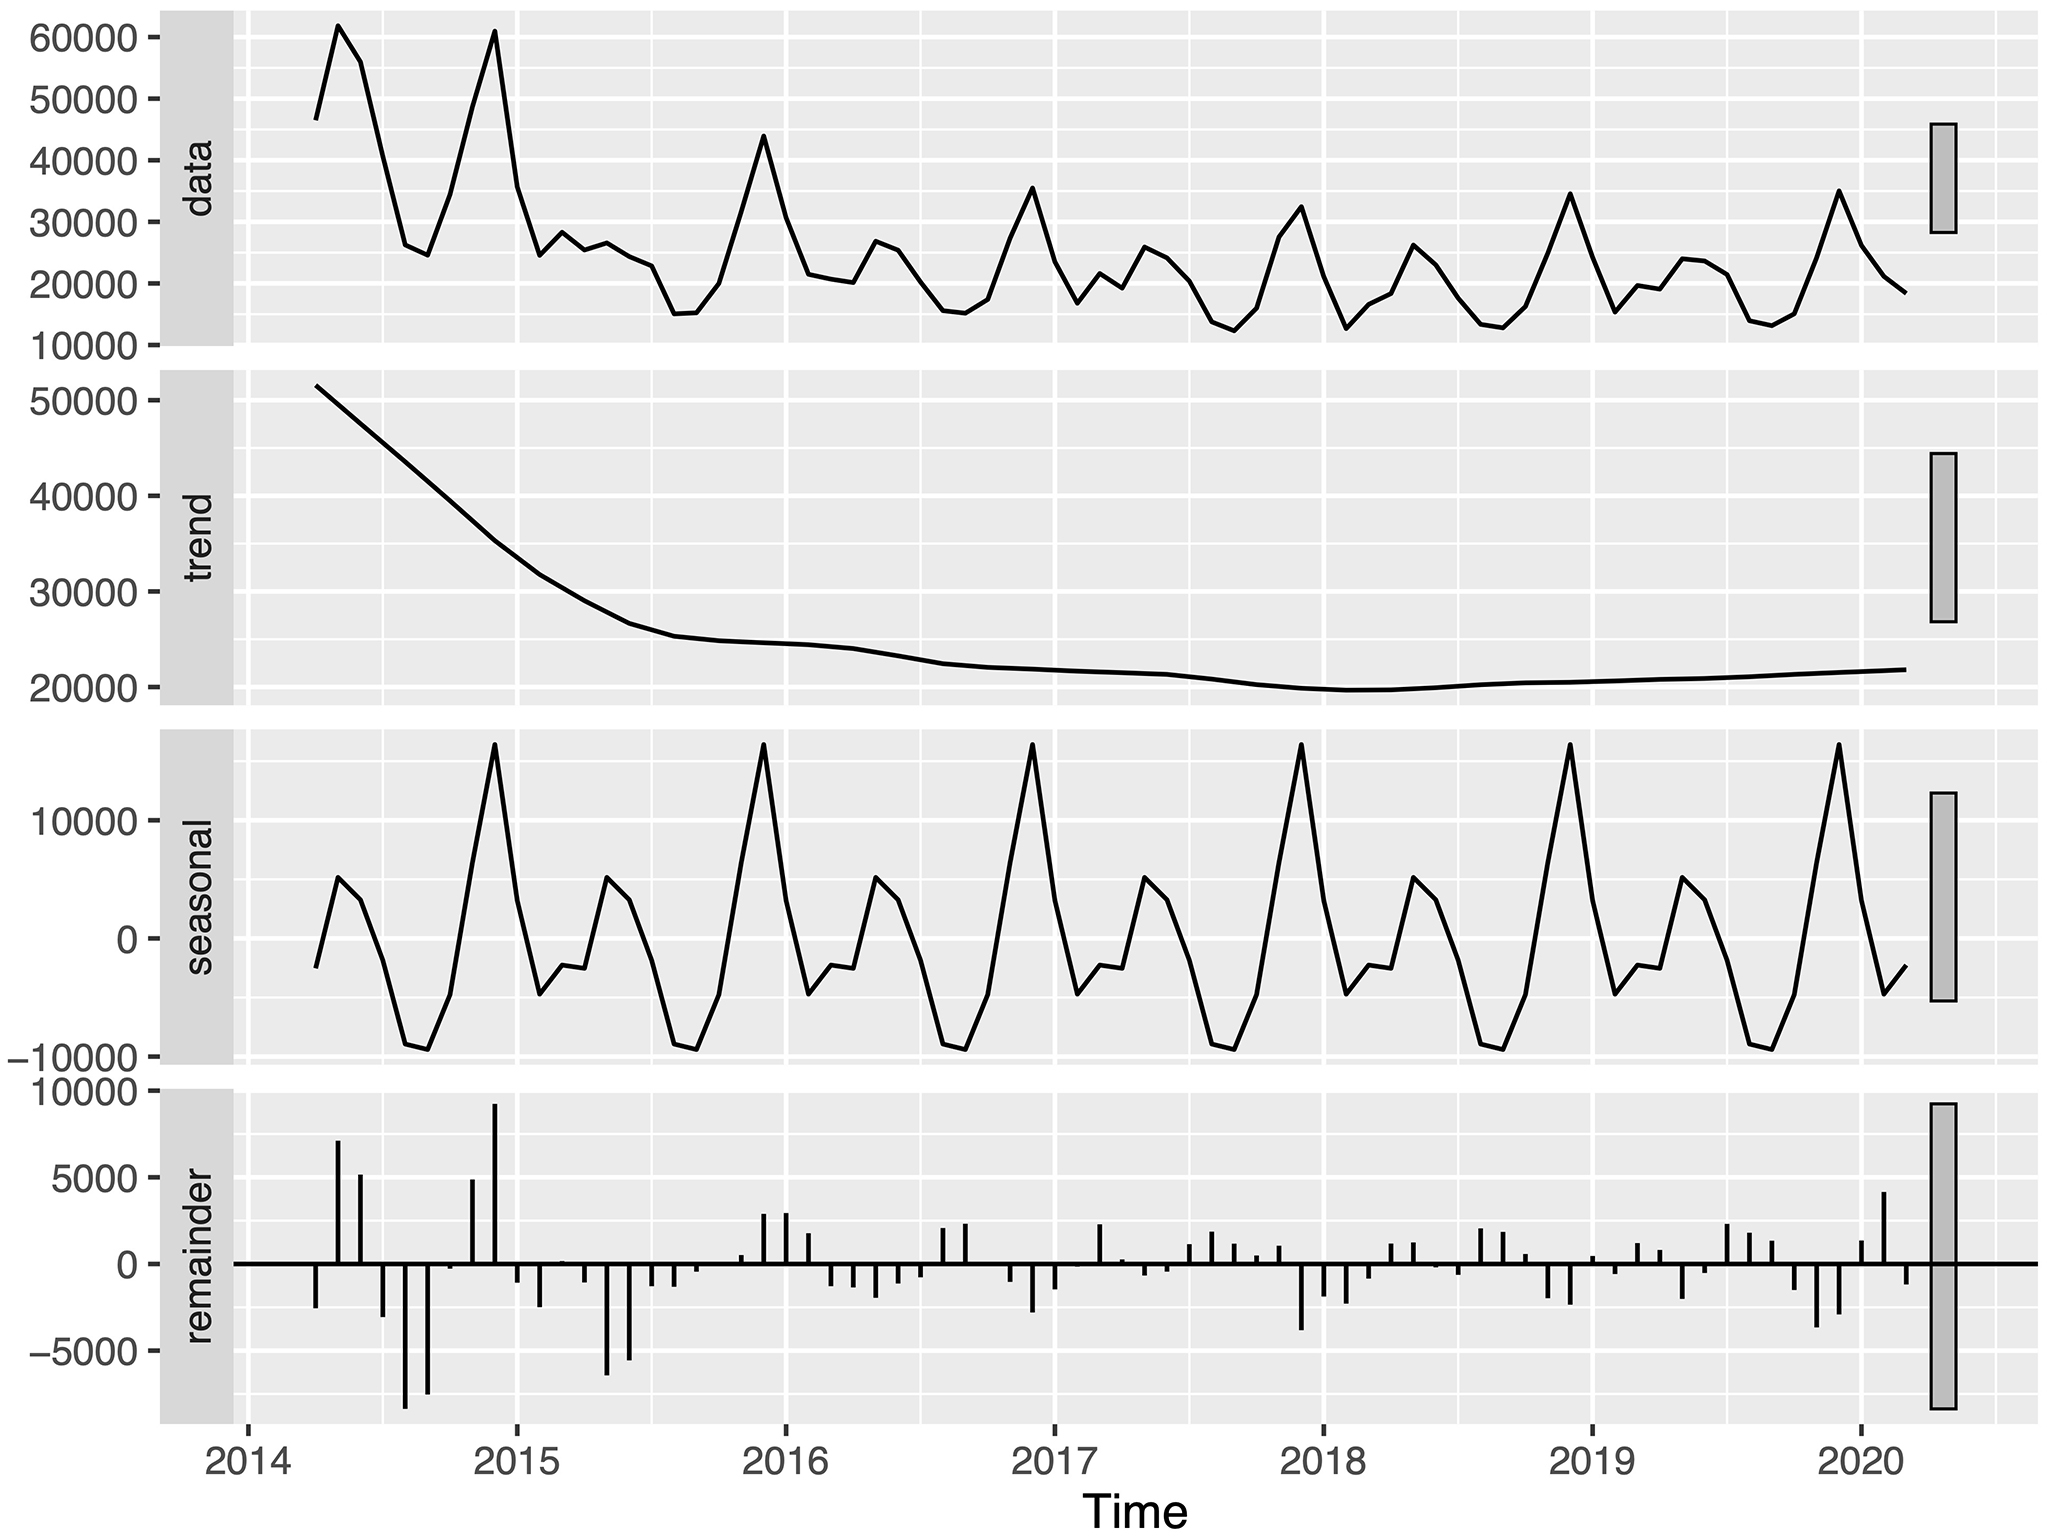
Figure 1. Monthly number of cellulitis diagnoses during fiscal years 2014 to 2019. The top panel shows the original time series data before seasonal decomposition of time series by locally estimated scatterplot smoothing (STL). The subsequent panels show the trend component, seasonal component, and remainder component obtained from STL analysis, respectively.
STL: seasonal decomposition of time series by locally estimated scatterplot smoothing.
From: Seasonality and Trend of Cellulitis, Herpes Zoster, and Varicella: A Nationwide Population-based Study
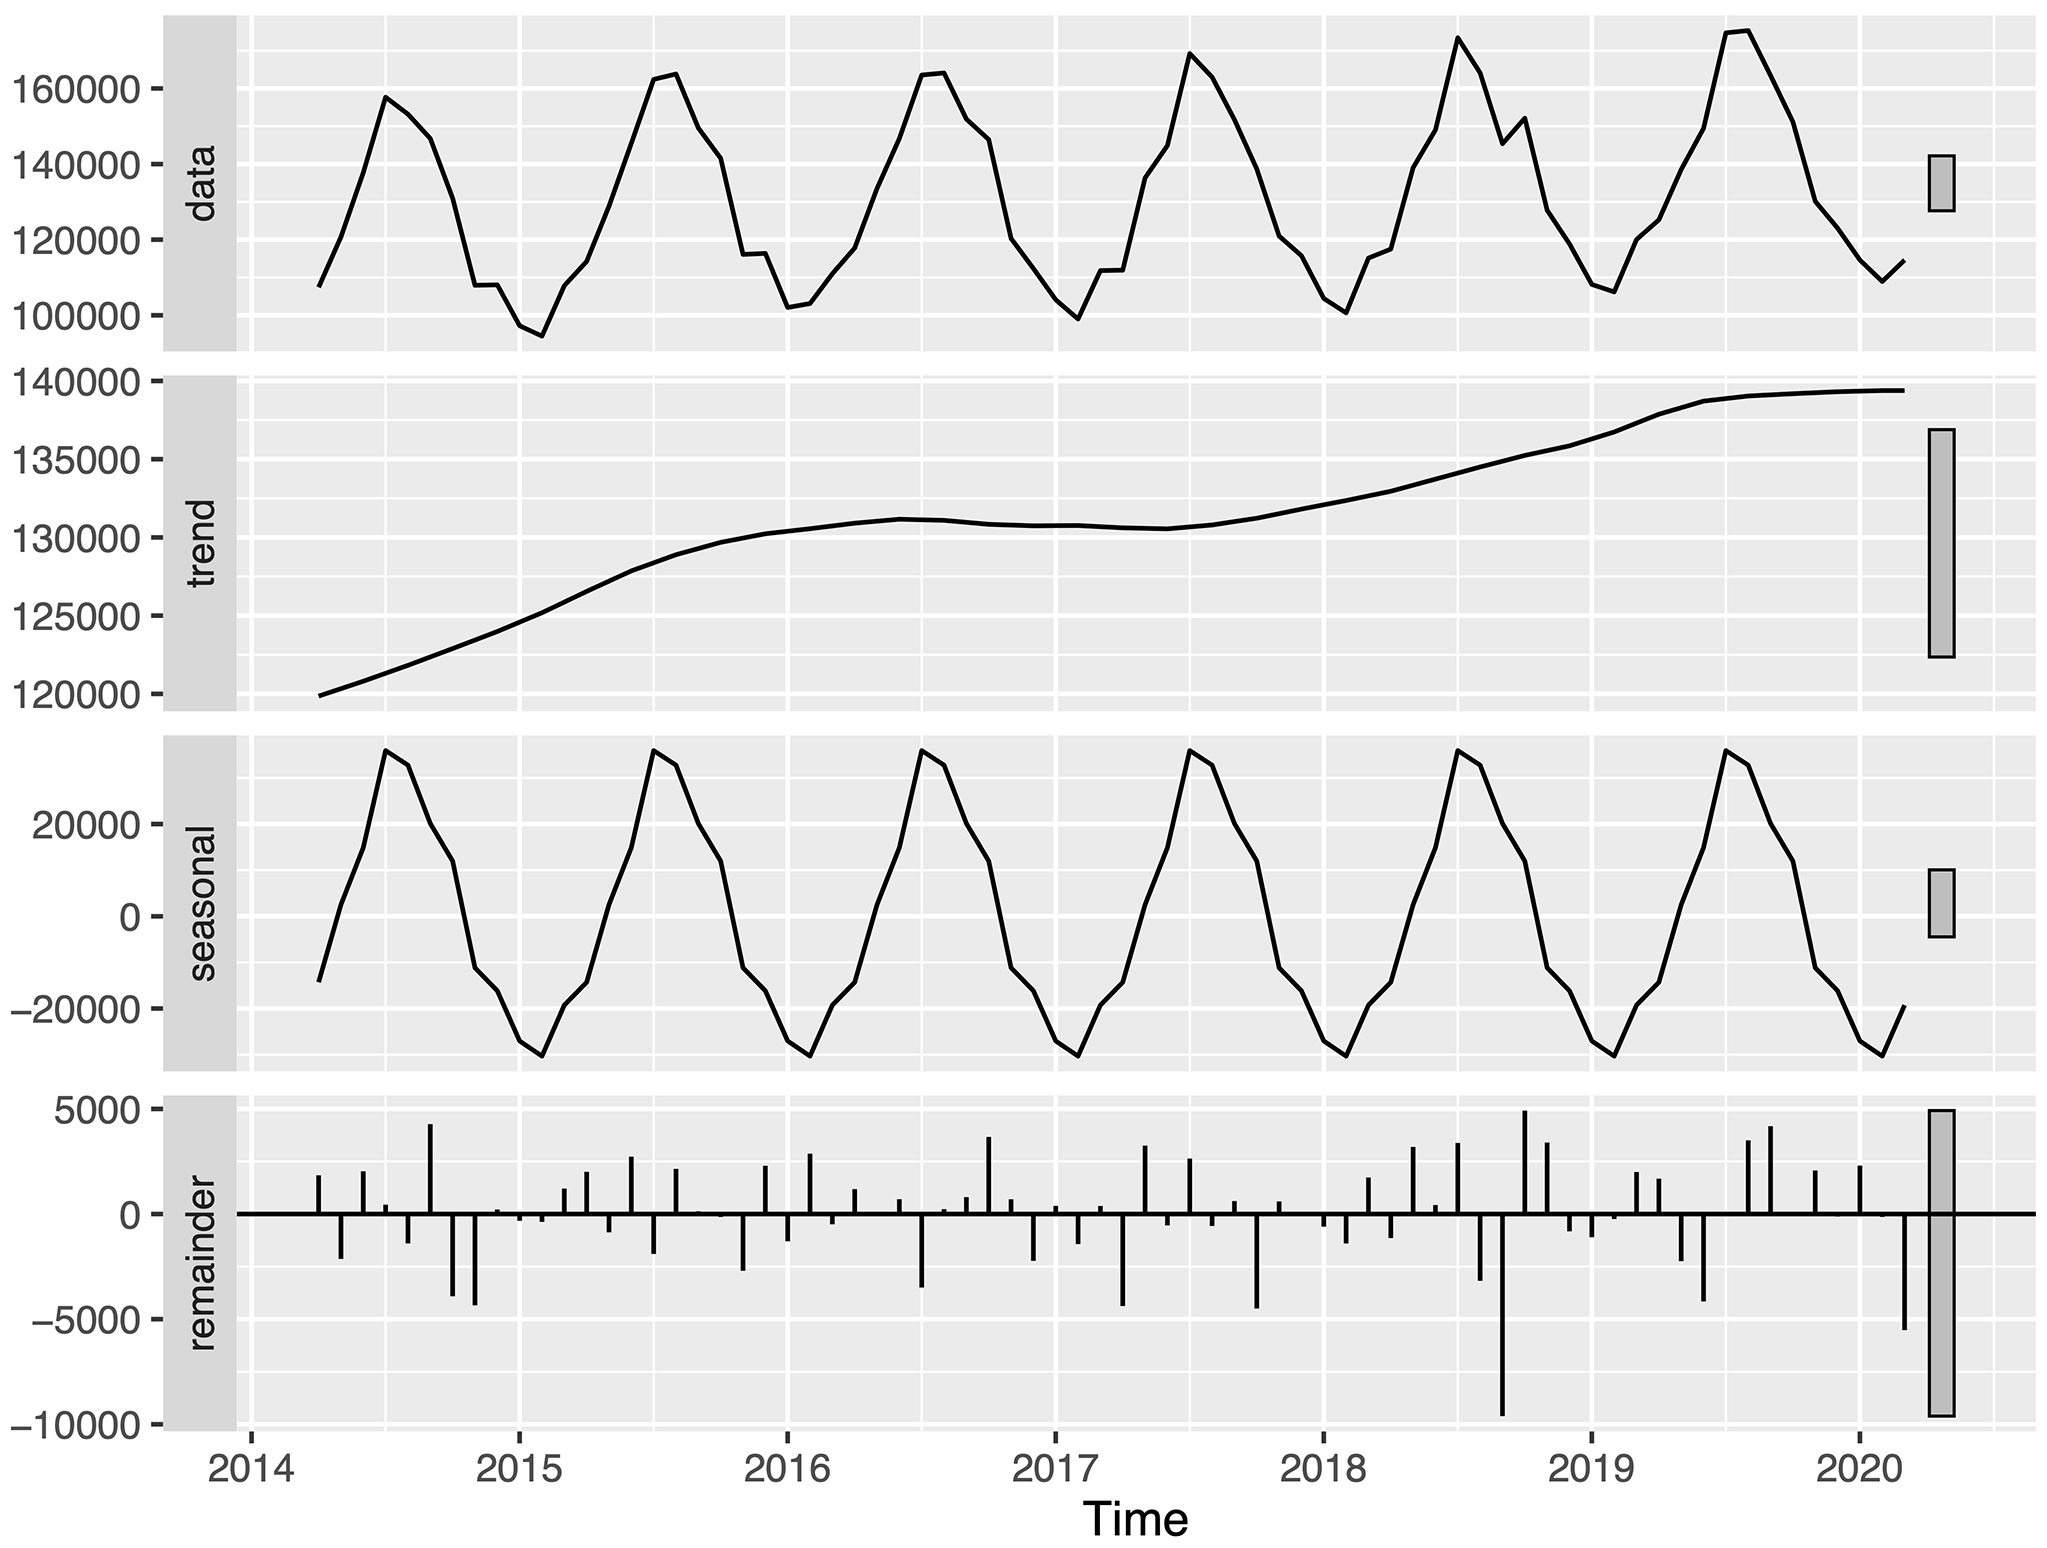
Figure 2. Monthly number of herpes zoster diagnoses during fiscal years 2014 to 2019. The top panel shows the original time series data before seasonal decomposition of time series by locally estimated scatterplot smoothing (STL). The subsequent panels show the trend component, seasonal component, and remainder component obtained from STL analysis, respectively.
STL: seasonal decomposition of time series by locally estimated scatterplot smoothing.
From: Seasonality and Trend of Cellulitis, Herpes Zoster, and Varicella: A Nationwide Population-based Study
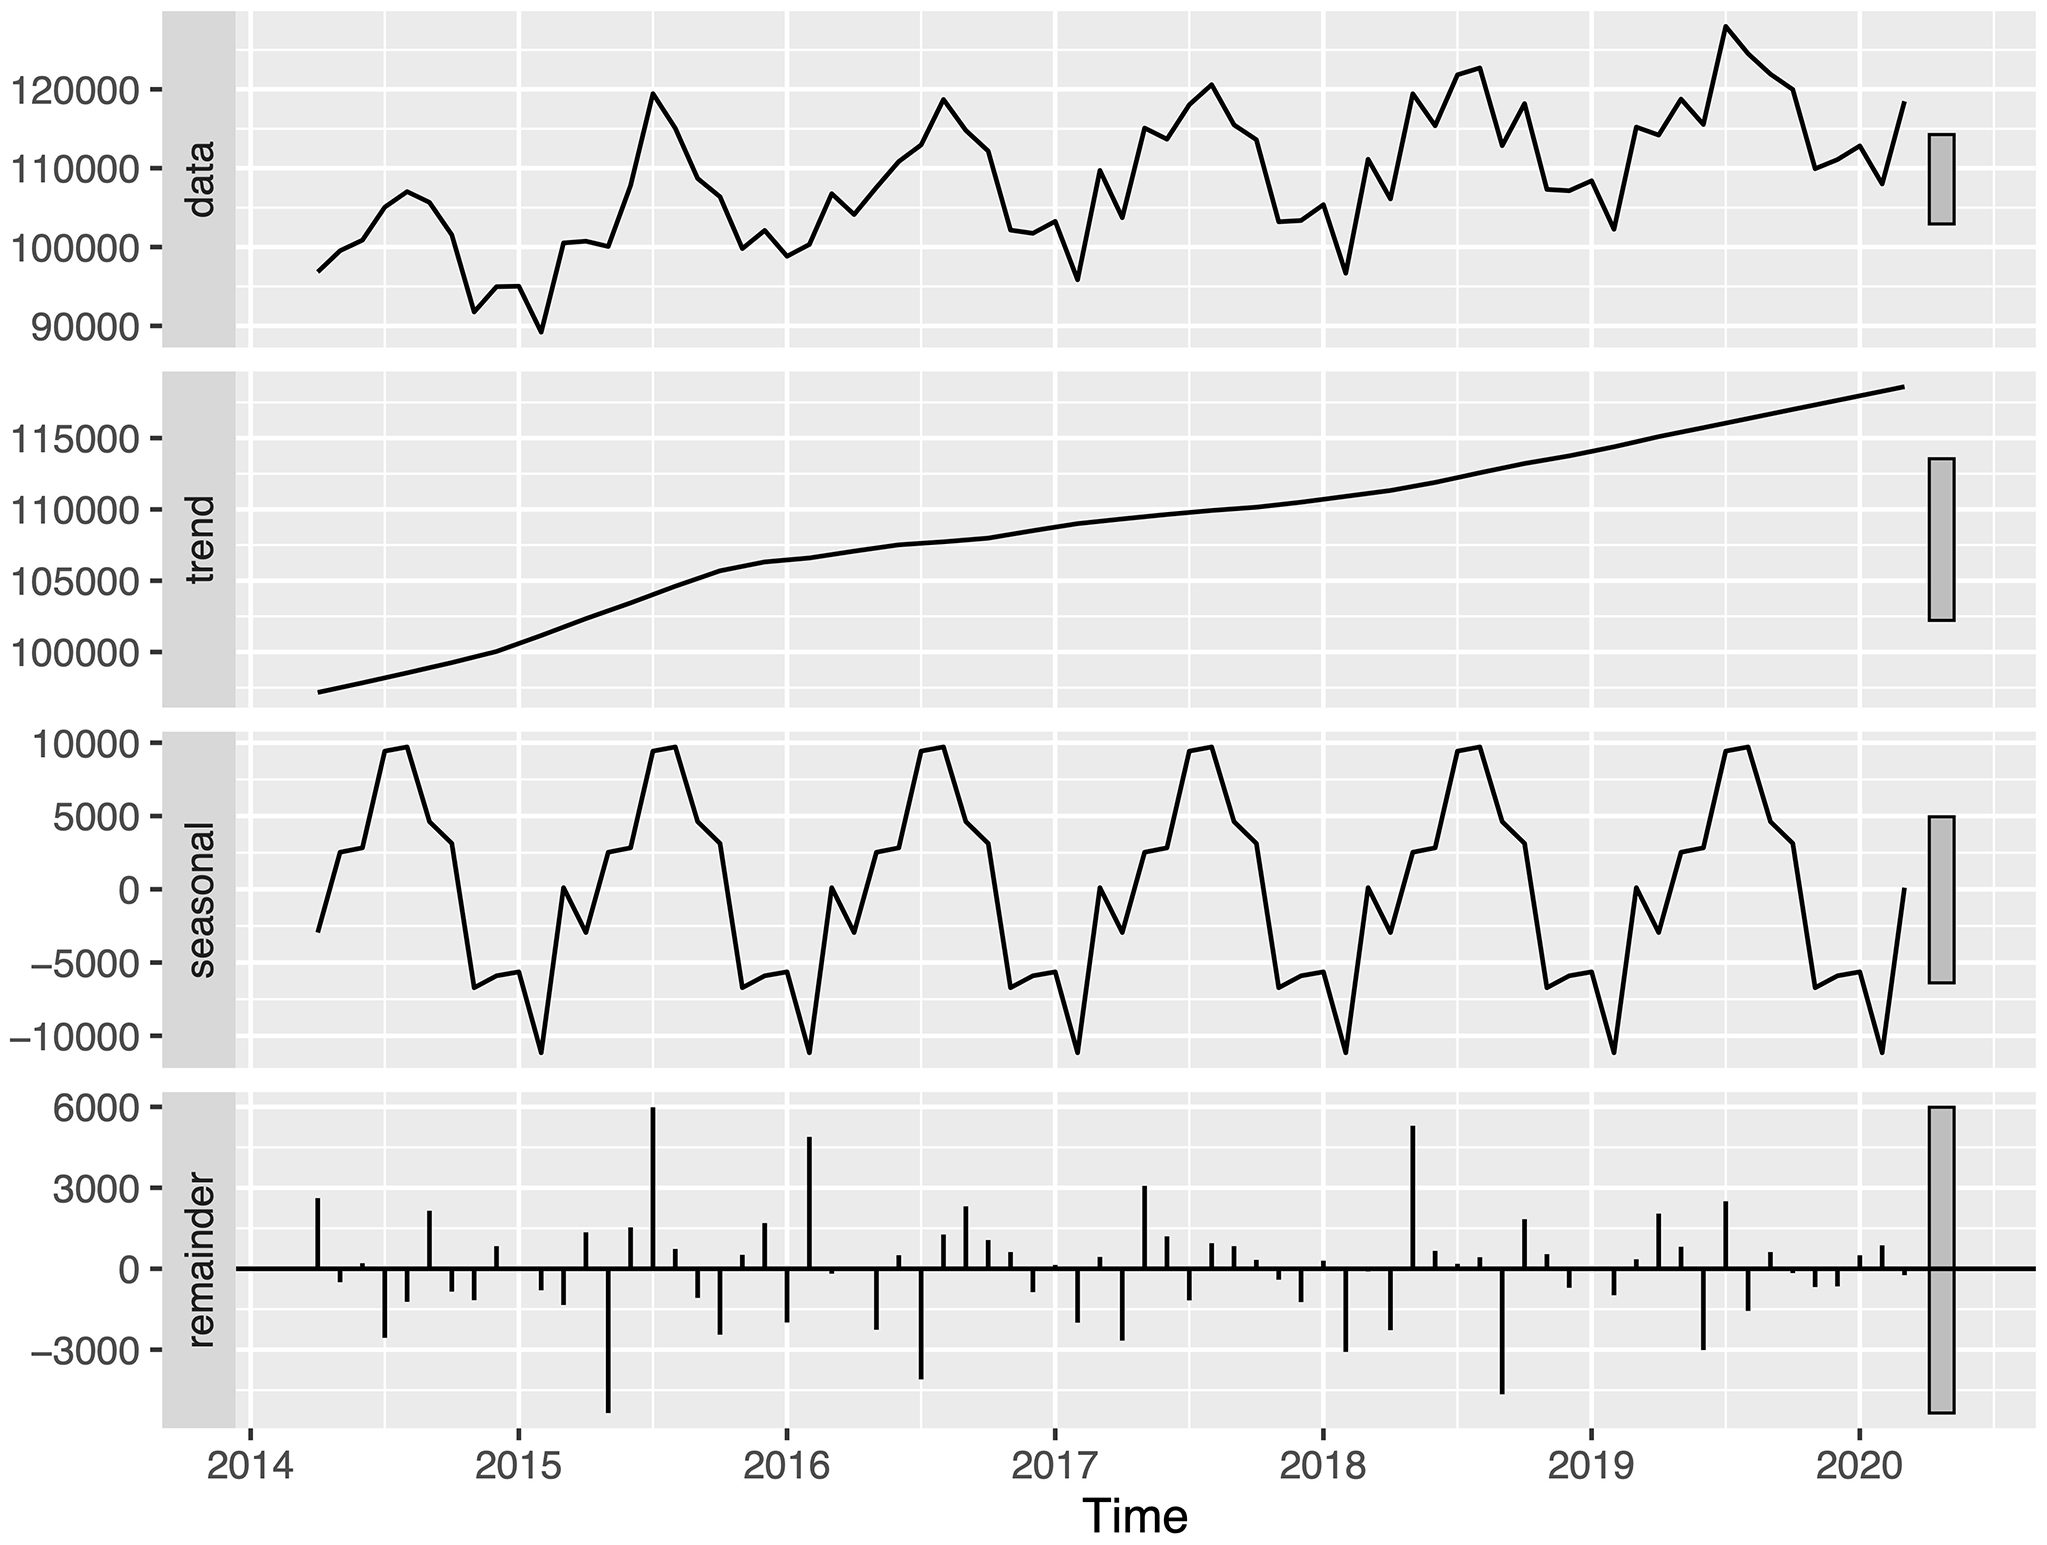
Figure 3. Monthly number of varicella diagnoses during fiscal years 2014 to 2019. The top panel shows the original time series data before seasonal decomposition of time series by locally estimated scatterplot smoothing (STL). The subsequent panels show the trend component, seasonal component, and remainder component obtained from STL analysis, respectively.
STL: seasonal decomposition of time series by locally estimated scatterplot smoothing.
From: Seasonality and Trend of Cellulitis, Herpes Zoster, and Varicella: A Nationwide Population-based Study