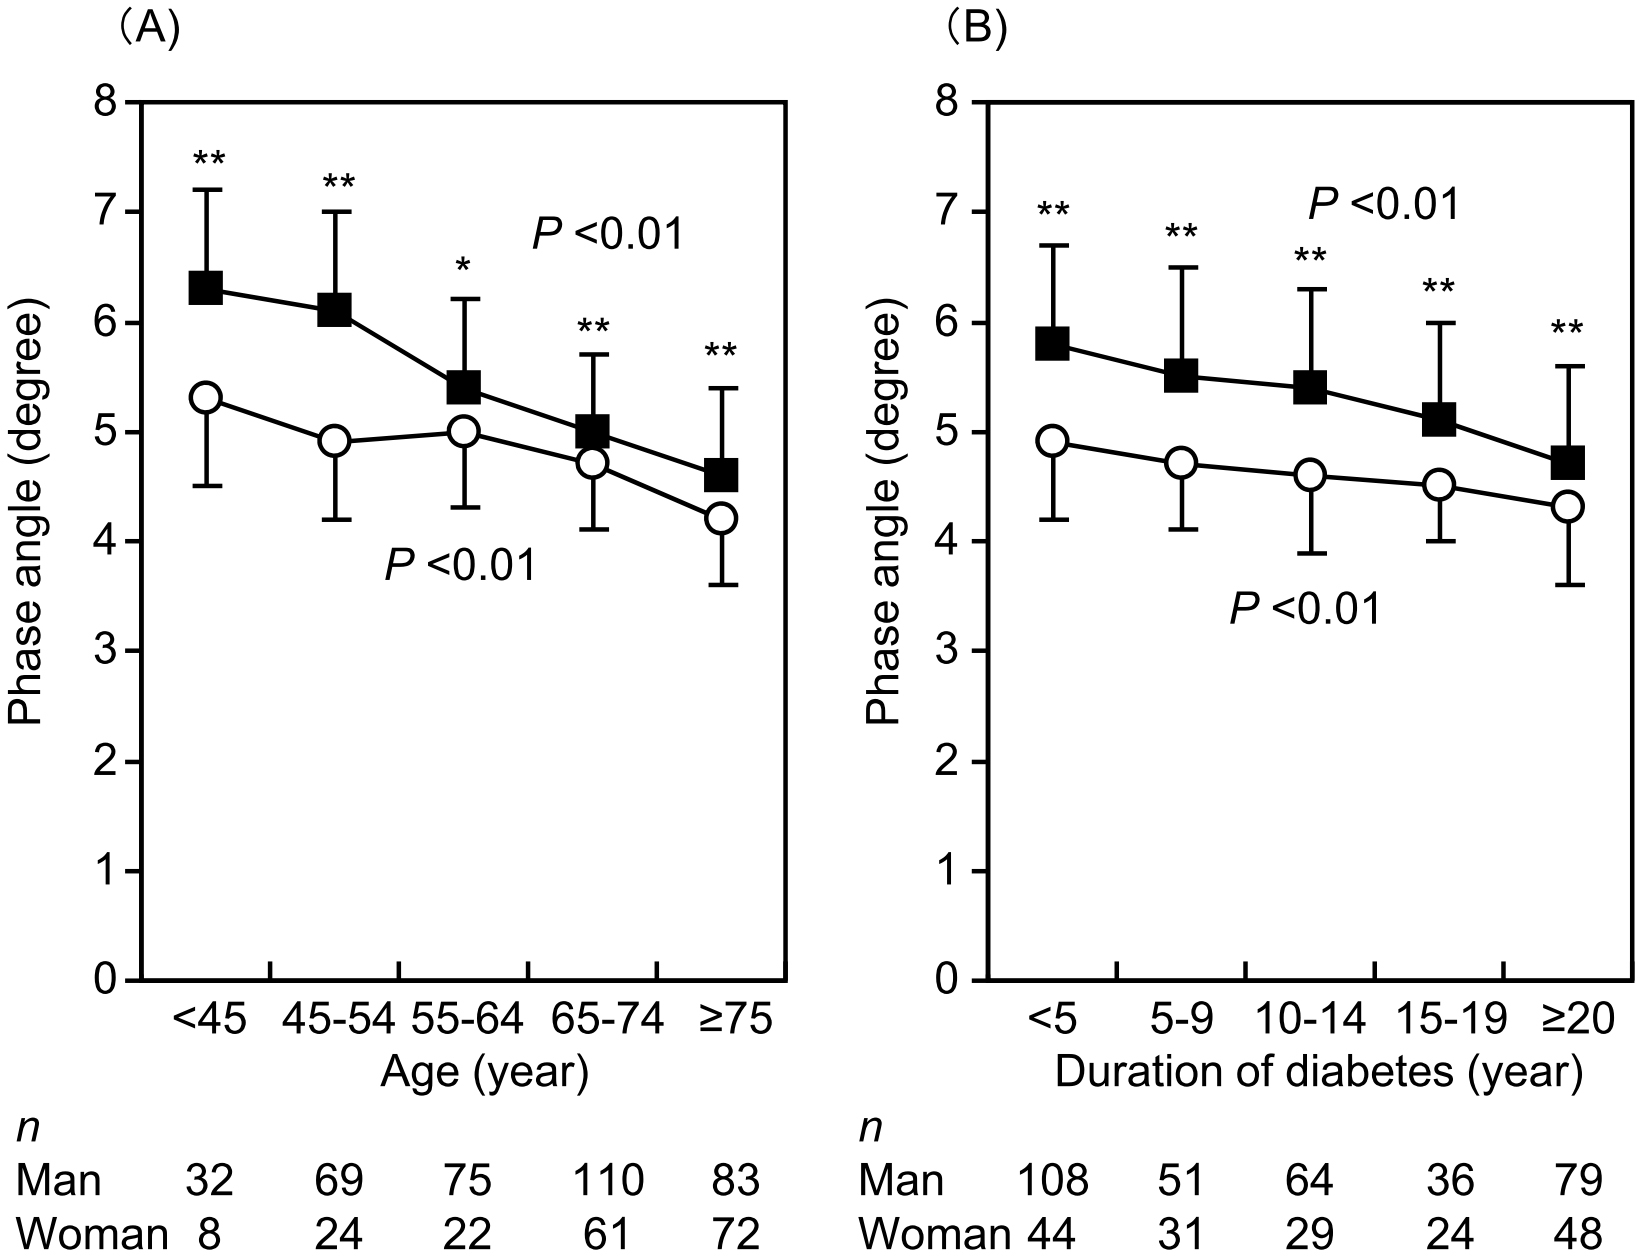
Figure 1. Phase angles according to age (A) and duration of diabetes (B). PhA significantly decreased with increasing age and duration of diabetes in both males and females, (P<0.01, respectively, Jonckheere-Terpstra test). Closed squares and open circles indicate males and females, respectively. **p <0.01 and *p <0.05 vs. female (Wilcoxon’s rank-sum test).
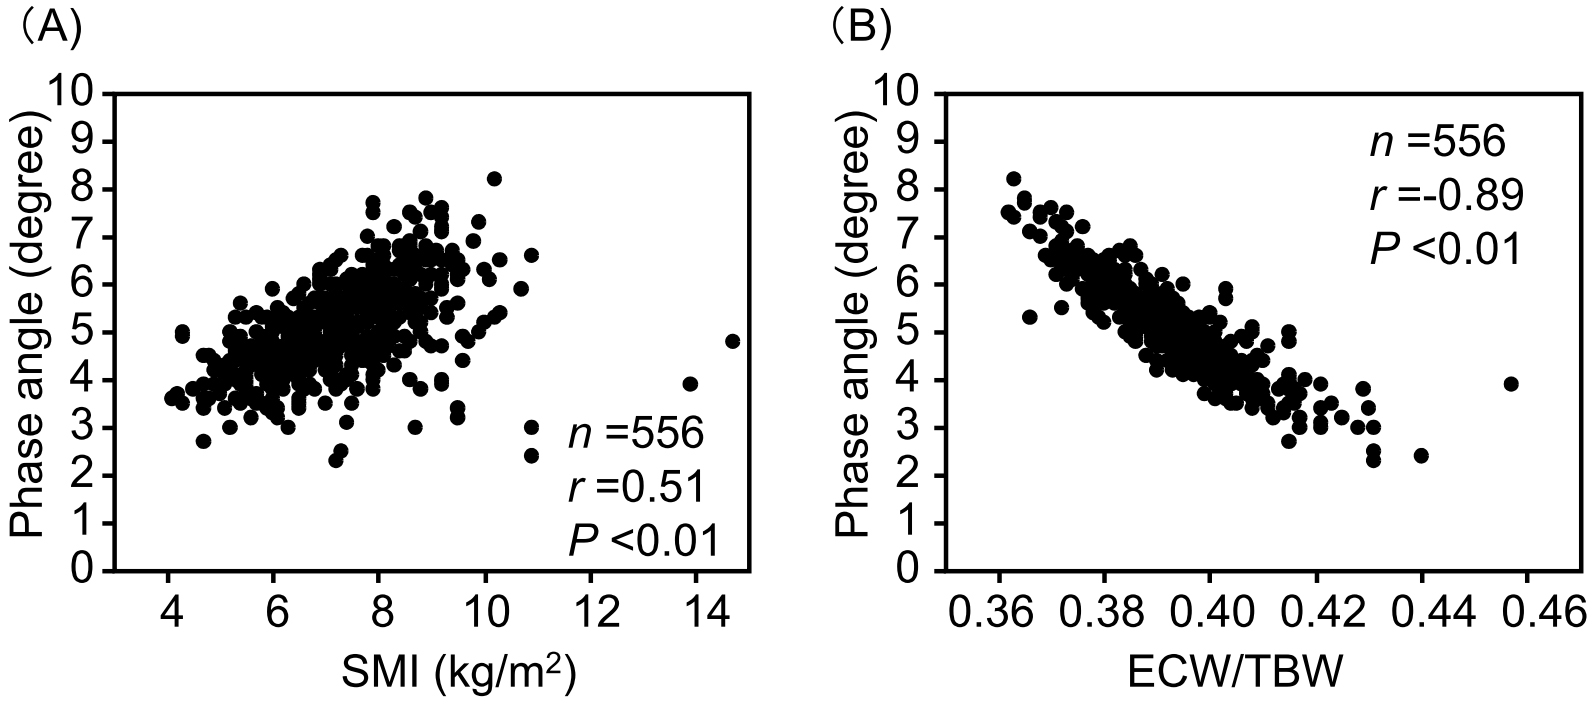
Figure 3. Relationships between the SMI (A) and ECW/TBW (B) and the phase angle. ECW/TBW, extracellular water-to-total body water ratio; SMI, skeletal muscle index.