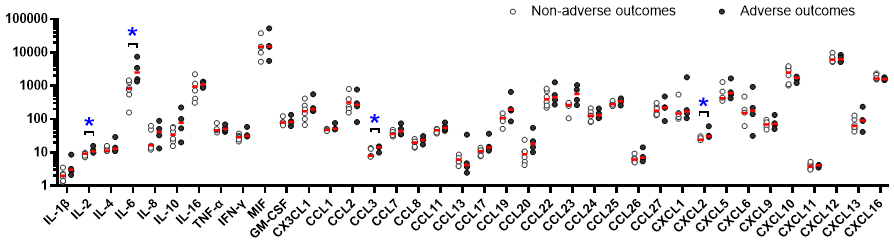
Figure 2. Logarithmic distribution of levels of 38 cytokines in fetal pleural effusion. Data are presented as a scatterplots with median values. CCL, chemokine ligand; IL, interleukin.
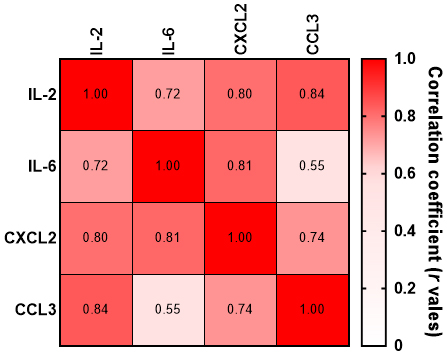
Figure 3. Correlation matrix heat map showing Spearman’s r value for the correlation between each cytokine pair. CCL, chemokine ligand; IL, interleukin.