Figure 2. Cross-validation plot of mean squared error corresponding to smoothing parameter λ with one standard error. Cross-validation plot of mean squared error corresponding to smoothing parameter λ with standard errors. λSE, the largest λ among λ for which the cross-validation function is within one standard error of the minimum of the cross-validation function (λ = 0.003); λCV, λ where the cross-validation function is minimum (λ = 0.000011)
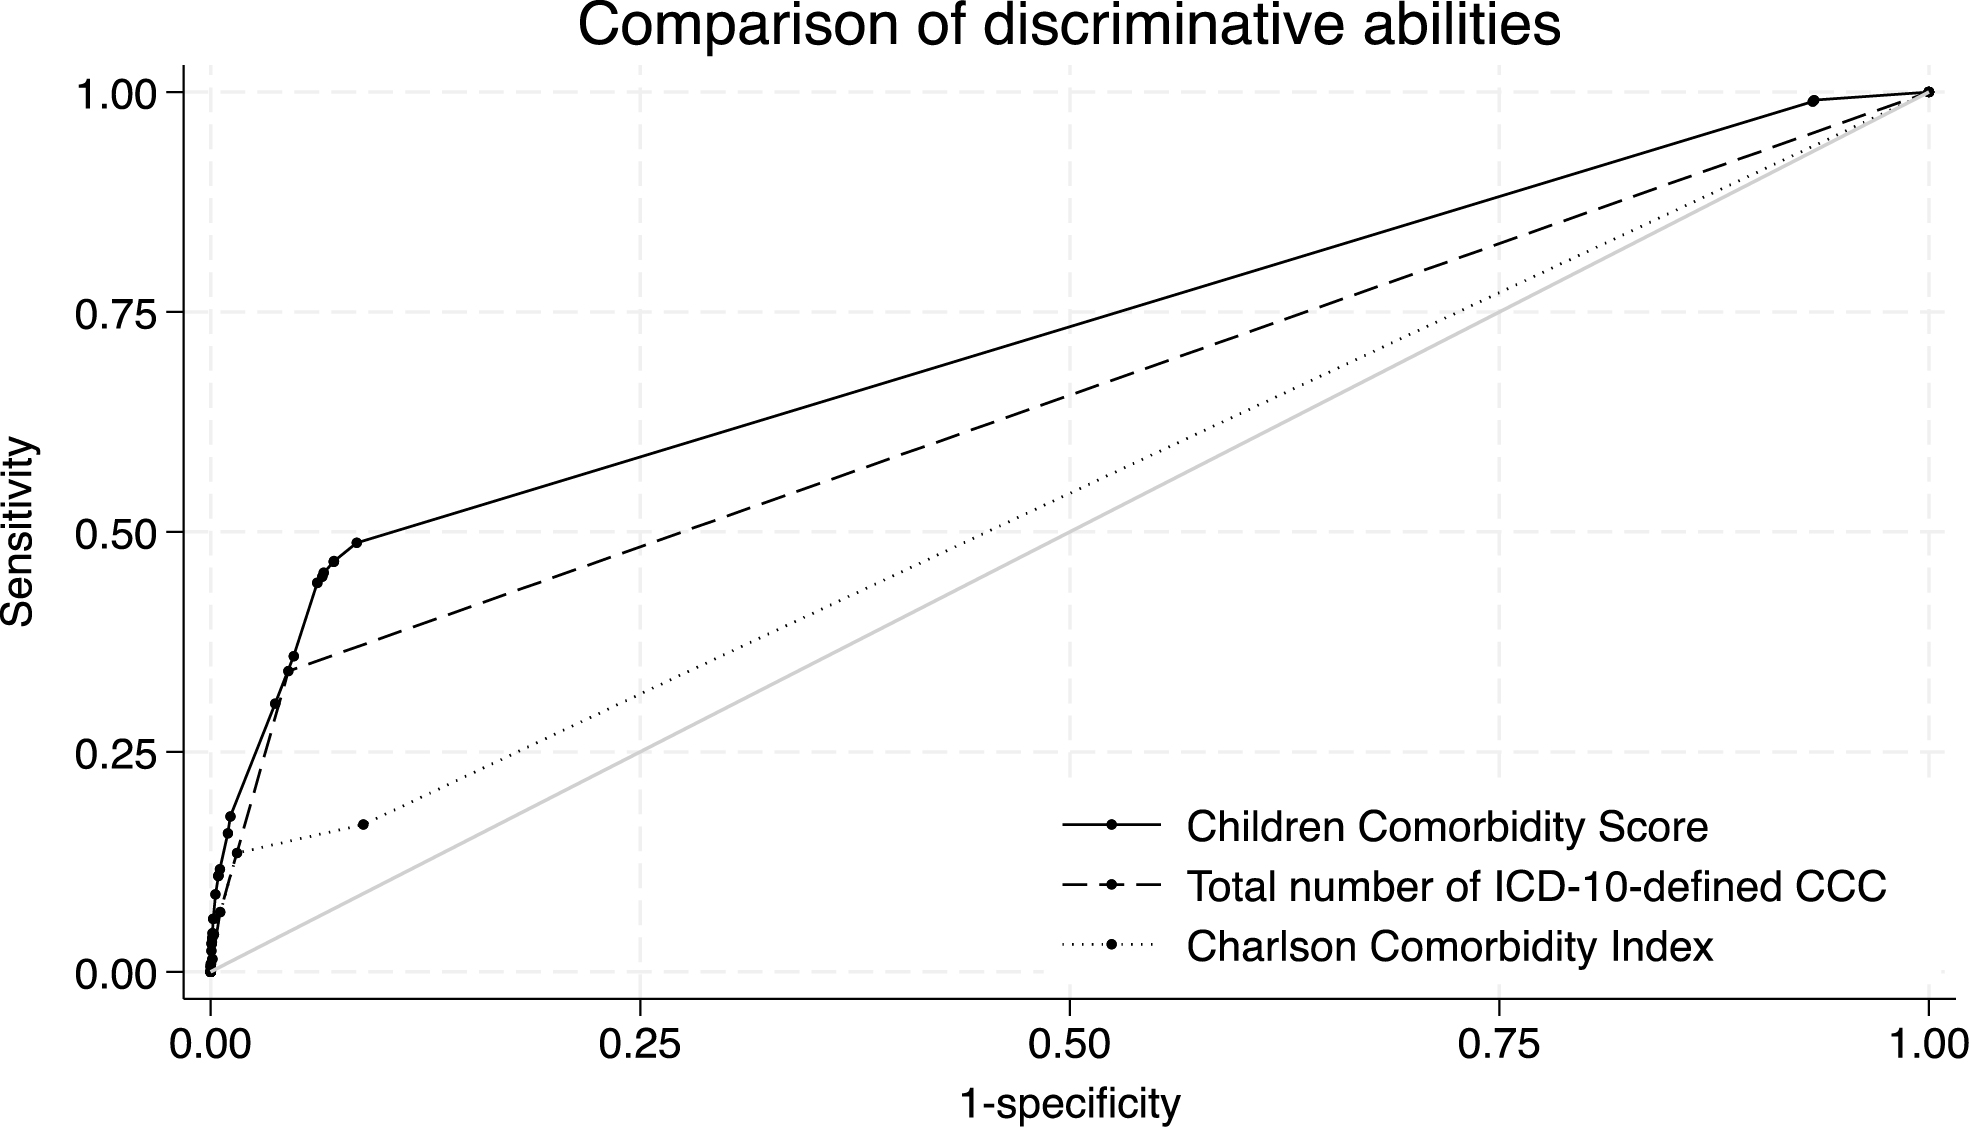
Figure 3. Predictive performance of the developed model (Children Comorbidity Score) and reference models for in-hospital mortality. Predictive performance of the developed Children Comorbidity Score, total number of ICD-10-defined CCC, and Charlson Comorbidity Index. The receiver operating curves for predicting in-hospital mortality in the validation cohort are shown. The corresponding area under the curve values for each model are listed in Table 3.