Figure 2. The intracardiac electrocardiograms during atrial tachycardia (AT)/atrial flutter (AFL) (A). Overdrive endocardial pacing using a circular mapping catheter or ablation catheter at the left atrial (LA) posterior wall (B), anterior wall (C), LA roof (D), and LA floor (E) resulted in acceleration of the AT/AFL to the pacing cycle length (CL) and concealed intracardiac entrainment (B-E). Post-pacing interval and CL at each site corresponded. Termination of AT/AFL during the delivery of radiofrequency energy (F).
From: Roof-dependent Macro-reentrant Left Atrial Flutter Masked by Probable Epicardial Conduction via the Septopulmonary Bundle
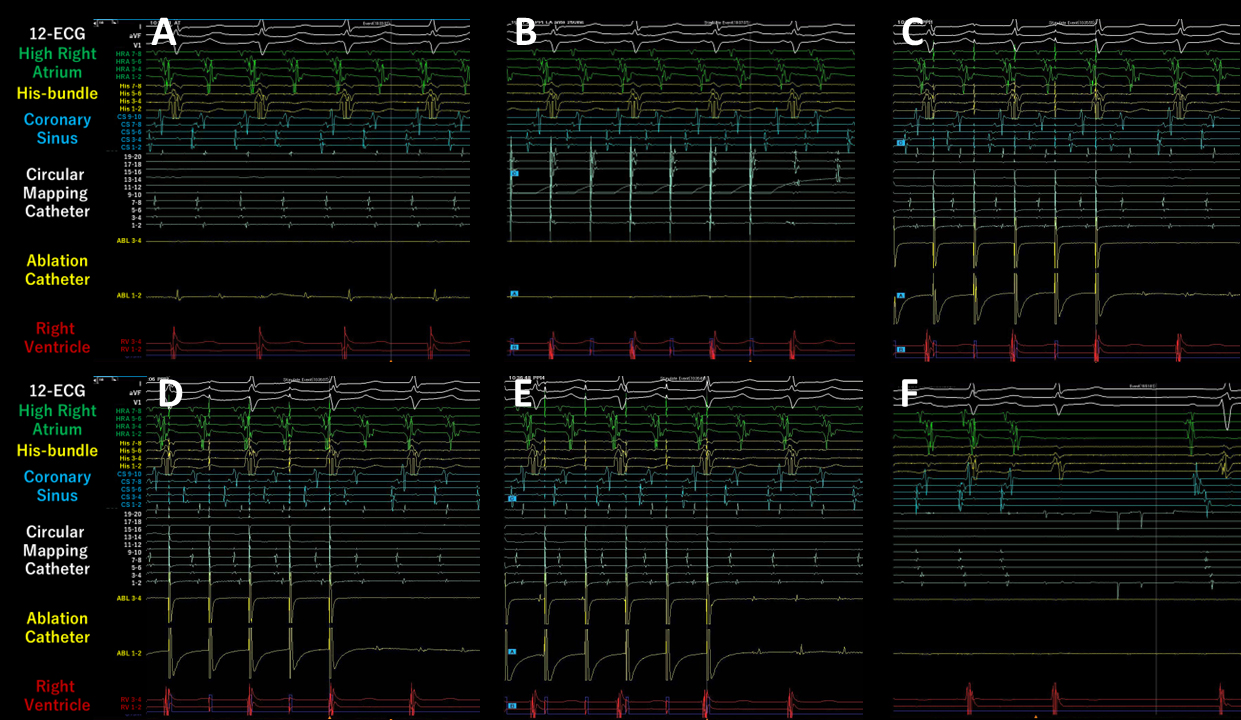
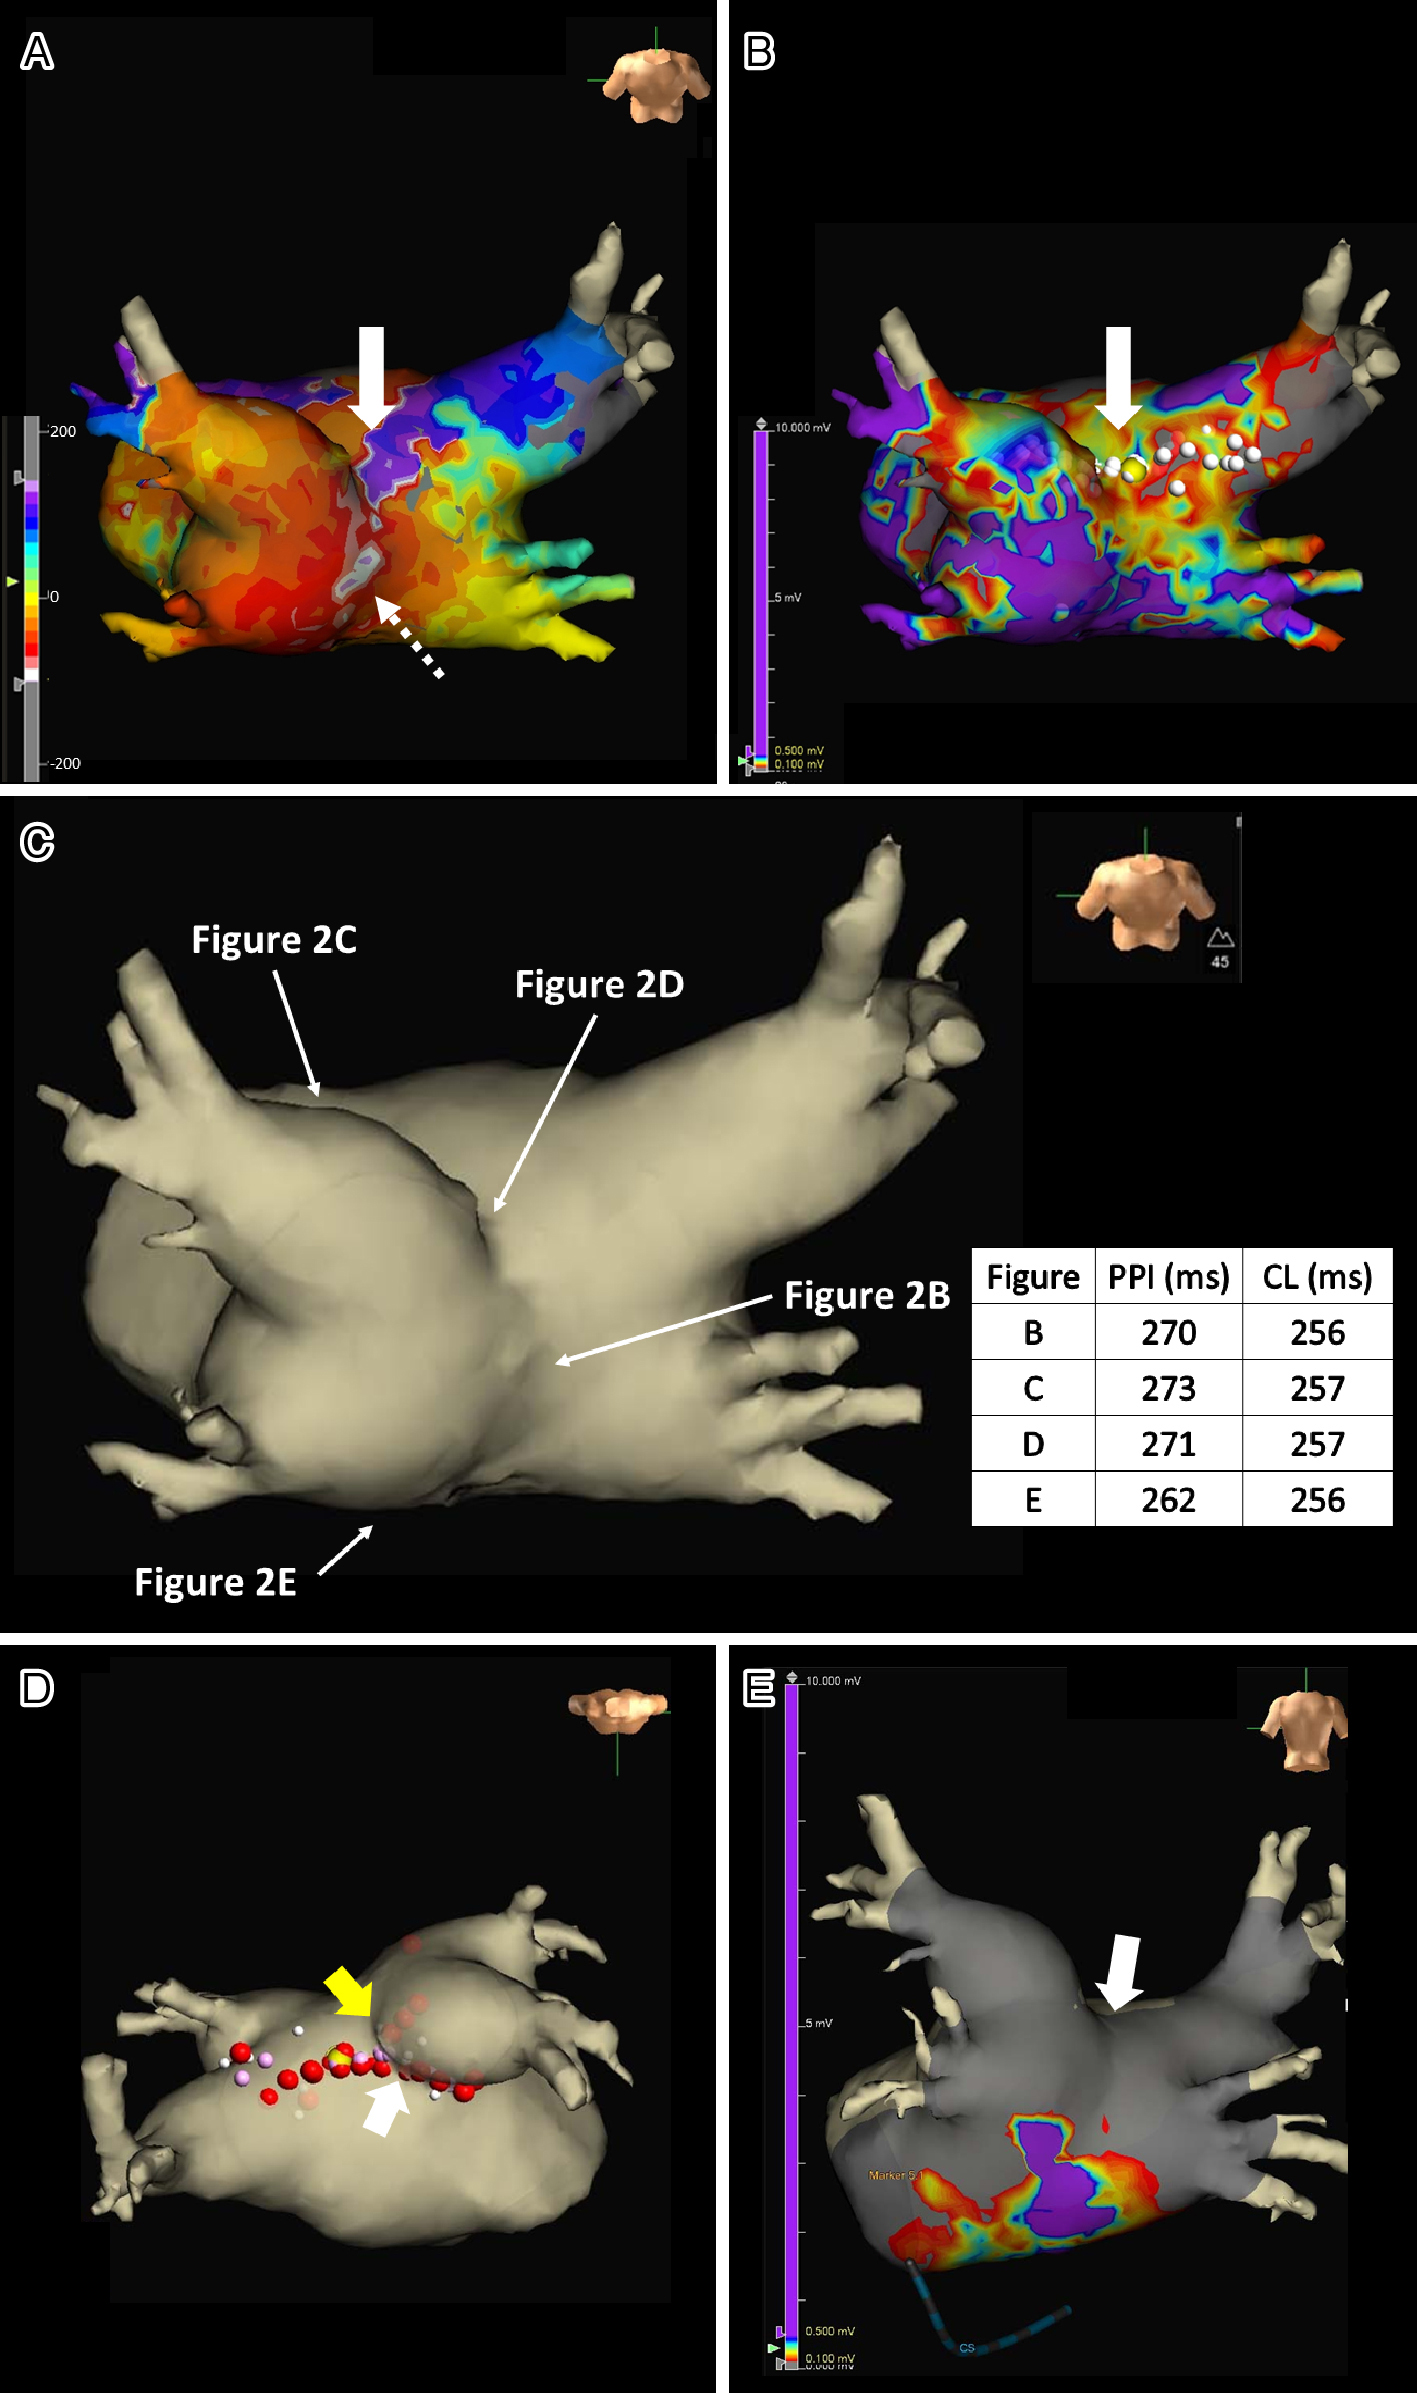
Figure 3. Local activation time isochronal (LATI) (A) and voltage (B) mapping images from an upper side view (A, B) during atrial tachycardia/atrial flutter. At first, this mapping (A) demonstrated that the earliest activation site was located within the left atrial (LA) posterior wall (LAPW) (white dotted arrow in A). However, careful observation revealed an ‘early meets late’ region on the roof and a slow conduction zone on the LA roof on the LATI map (white arrow in A), and a low voltage in this area on the voltage map (white arrow in B). Anatomy mapping image from a posteroanterior view (C). White arrows in C indicated the sites of the overdrive endocardial pacing. Radiofrequency energy was delivered (red dots in D) to both the LA roof line (yellow arrow in D) and the anterior line of the left superior pulmonary vein (PV) (white arrow in D). LATI mapping image after PVs and LAPW isolations from a posteroanterior view (E) during sinus rhythm using the EnSite system.
CL: cycle length; PPI: post-pacing interval.
From: Roof-dependent Macro-reentrant Left Atrial Flutter Masked by Probable Epicardial Conduction via the Septopulmonary Bundle