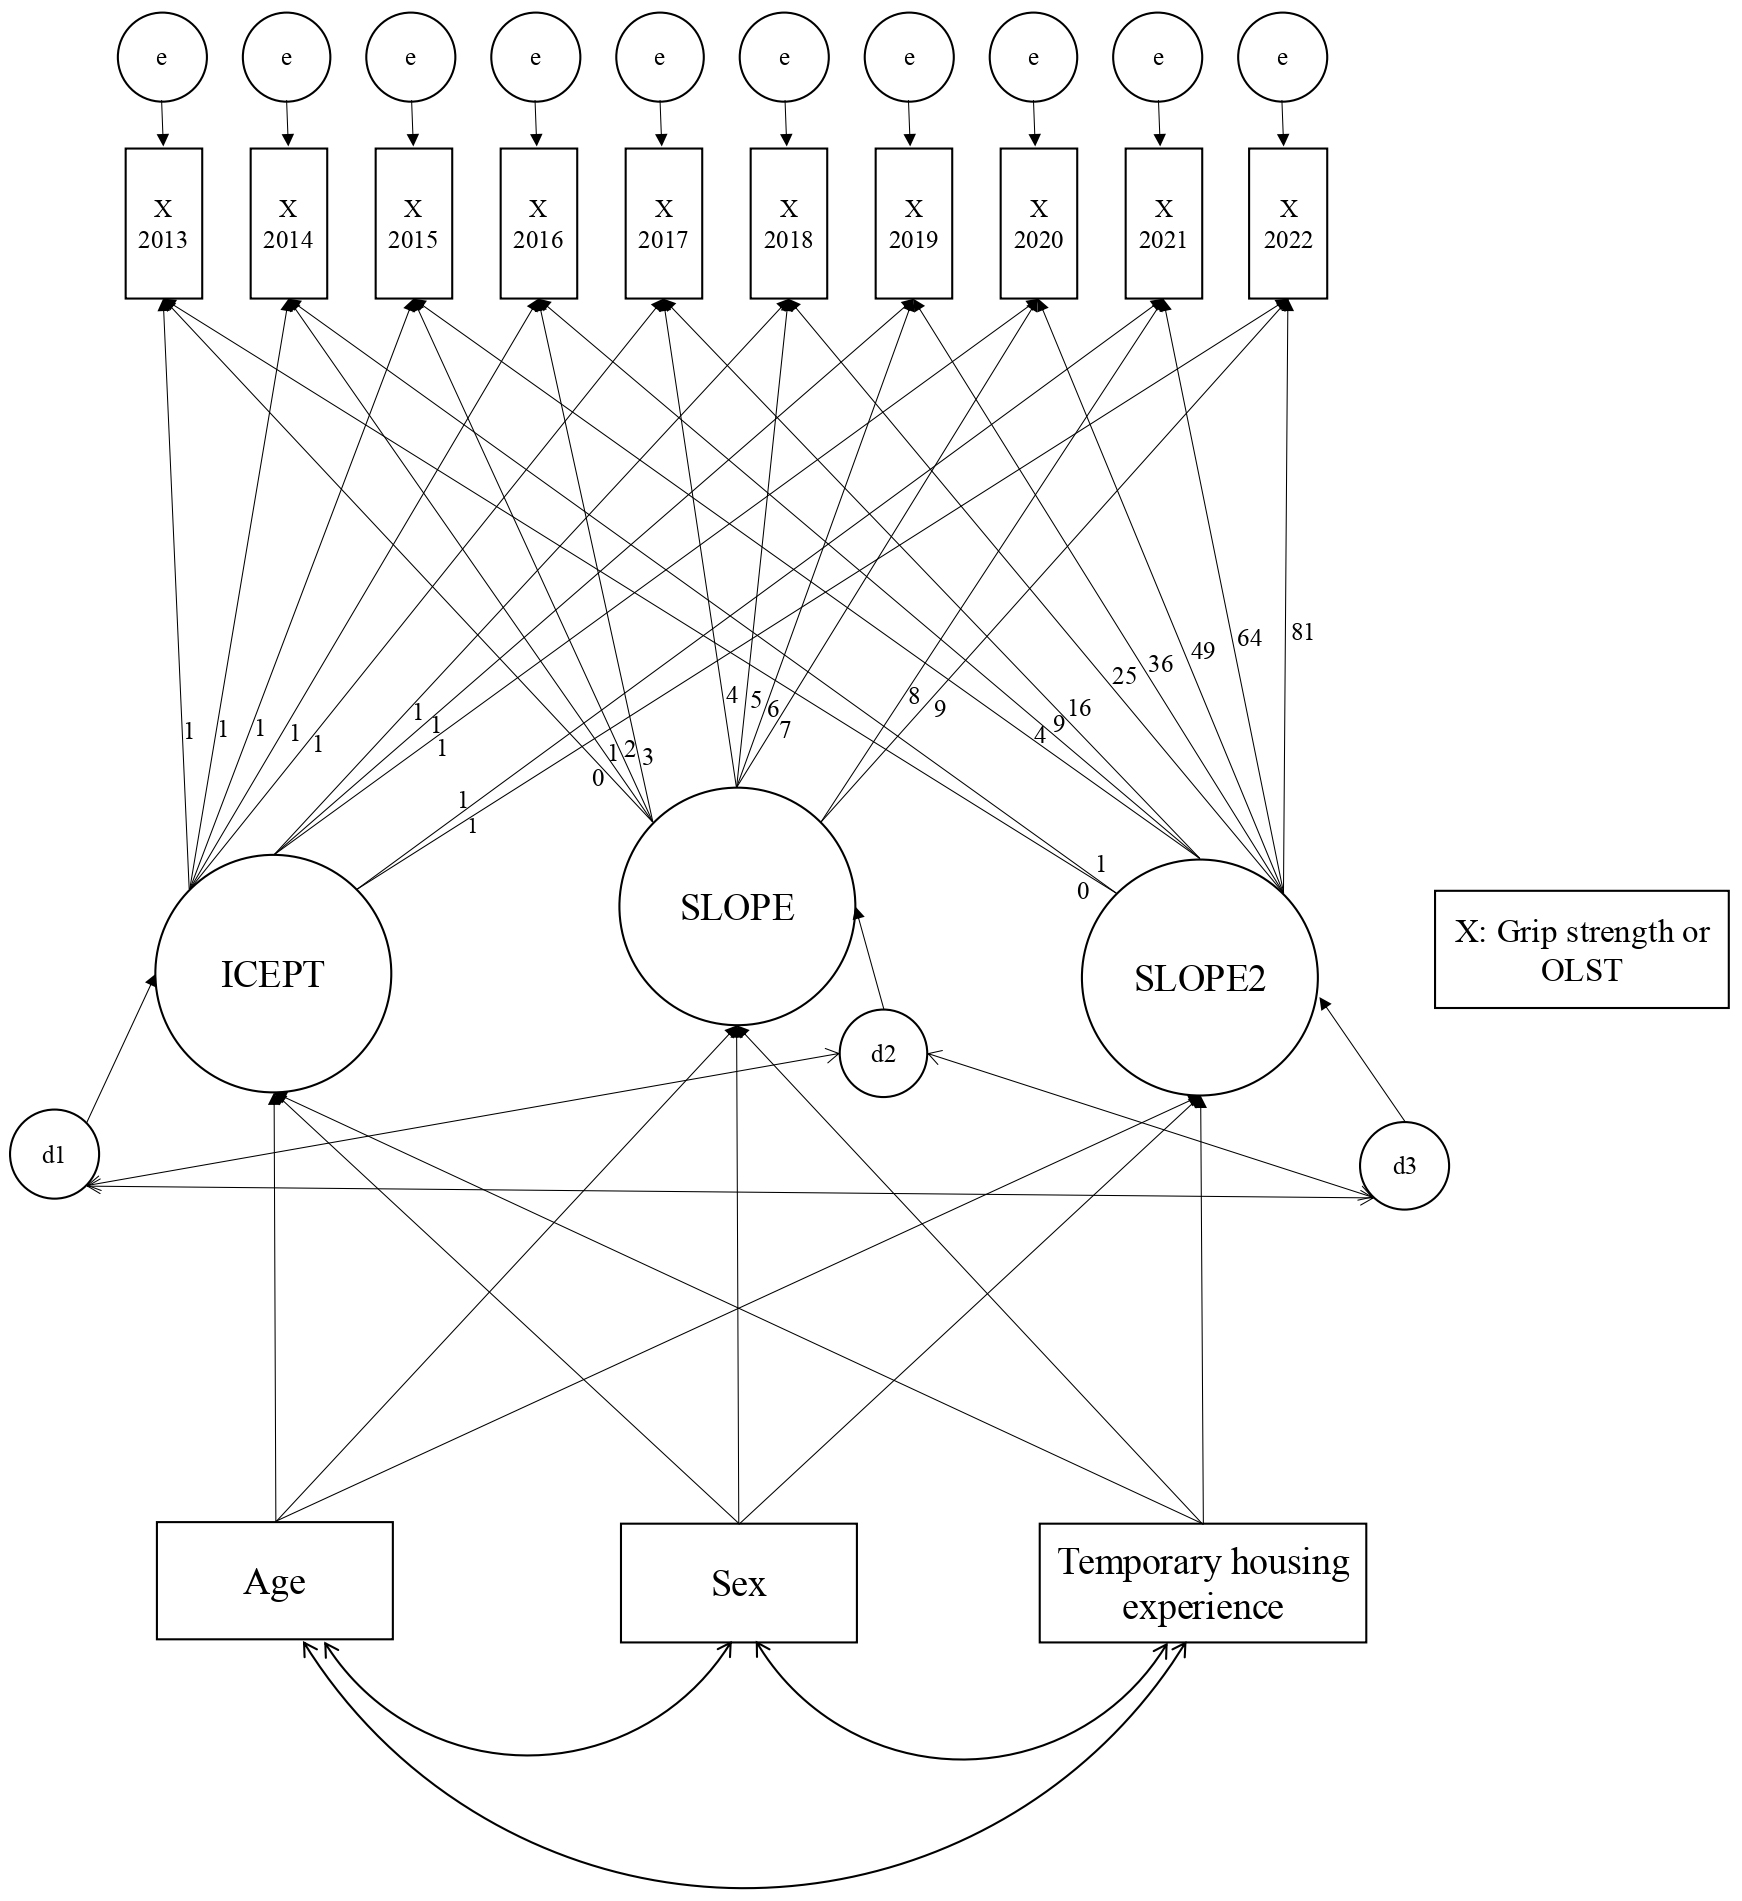
Figure 1. Diagram of the latent growth curve model.
Figure 1 shows a latent growth curve model that analyzes the associations among the factors “age,” “sex,” and “temporary housing experience” and their influence on grip strength and one-leg standing time (OLST) results over 10 years (2013-2022). X represents either grip strength or one-leg standing time, both of which were incorporated into the model. The values shown are unstandardized path coefficients.
From: Physical Function Changes in Older Adults Living in Temporary Housing after the Great East Japan Earthquake