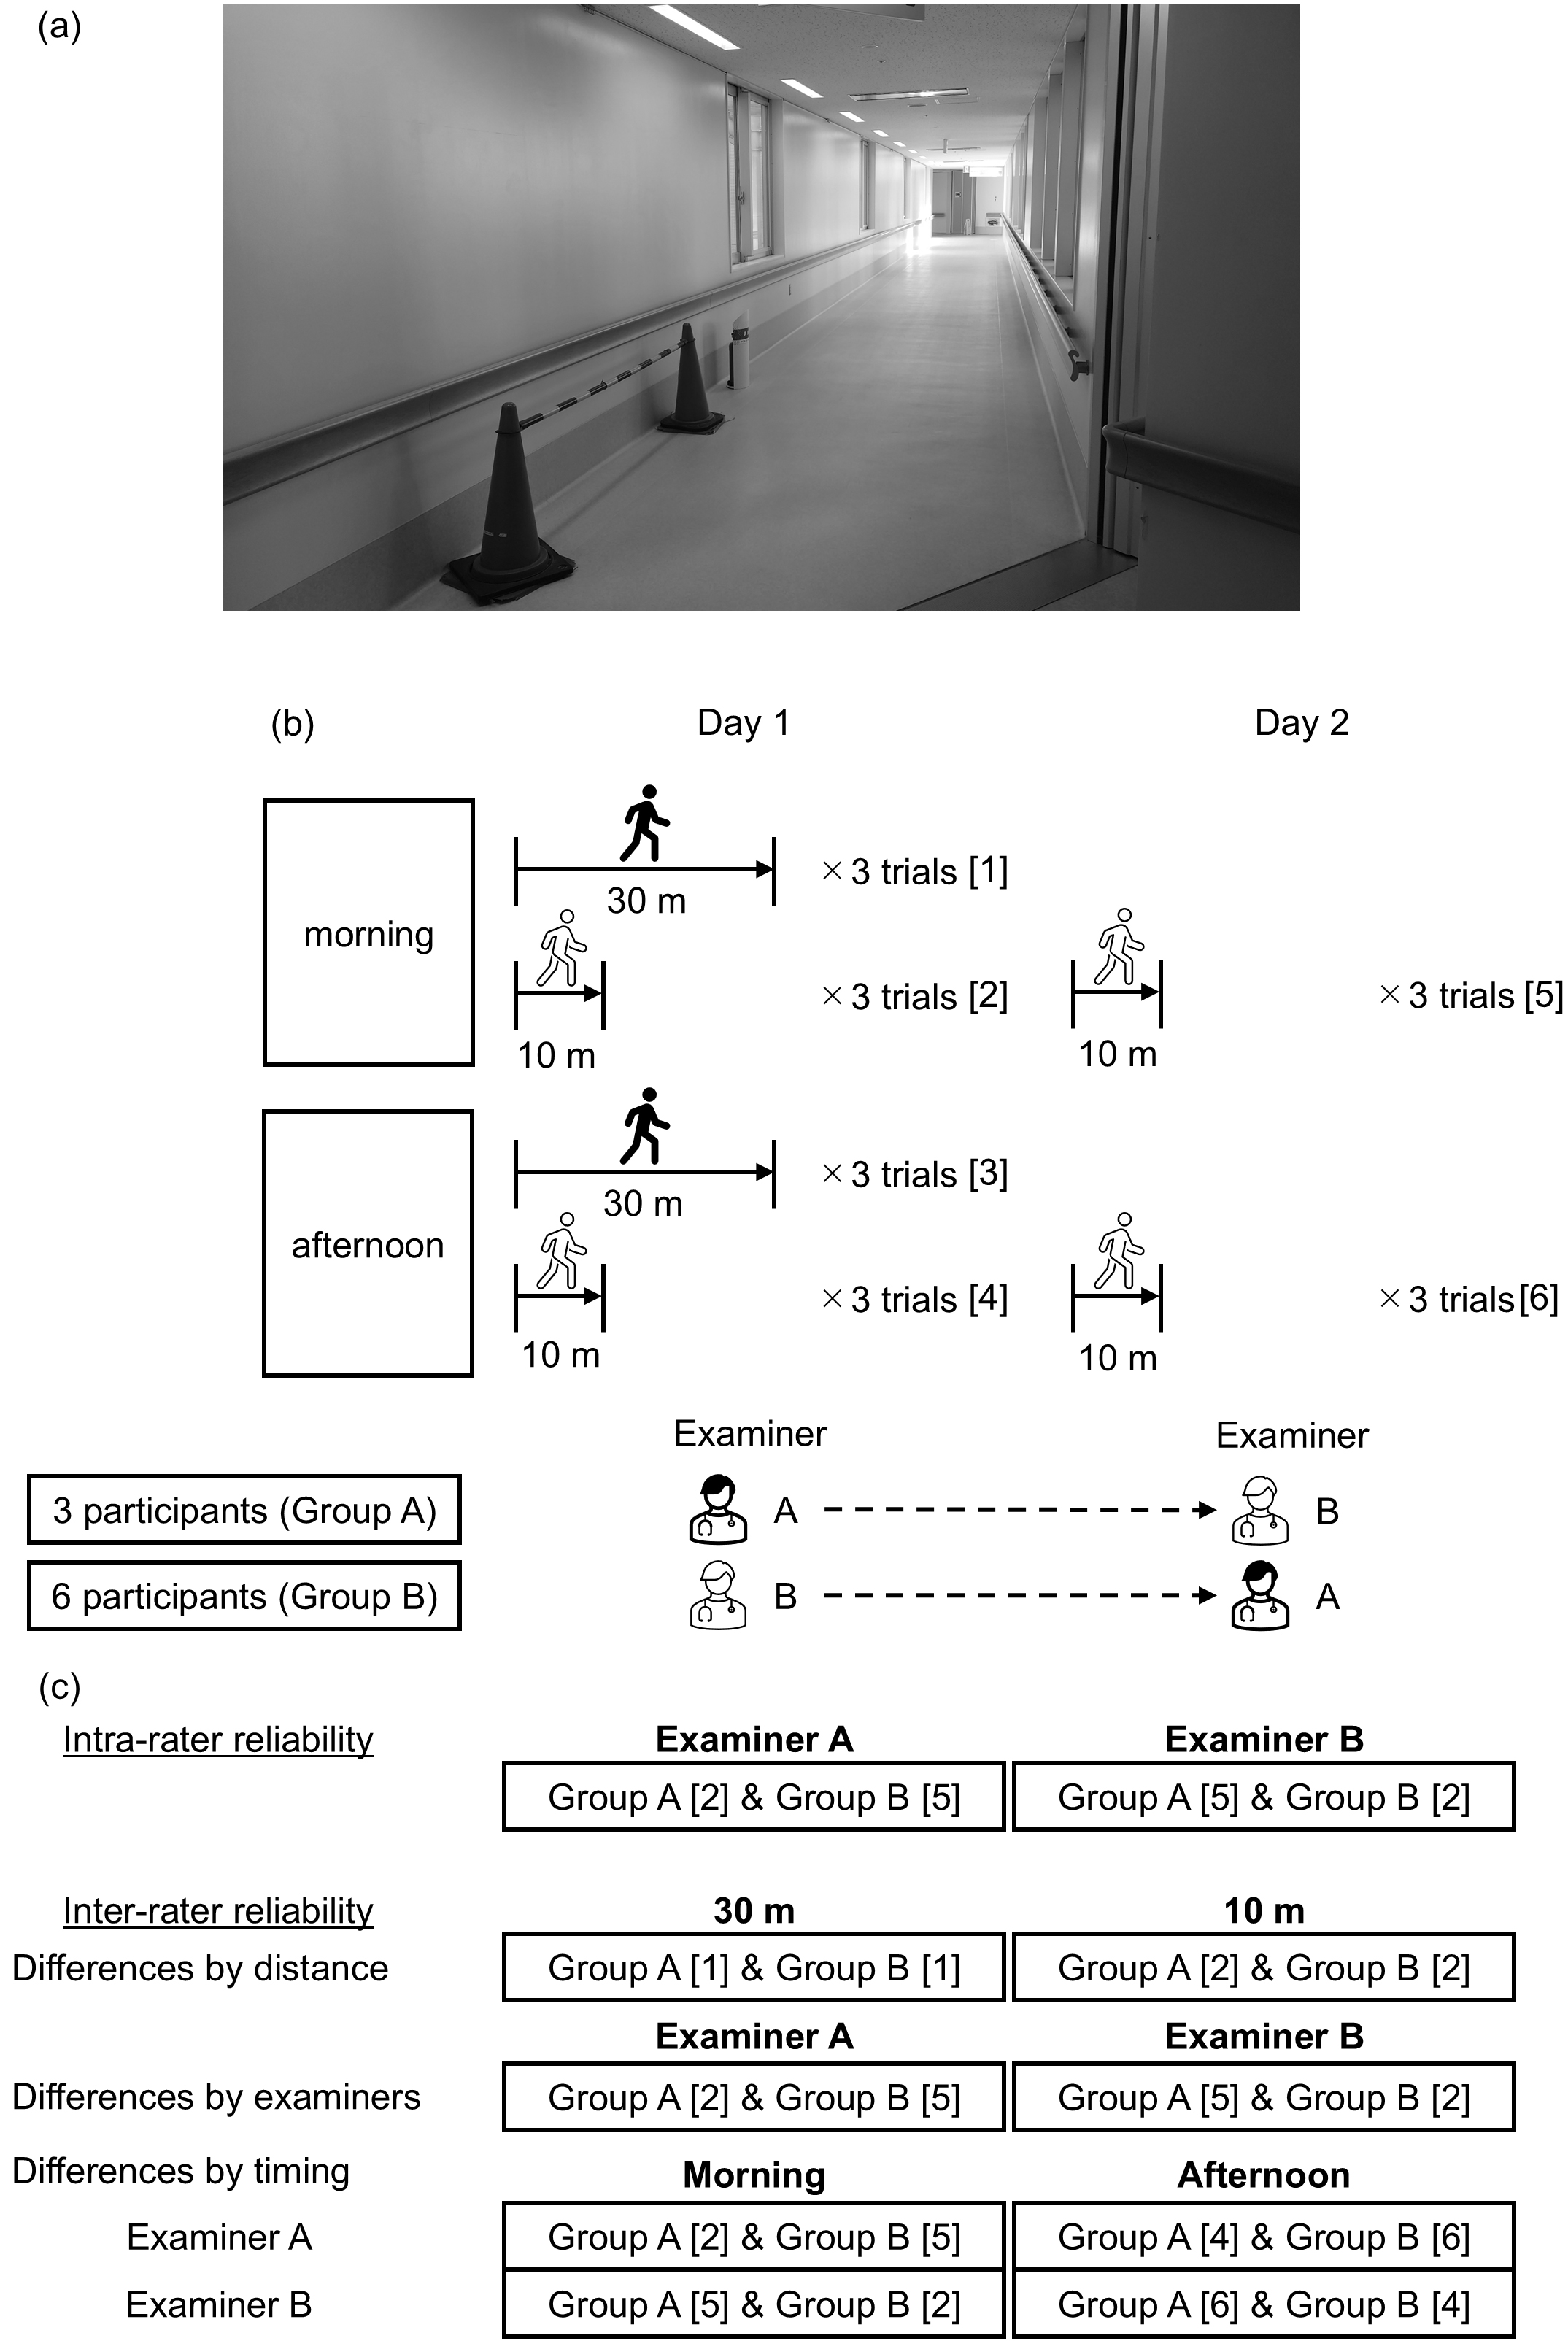
Figure 1. Gait analysis settings. The gait analysis was conducted in a long over 30-m-long corridor (a). The participants were tested under different conditions by distance (10 vs. 30 m), examiner (examiner A vs. B) and timing (morning vs. afternoon). Each condition was tested three times. Square brackets indicate trials based on distance and time for each measurement day. On day 1, examiner A measured three participants, while examiner B measured six participants. The participants measured by examiner A on day 1 were defined as group A, and those measured by examiner B were defined as group B (b). The measurement points used to evaluate intra-examiner and inter-examiner reliability based on distance, examiner, and timing are shown in (c). The difference in distance was analyzed using data from examiners A and B collected in the morning of day 1.

From: Reliability of Gait Analysis Using ORPHE ANALYTICS in Patients with Type 2 Diabetes: A Single-center Observational Study

Figure 2. Flowchart of study participants. During the study period, 48 patients with diabetes were admitted to the Department of Endocrinology and Metabolism. Finally, 9 patients agreed to participate in this study.

From: Reliability of Gait Analysis Using ORPHE ANALYTICS in Patients with Type 2 Diabetes: A Single-center Observational Study

Figure 3. Bland-Altman plots of the average and difference of gait parameters for 10-m and 30-m walking. The dotted line represents the mean difference between the two measurements and the 95% confidence interval.

From: Reliability of Gait Analysis Using ORPHE ANALYTICS in Patients with Type 2 Diabetes: A Single-center Observational Study

Figure 4. Bland-Altman plots of the average and difference of gait parameters assessed by examiners A and B. The dotted line represents the mean difference between the two measurements and the 95% confidence interval.

From: Reliability of Gait Analysis Using ORPHE ANALYTICS in Patients with Type 2 Diabetes: A Single-center Observational Study

Figure 5. Bland-Altman plots of the average and difference of gait parameters in the morning and afternoon evaluated by examiner A. The dotted line represents the mean difference between the two measurements and the 95% confidence interval.

From: Reliability of Gait Analysis Using ORPHE ANALYTICS in Patients with Type 2 Diabetes: A Single-center Observational Study

Figure 6. Bland-Altman plots of the average and difference of gait parameters in the morning and afternoon evaluated by examiner B. The dotted line represents the mean difference between the two measurements and the 95% confidence interval.

From: Reliability of Gait Analysis Using ORPHE ANALYTICS in Patients with Type 2 Diabetes: A Single-center Observational Study

PAGE TOP