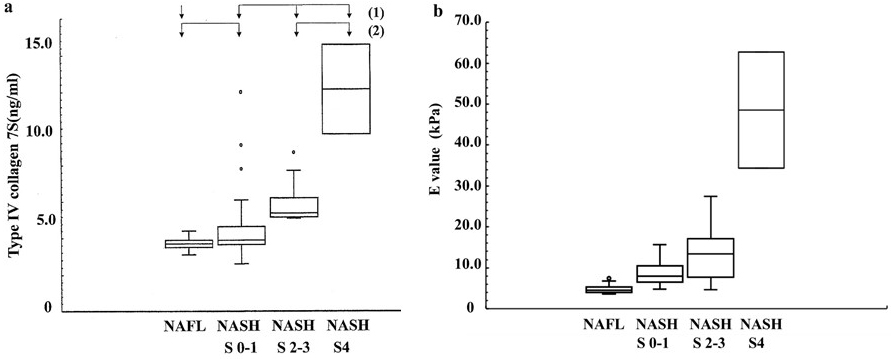
Figure 3. (a) Boxplots (median, upper, and lower quartiles, range, and outliers (circles)) of type IV collagen 7s.
A stepwise increase in type IV collagen 7s was observed from NAFL to NASH s4.
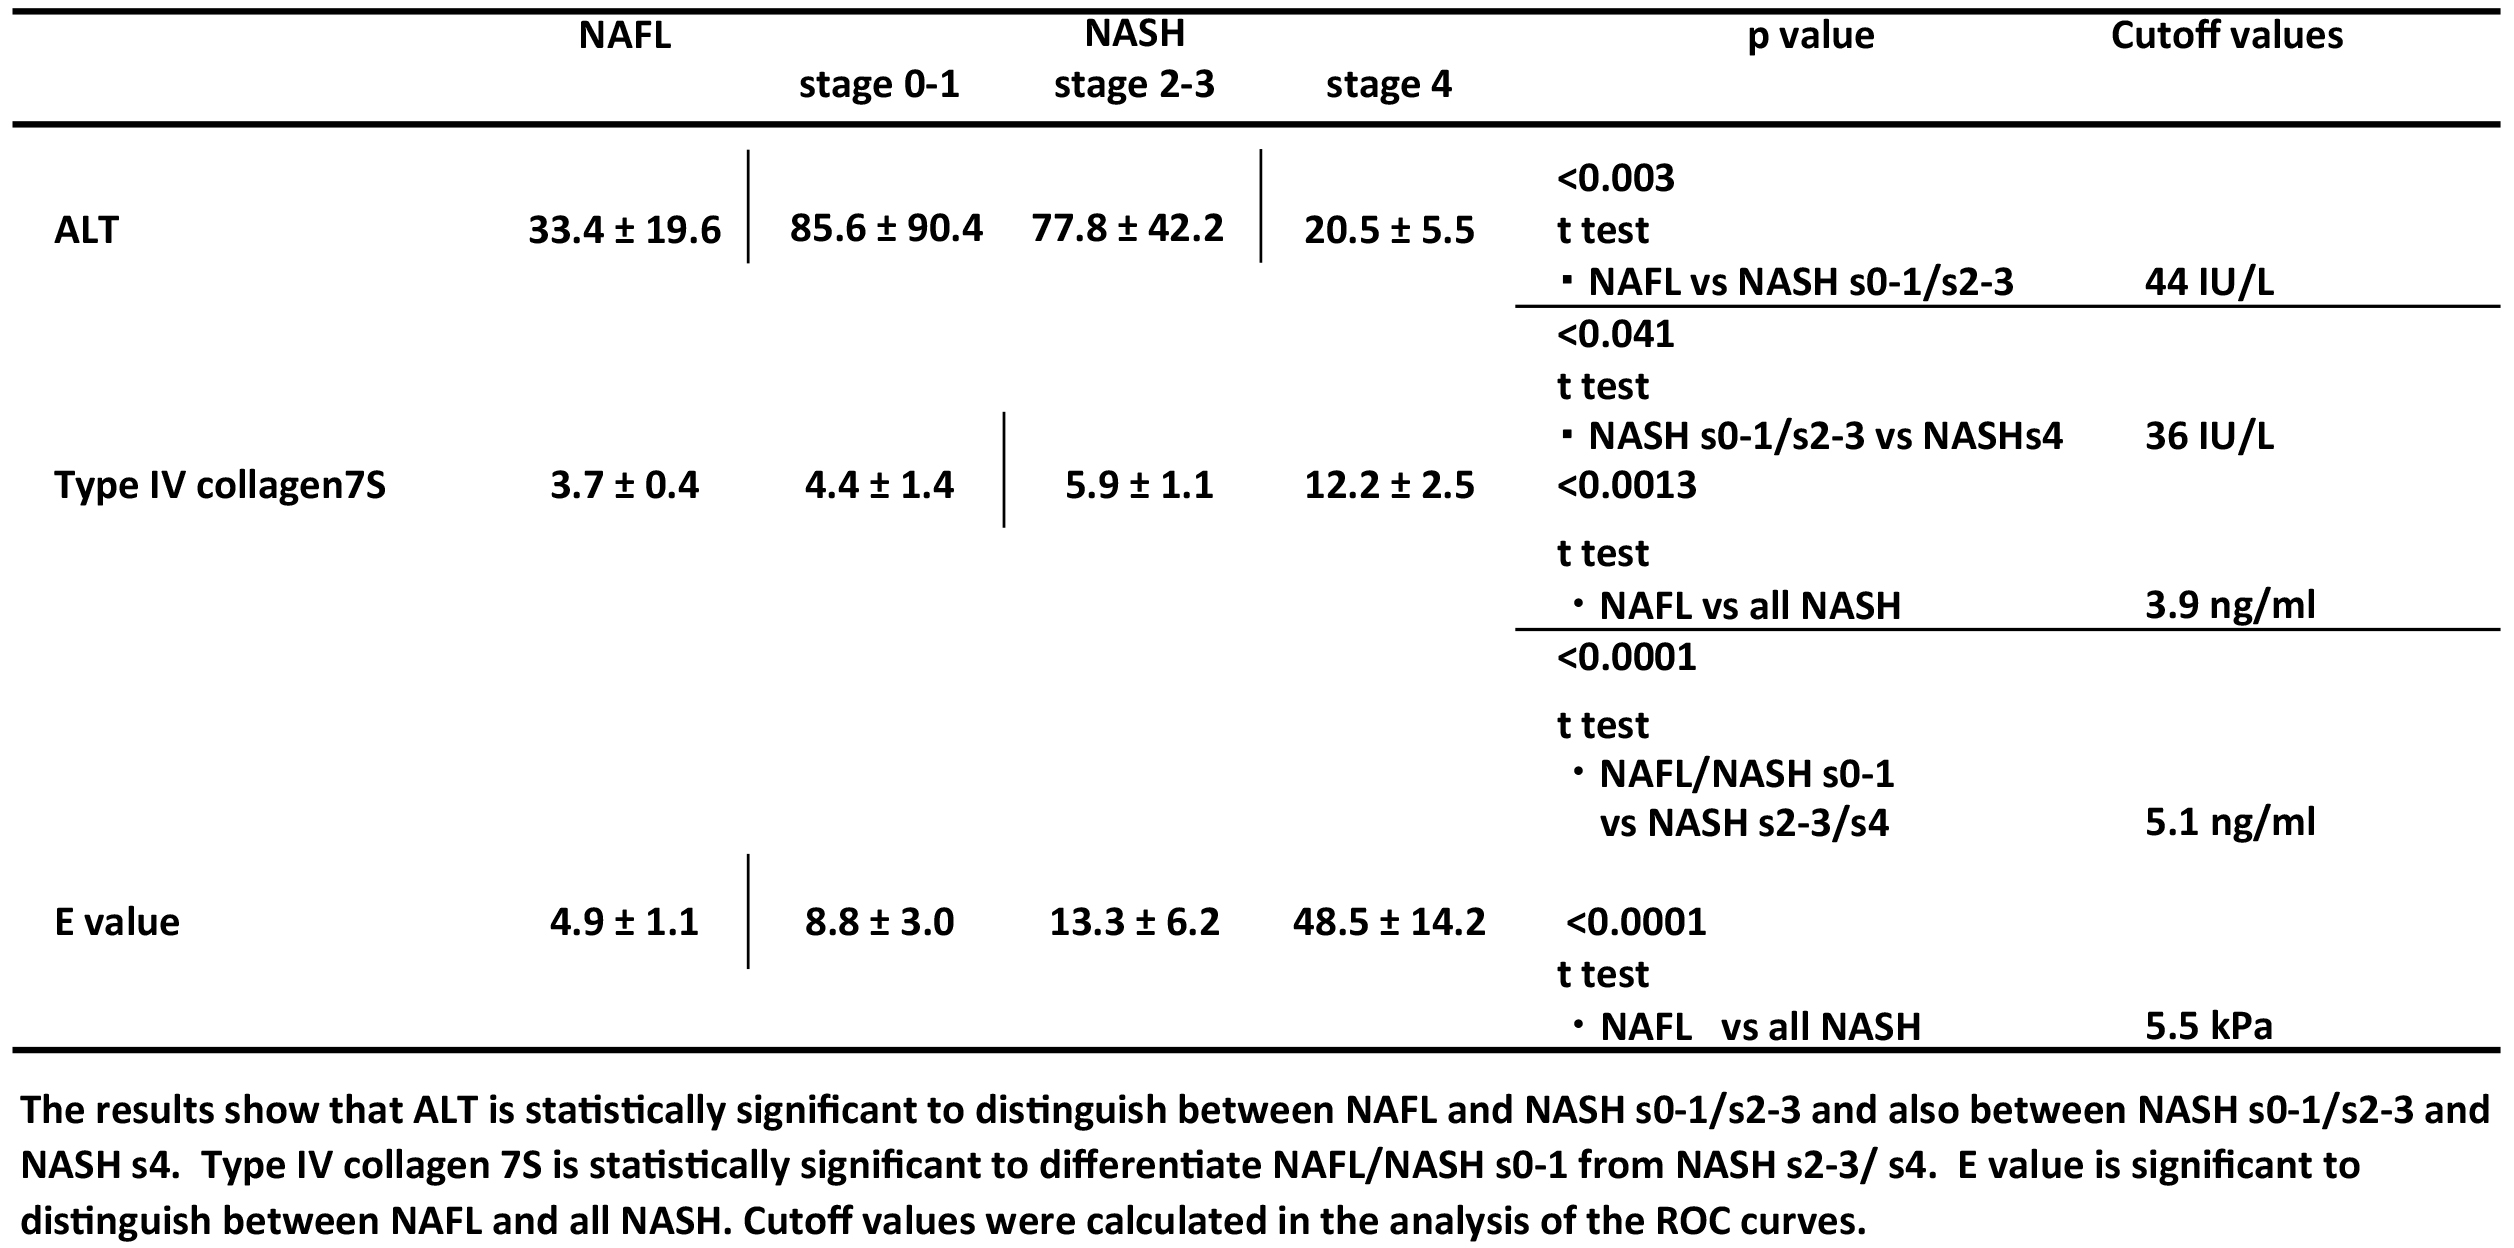
Note: (1): P < 0.0013 between NAFL and all NASH
(2): P < 0.0001 between NAFL/NASH s0-1 and NASH s2-3/NASH s4.
(b) Boxplots (median, upper, and lower quartiles, range, and outliers (circles)) of E value. A stepwise increase in E value was observed from NAFL to NASH s4.
Note: P < 0.0001 between NAFL and all NASH.
From: Positive Pattern Recognition System Using Alanine Aminotransferase, Type IV Collagen 7s, and E Value (Liver Stiffness) for the Diagnosis of Nonalcoholic Steatohepatitis Based on Natural History