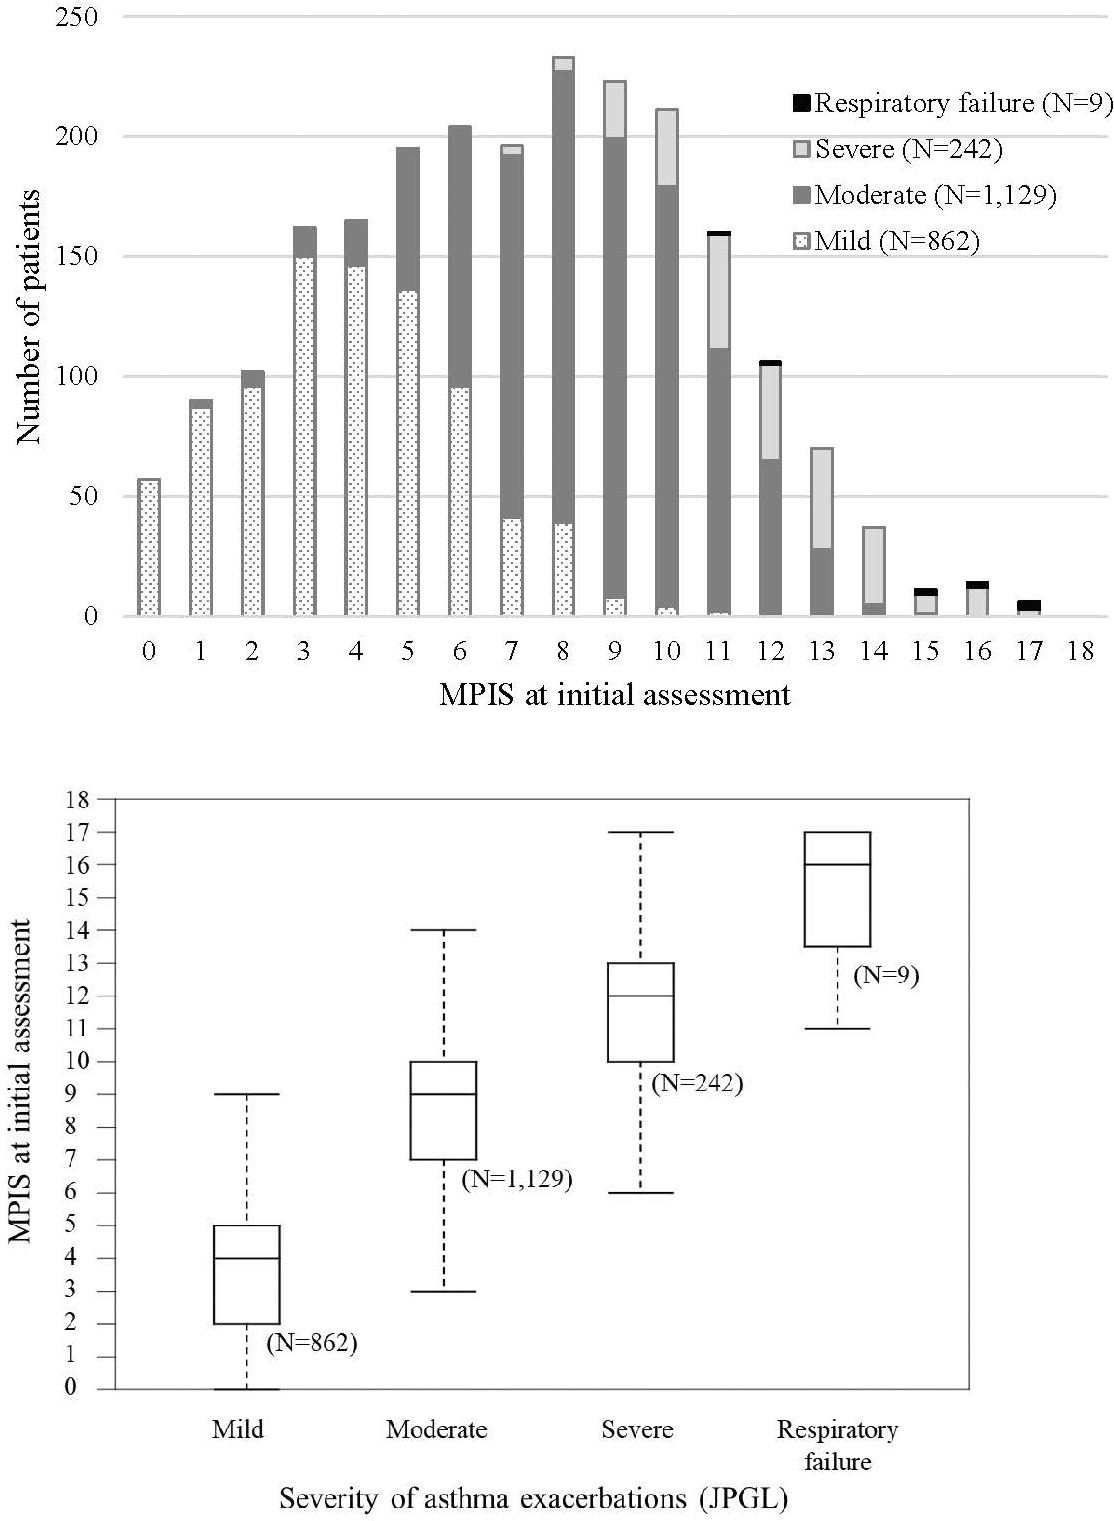
Figure 2. Correspondence of the MPIS to severity of asthma exacerbations (JPGL). The whiskers of the box plot are drawn to the furthest point within 1.5 × IQR from the box. The distributions of the MPIS were significantly different between groups (Kruskal–Wallis rank sum test, P < .0001).
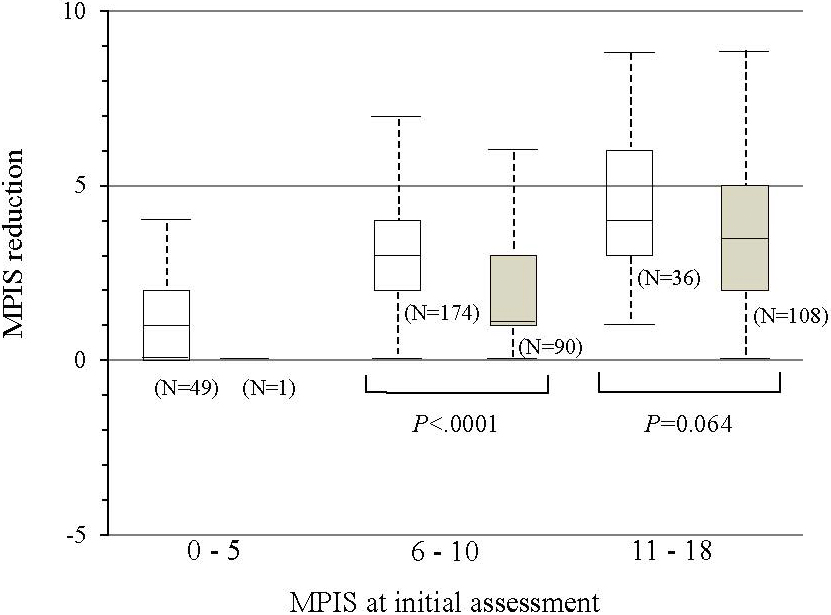
Figure 3. Correlation between the MPIS reduction and hospital admission. The box plot comparing the distribution of the MPIS reduction between the non-admission group (white box) and admission group (gray box), stratified by the MPIS at initial assessment. The MPIS reduction was significantly larger for the non-admission group when the MPIS at initial assessment was between 6 and 10 (Wilcoxon rank sum test, P < 0.001).