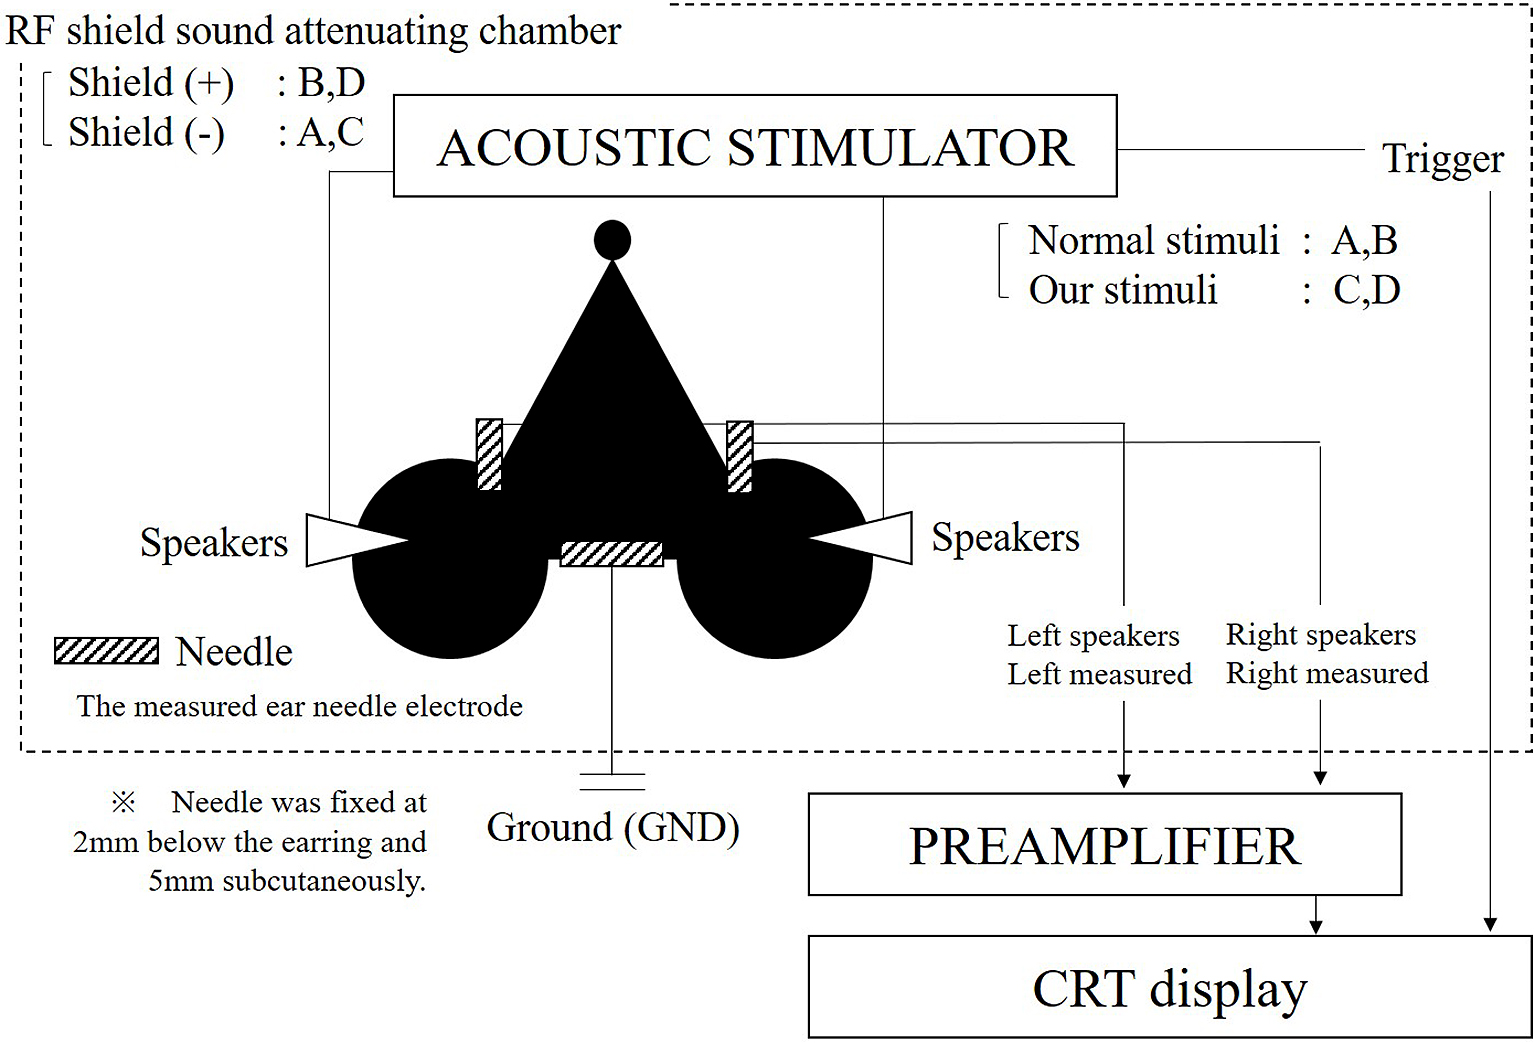
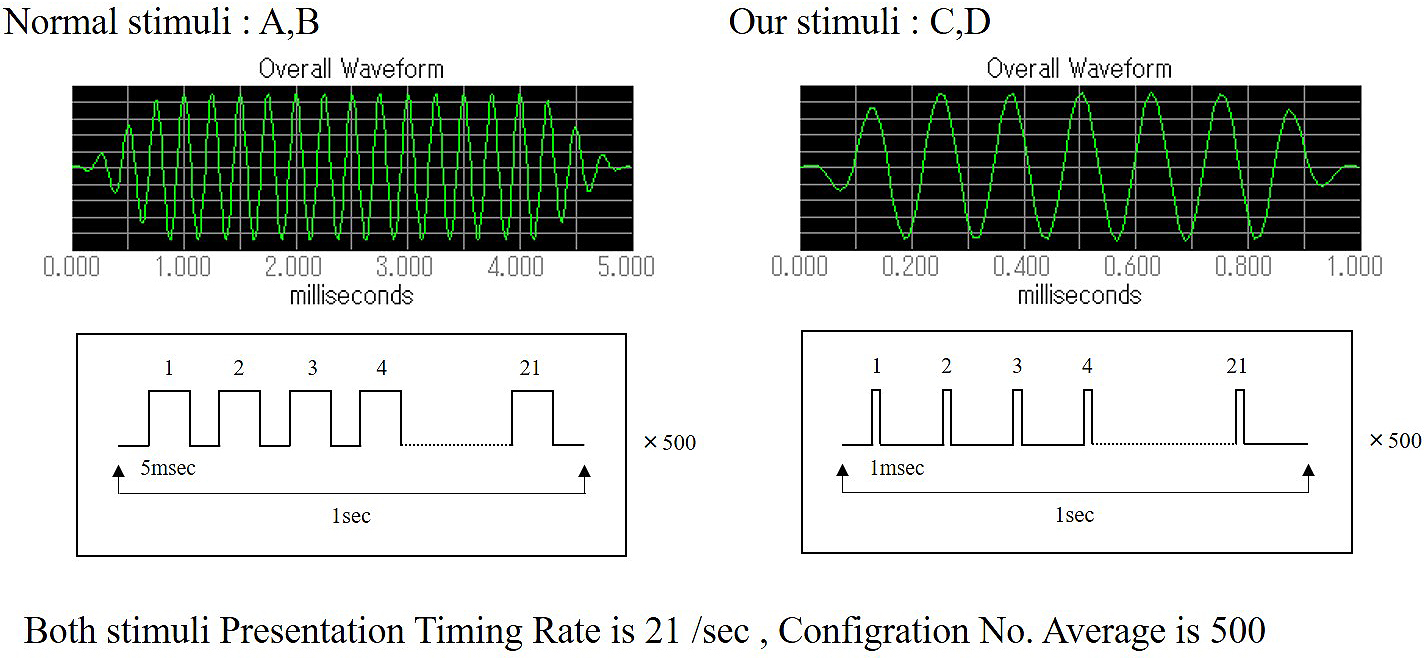
Figure 2. Two types of tone burst waves. Normal stimuli: A, B, consisting of a 5-msec duration with a sound gate of 1 msec. Our stimuli: C, D, consisting of a 1-msec duration with a sound gate of 0.1 msec. Both stimuli presentation timing is 21 times/sec, and configuration number average is 500.
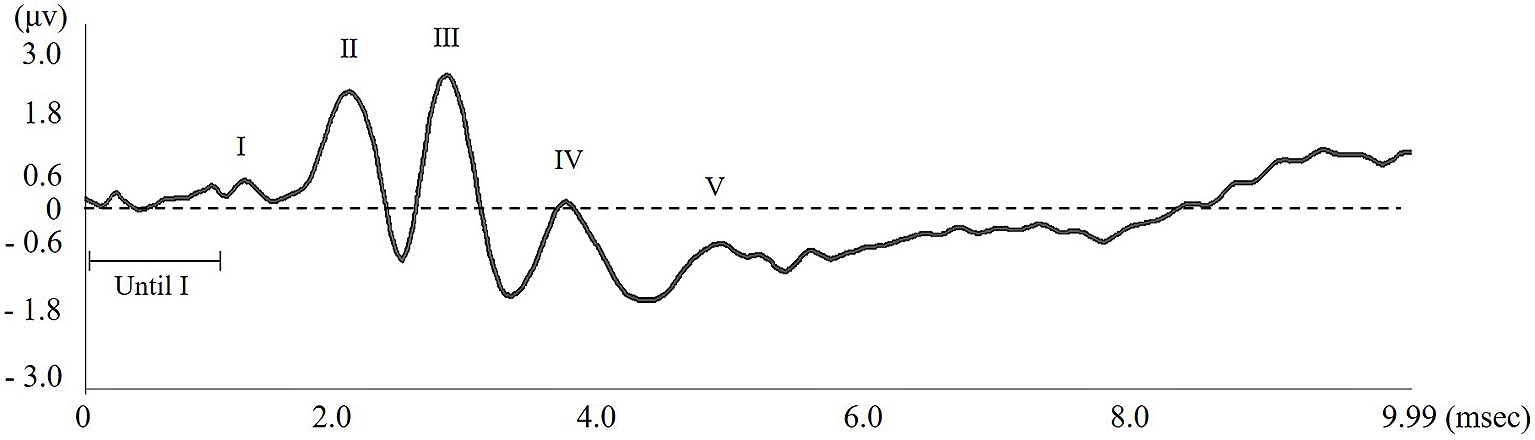
Figure 3. Example of an ABR wave form measured in a ICR mouse. Using a sound-attenuating RF field chamber and a short-tone burst sound resulted in a clearly defined wave. The hearing threshold is calculated from the latency to wave I, the length of the wave pattern and distance between the top and bottom of each wave.
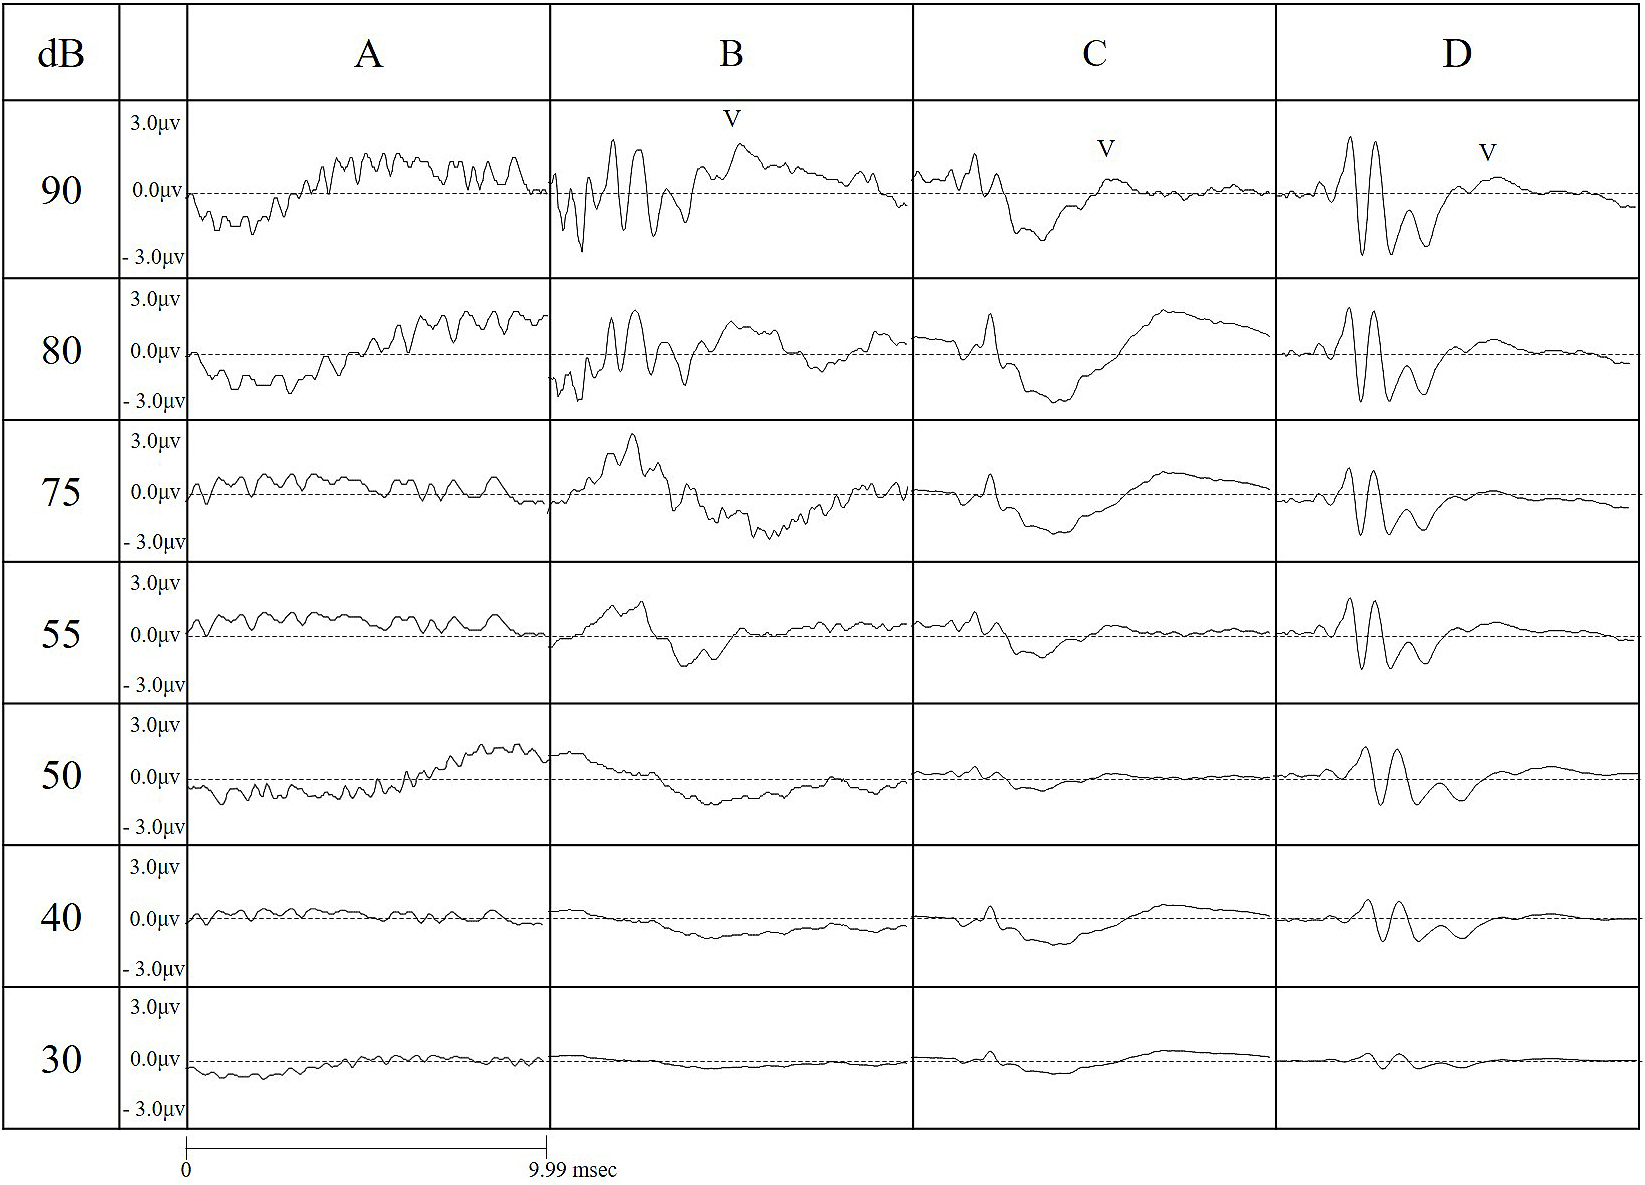
Figure 4. Wave patterns obtained for each sound level at a frequency of 16kHZ under different testing conditions (A - no chamber, conventional tone; B- chamber, conventional tone; C- no chamber, short tone; D - chamber, short tone). The horizontal length corresponds to 4 msec, but the height is −3.0-3.0 μV.
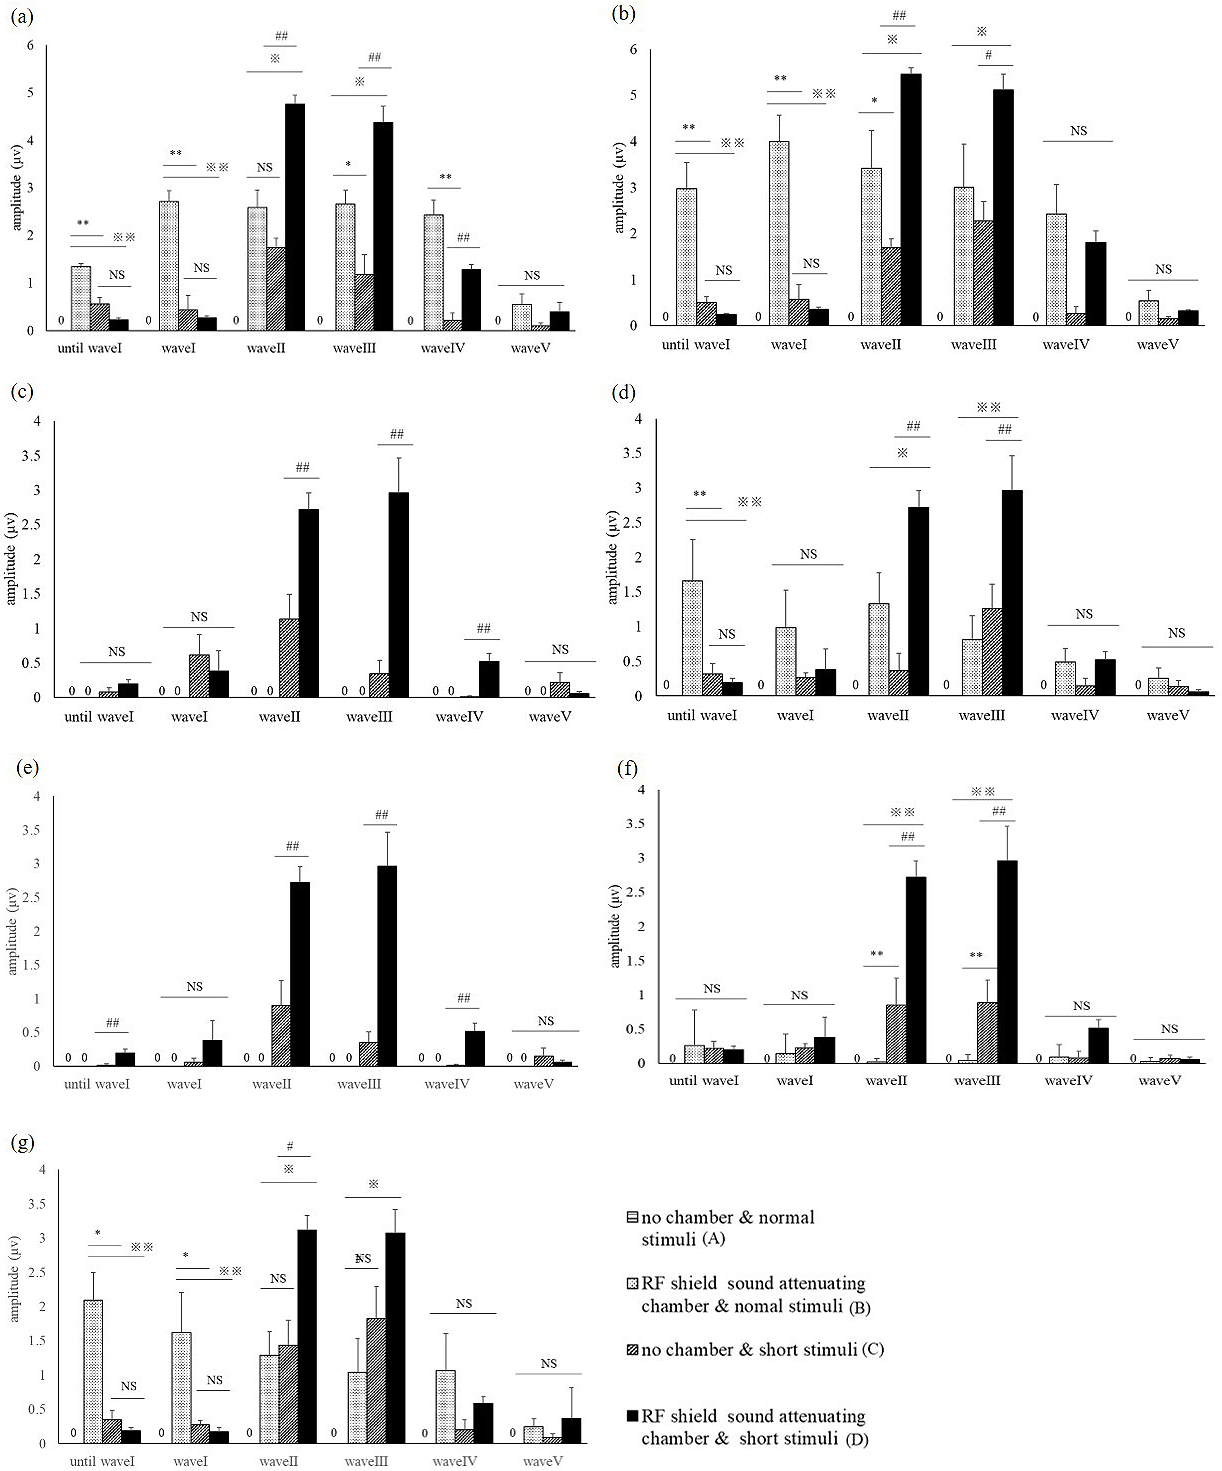
Figure 5. a)-g) Mean amplitude of each wave for the 10 ICR mice, measured at 16kHz frequency and sound levels of (a) 90 dB, (b) 75 dB, (c) 65 dB, (d) 55 dB, (e) 50 dB, (f) 40 dB, and (g) 30 dB. The symbols indicate significant differences in the ANOVA with Tukey-Kramer test. ※※p < 0.01 ※p < 0.05 vs. B, **p < 0.01 *p < 0.05 vs. C, ♯♯p < 0.01 ♯p < 0.05vs. D.
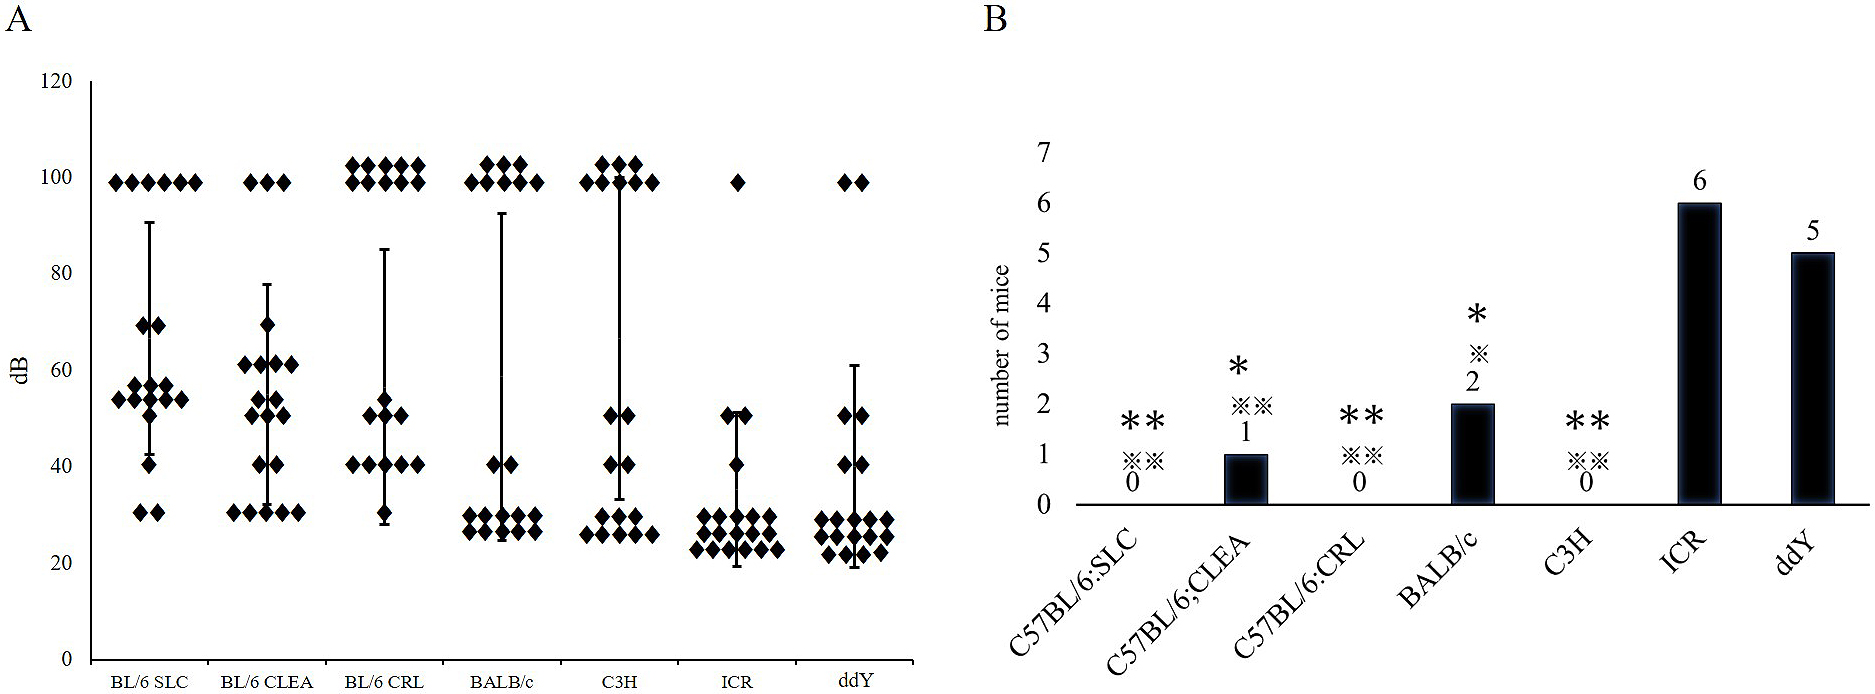
Figure 6. (A) Hearing thresholds measured for each ear in the 10 mice (right ear and left ear), in decibels. (16kHz) The vertical bars show standard deviation. (B) The mean of the number of competent mice (n = 10 8weeks of age, 16 kHz, 90db). Parametric analysis was conducted by Fisher’s exact test, ※※p < 0.01 ※p < 0.05 vs Kwl:ICR ✽✽p < 0.01 ✽p < 0.05 vs Kwl:ddY.