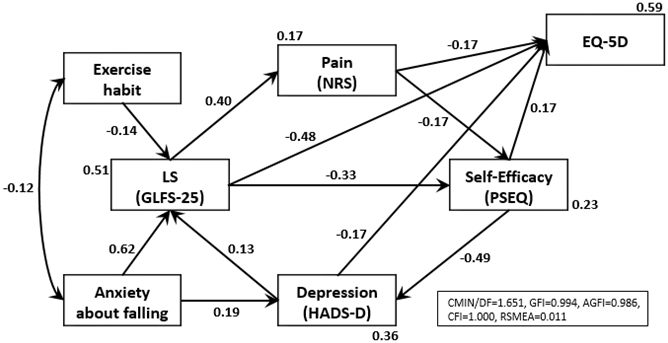
Figure 1. The final model of the relevance of a vicious cycle involving LS, musculoskeletal pain, and its psychological factors.
Values on the single-headed arrows are partial standardized regression weights. Values on the double-headed arrows are correlation coefficients. A higher value indicates a stronger causal relationship. Numbers below the rectangles indicate a squared multiple correlation coefficient by the direct-connected upstream variables. For example, 23% of the self-efficacy is explained by pain and the locomotive syndrome (LS). CMIN is a Chi-square statistics comparing the test model and the independent model to the saturated model. CMIN/DF, the relative Chi-square, is an index of how much the fit of data to model has been reduced by dropping one or more paths. Additionally, the goodness of fit of the models was evaluated using the goodness of fit index (GFI), adjusted goodness of fit index (AGFI), comparative fit index (CFI), and root mean square error of approximation (RMSEA).
From: Characteristics of Locomotive Syndrome in Japanese Patients with Chronic Pain and Results of a Path Analysis Confirming the Relevance of a Vicious Cycle Involving Locomotive Syndrome, Musculoskeletal Pain, and Its Psychological Factors