Figure 1. Structure of ROCK isoforms.
ROCK1 and ROCK2 are known as ROKβ and ROKα, respectively. Both isoforms consist of three major domains, including a kinase domain in the N-terminal domain, a coiled-coil domain that contains a Rho-binding domain, and a putative pleckstrin homology (PH) domain at its C-terminal end.
From: ROCK Inhibition May Stop Diabetic Kidney Disease
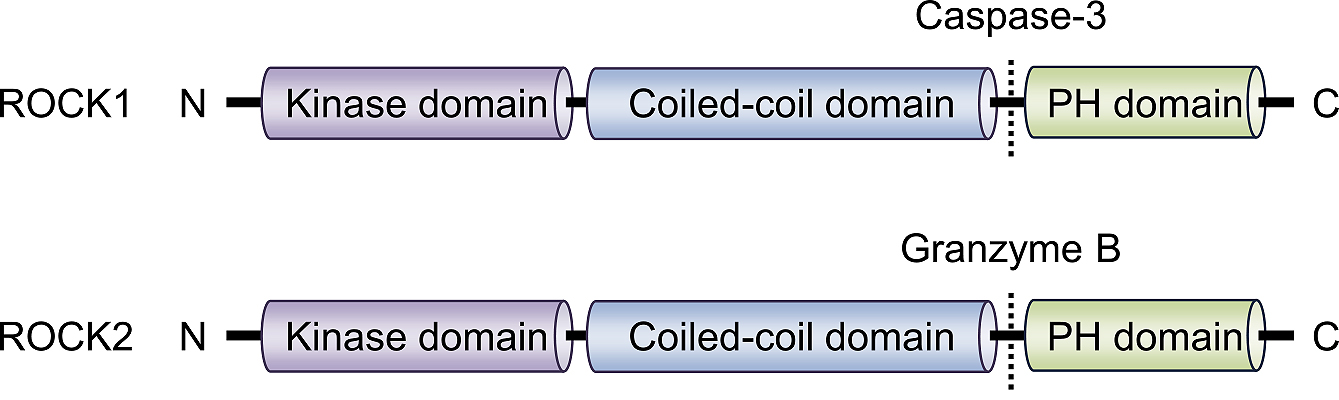
Figure 2. ROCK in renal health and disease.
Rho/ROCK signaling executes control of the cell shape, proliferation, and gene expression via cytoskeletal rearrangement. From a pathological perspective, renal ROCK signaling is activated by glucose and cytokines in the context of diabetes. The effects of the elevated ROCK activity manifest as the progression of mesangial expansion and podocyte loss, establishing a critical role for ROCK in DKD.
From: ROCK Inhibition May Stop Diabetic Kidney Disease
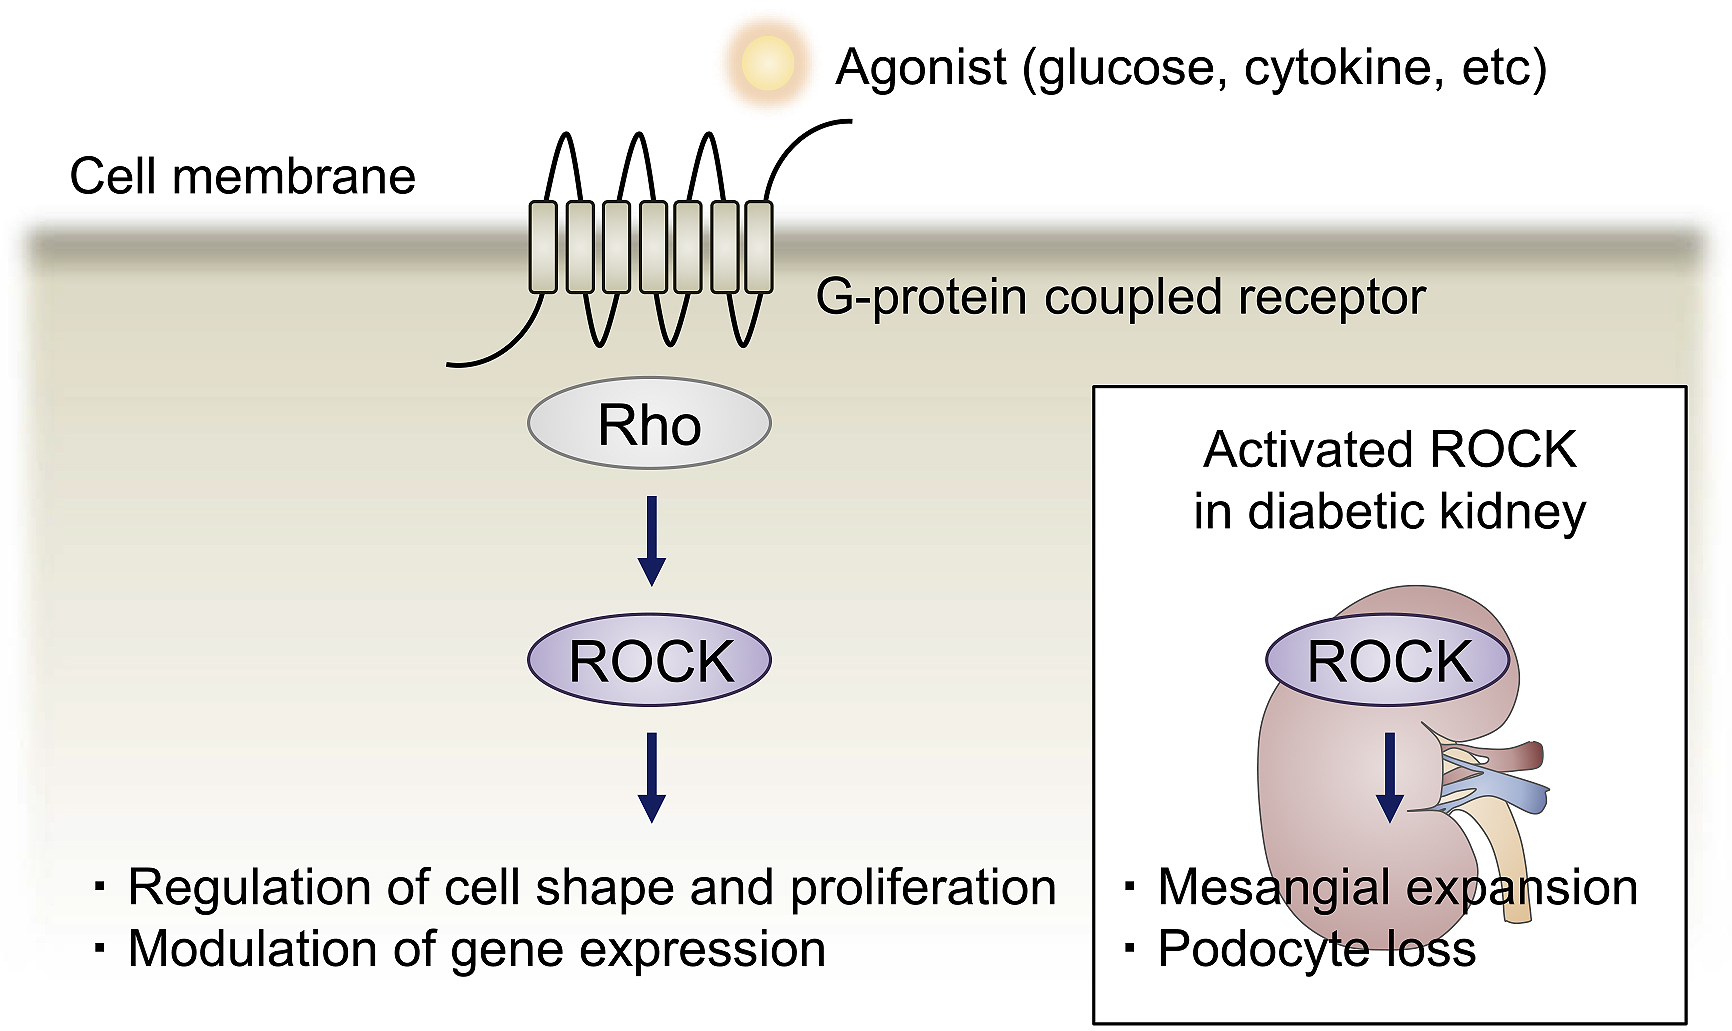
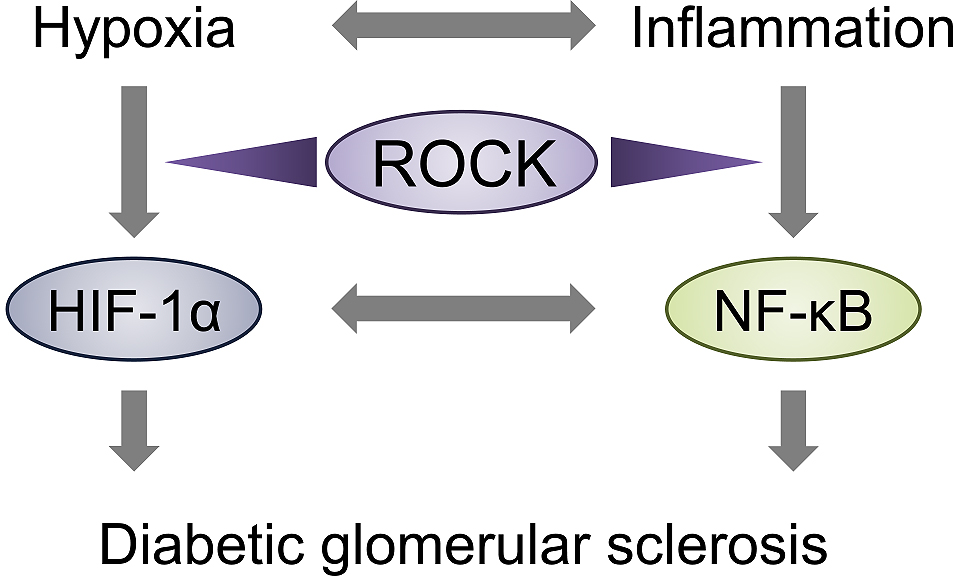
Figure 3. ROCK-dependent transcriptional regulation during the progression of DKD.
A parallel mechanism operates in the diabetic kidney via hypoxia-dependent fibrotic responses and tissue damage elicited by inflammation. ROCK governs two important transcription factors in this framework, hypoxia-inducible factor 1α (HIF-1α) and nuclear factor κB (NF-κB). The molecular basis for these effects involves the inhibition of proteasomal degradation of HIF-1α and promotion of NF-κB nuclear transport.
From: ROCK Inhibition May Stop Diabetic Kidney Disease