Figure 1. The 12-lead electrocardiograms on admission (A). An intra-cardiac electrocardiogram during atrial tachycardia (AT) (B–D). The EnSiteTM analysis by an AdvisorTM HD Grid catheter during AT demonstrated that the carina between the right veins (PVs) exhibited a low voltage (< 0.5 mV) (B). The concealed entrainment by the ablation catheter pacing positioned on the carina between the right PVs (C) and around both right PVs (D) were obtained. The post-pacing interval almost equaled the cycle-length of this AT (C, D). This AT steadily terminated (black arrow) within 2 seconds after commencing the radiofrequency energy delivery to the carina of the right PVs (E).
From: A Case of a Figure of Eight Atrial Tachycardia after a Pulmonary Vein Antrum Isolation of Atrial Fibrillation
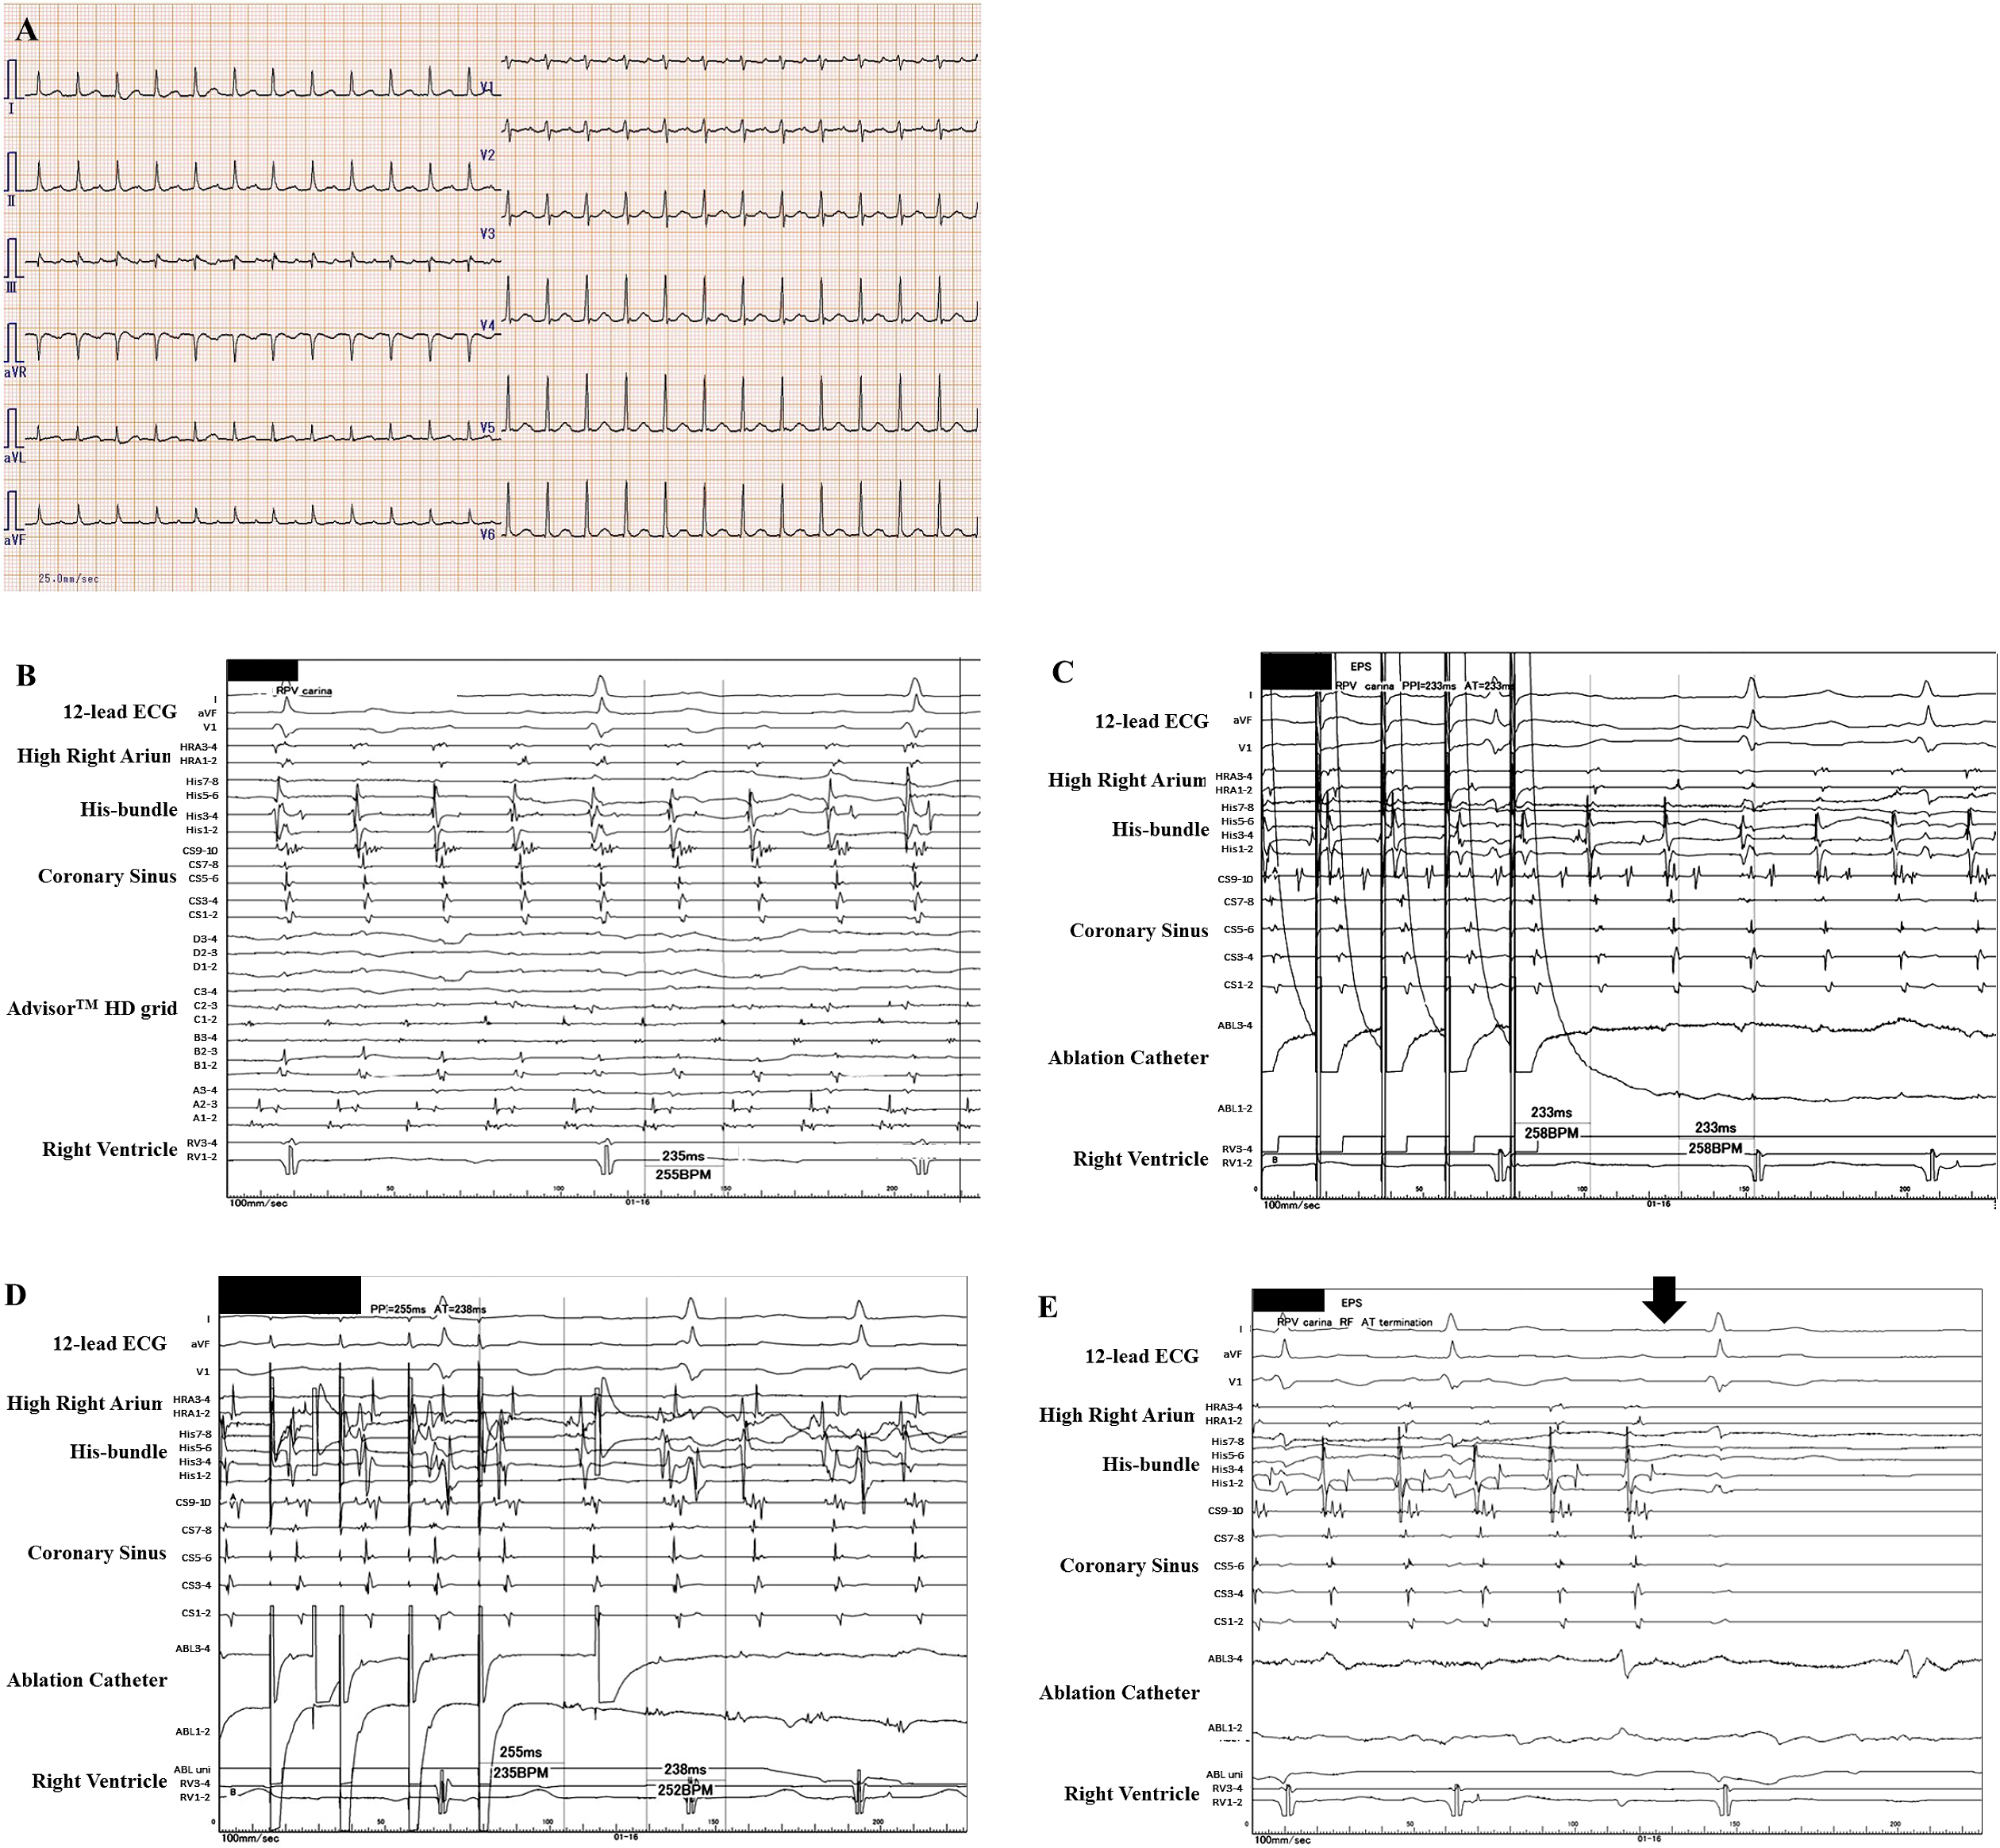
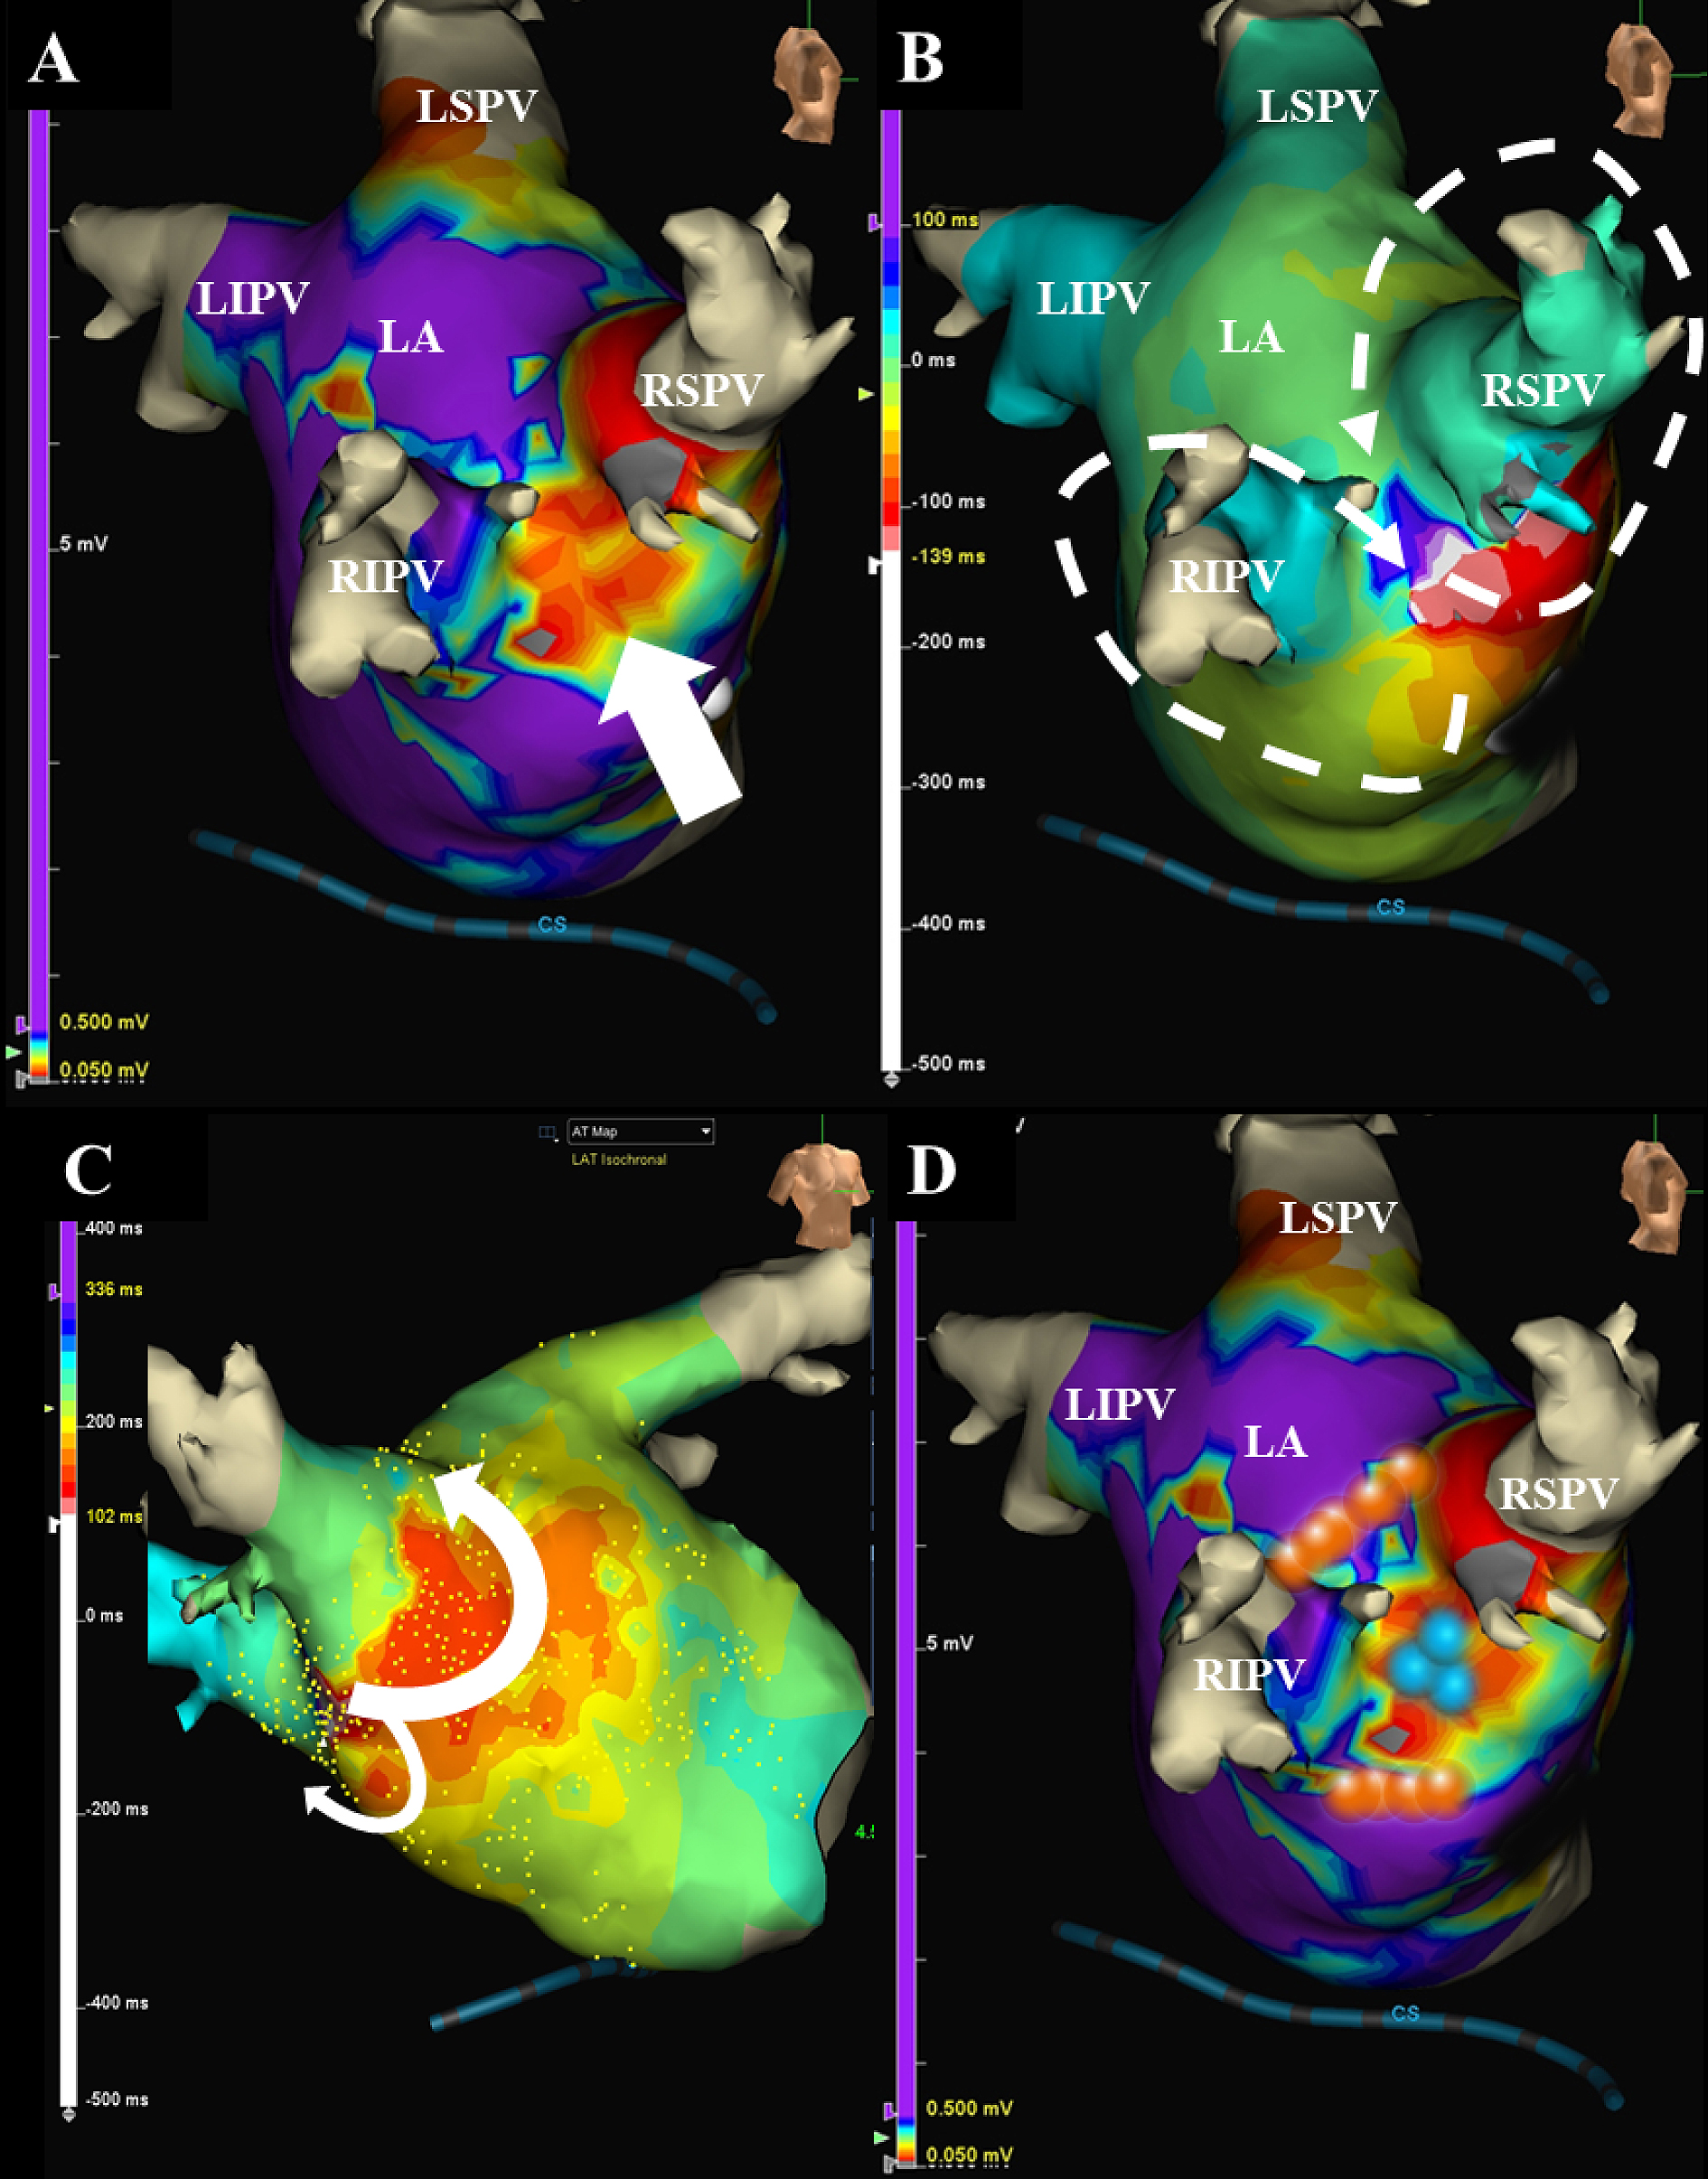
Figure 2. The EnSiteTM images viewed from the right demonstrate that the carina between the right superior and inferior pulmonary veins exhibits a low voltage (< 0.5 mV) (white arrow) (A). The electrical activation has turned around the right pulmonary veins in a figure of 8 circuit projected from right lateral view (white dotted lines) (B) and right anterior view (white lines) (C). The blue tags between the right superior and inferior pulmonary veins indicate the successful ablation points of the figure of 8 atrial tachycardia (D). The orange tags on the incomplete anterior and posterior lines of the previous pulmonary vein antrum isolation (PVAI) lines indicate the successful ablation points of the repeat PVAI (B).
From: A Case of a Figure of Eight Atrial Tachycardia after a Pulmonary Vein Antrum Isolation of Atrial Fibrillation