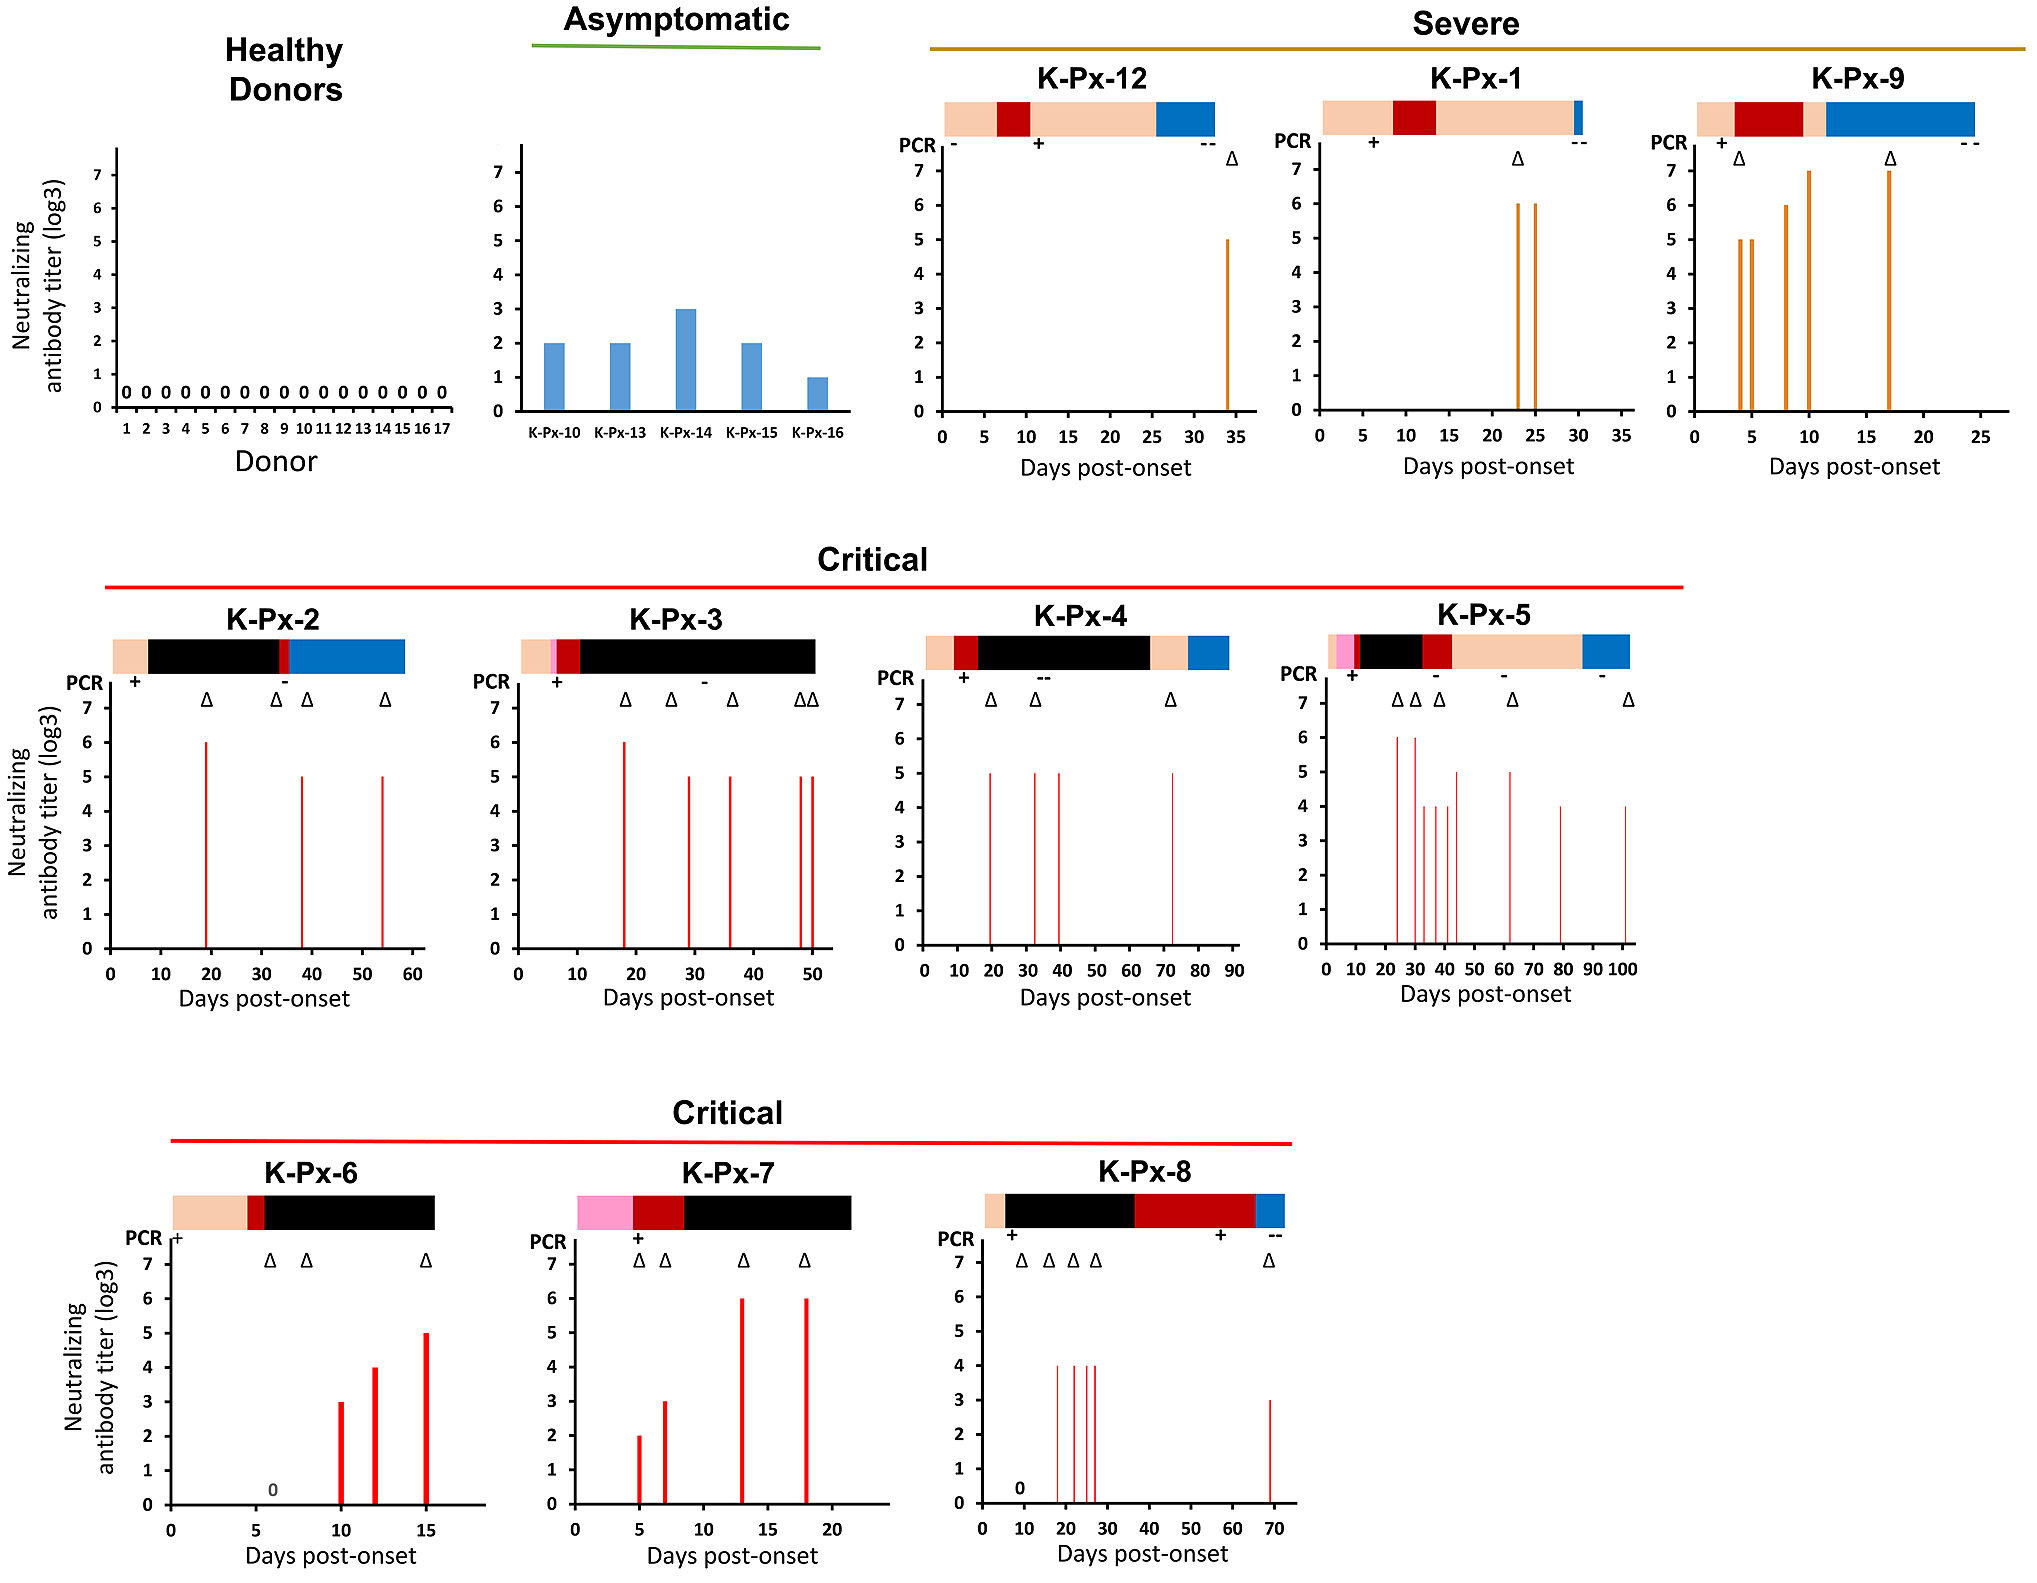
Figure 1. Neutralizing antibody titers of the COVID-19 patients’ sera. (Cited and modified from Tjan LH, Nagano T, Furukawa K, et al. The trend of neutralizing antibody response against SARS-CoV-2 and the cytokine/chemokine release in patients with differing severities of COVID-19: all individuals infected with SARS-CoV-2 obtained neutralizing antibody. medRxiv. 2020 (19). Copyright of the figure belongs to the authors.)
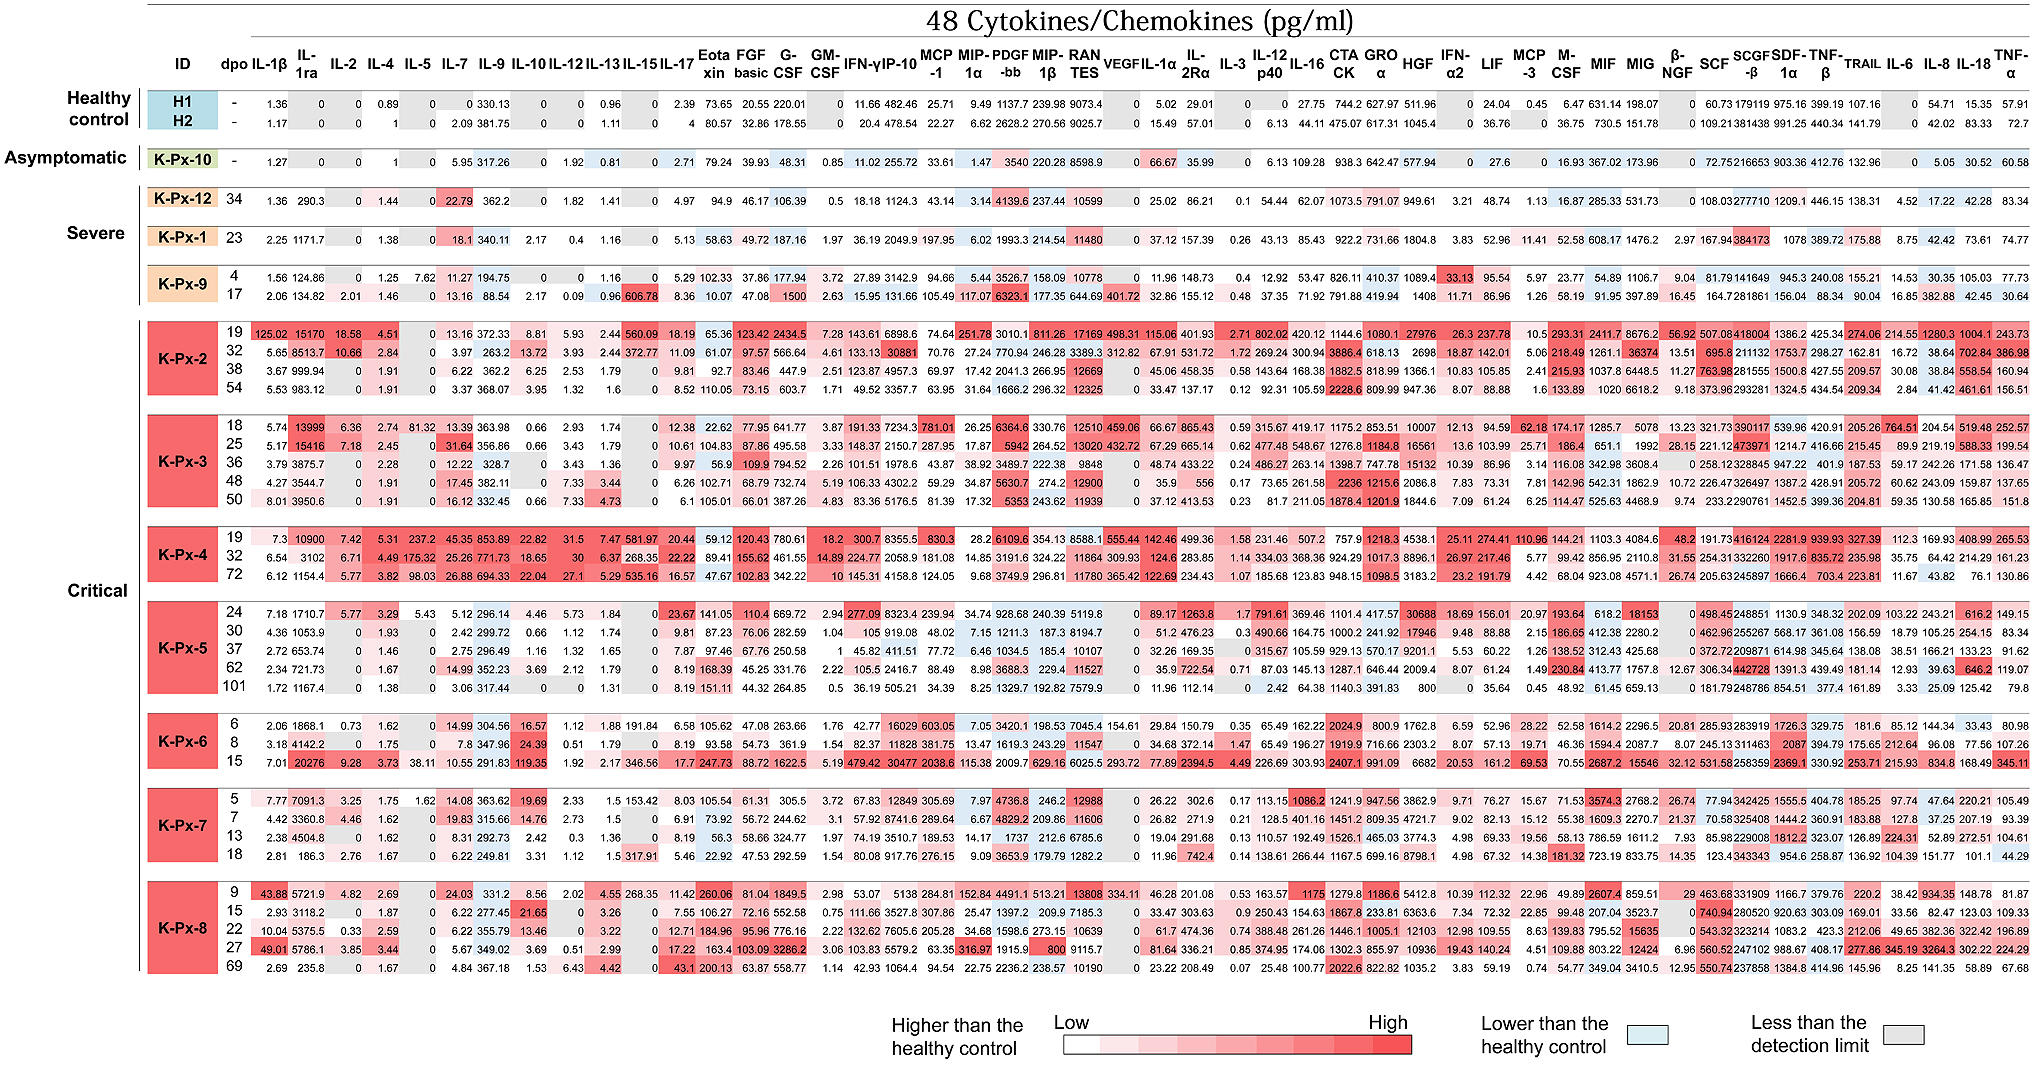
The neutralizing antibody titers against SARS-CoV-2 were measured for the patients’ sera. Each panel includes the results for the sera obtained from the indicated patient at a single or several time point(s). The top bars of each panel indicate the symptom transition by colors as follows: Orange, upper respiratory symptoms without pneumonia; Pink, pneumonia not requiring oxygenation; Red, pneumonia requiring oxygenation; Black, severe symptoms requiring intensive care including mechanical ventilation; Blue, recovered with residual symptoms.The neutralizing antibody titers of the control sera obtained from 17 healthy donors and 5 asymptomatic patients are also included. The numbers marked as 0 (zero) in the panel indicates that no neutralizing activity has been detected. The open arrowheads below the top bar indicate the time point(s) of cytokine/chemokine measurement presented in Figure 2.
From: The Neutralizing Antibody Response against Severe Acute Respiratory Syndrome Coronavirus 2 and the Cytokine/Chemokine Release in Patients with Different Levels of Coronavirus Diseases 2019 Severity: Cytokine Storm Still Persists Despite Viral Disappearance in Critical Patients