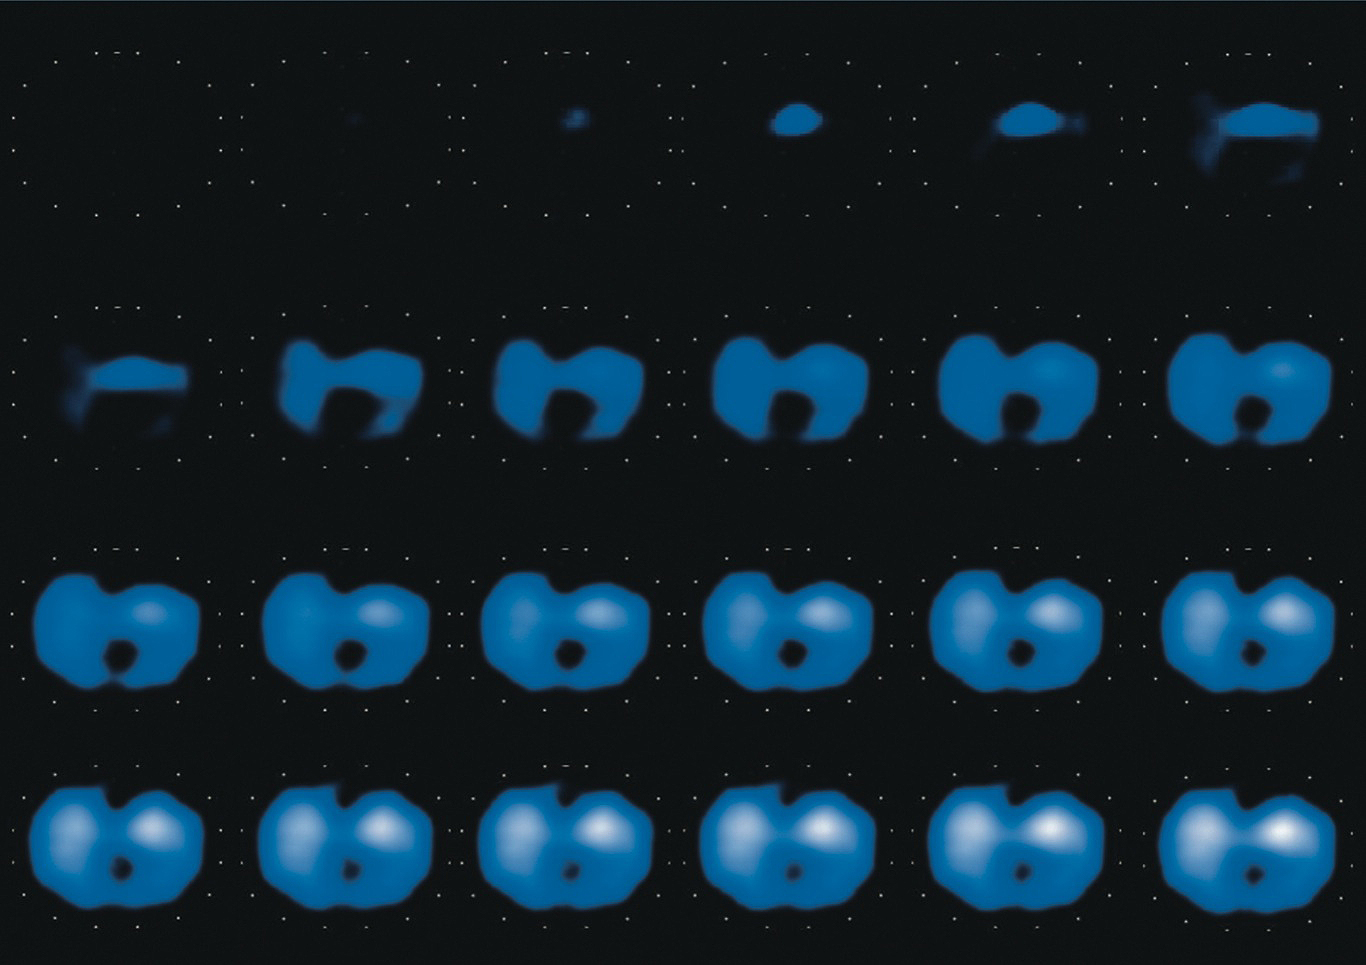
Figure 2. Serial static images of ventilation distribution from the start to the end of inspiration measured using electrical impedance tomography. The ventilated region is colored from blue (normally ventilated) to white (maximally ventilated), depending on the degree of the measured impedance value. Nonventilated regions are colored black. In this case, ventilation begins in ventral regions, and ventilation is distributed more to ventral than dorsal regions at the end of inspiration.