Figure 2. Box plot shows the rate of improvement in the control group (n = 34) and the immunonutritional support group (n = 34). (a) BMI: There was no significant difference between the two groups. (b) GNRI: The rate of improvement was significantly higher in the immunonutritional support group than in the control group (p = 0.0124). (c) PNI: The rate of improvement was significantly higher in the immunonutritional support group than in the control group (p = 0.0379).
From: Impact of Preoperative Immunonutritional Support in Patients Undergoing Elective Thoracic Surgery
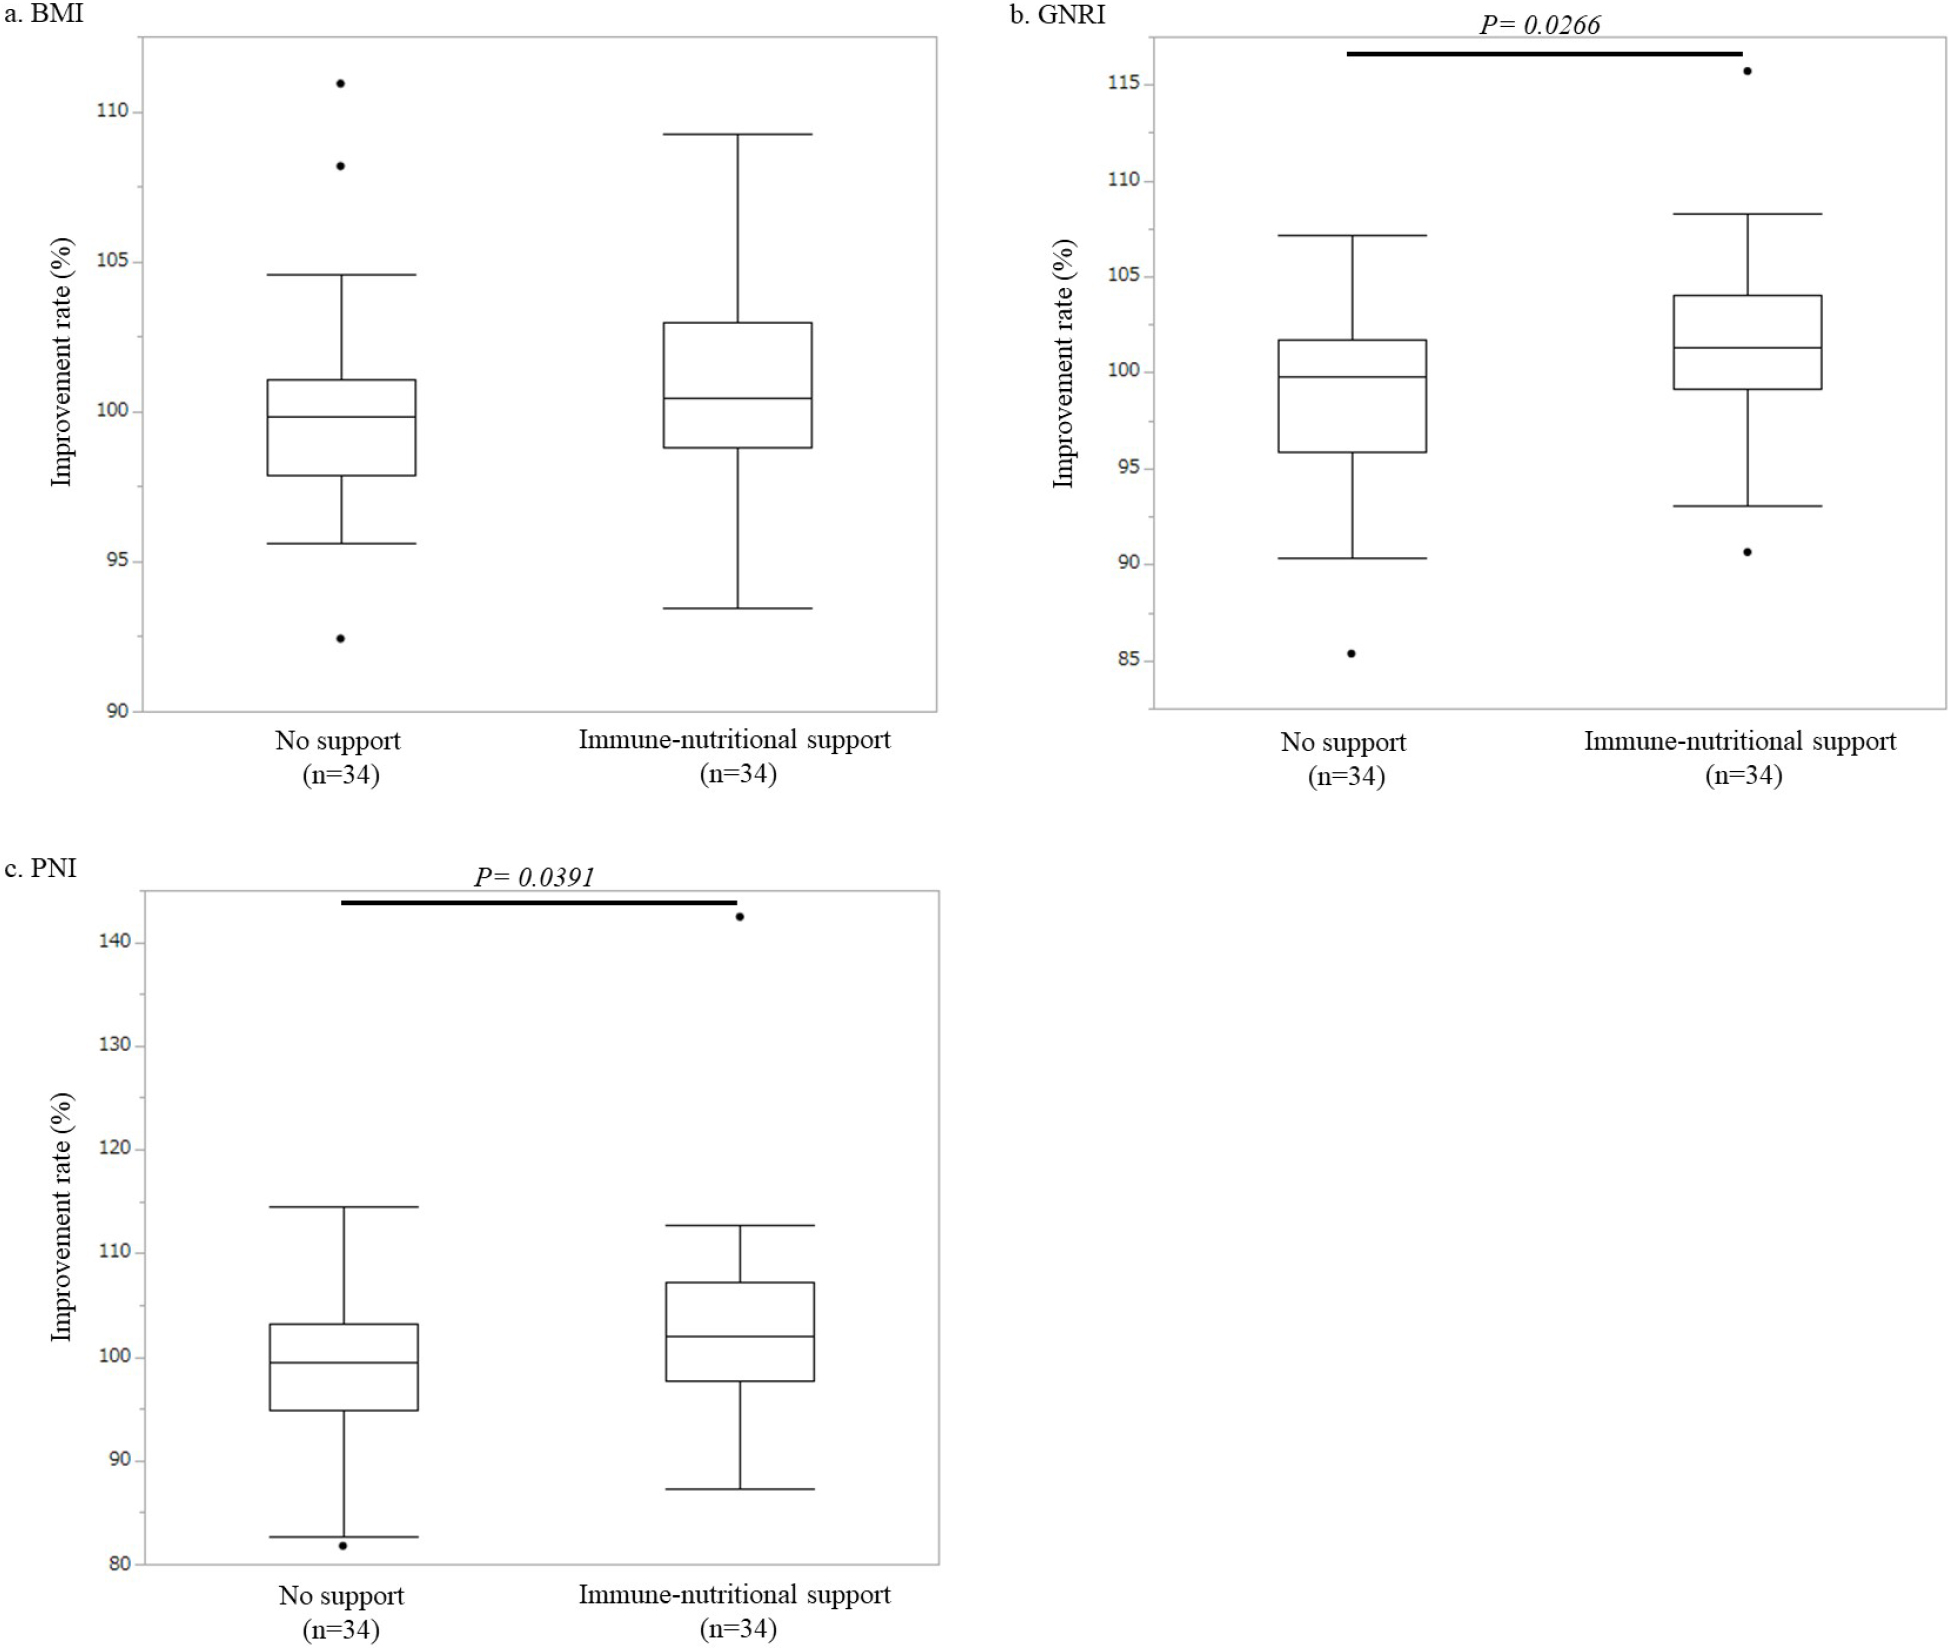
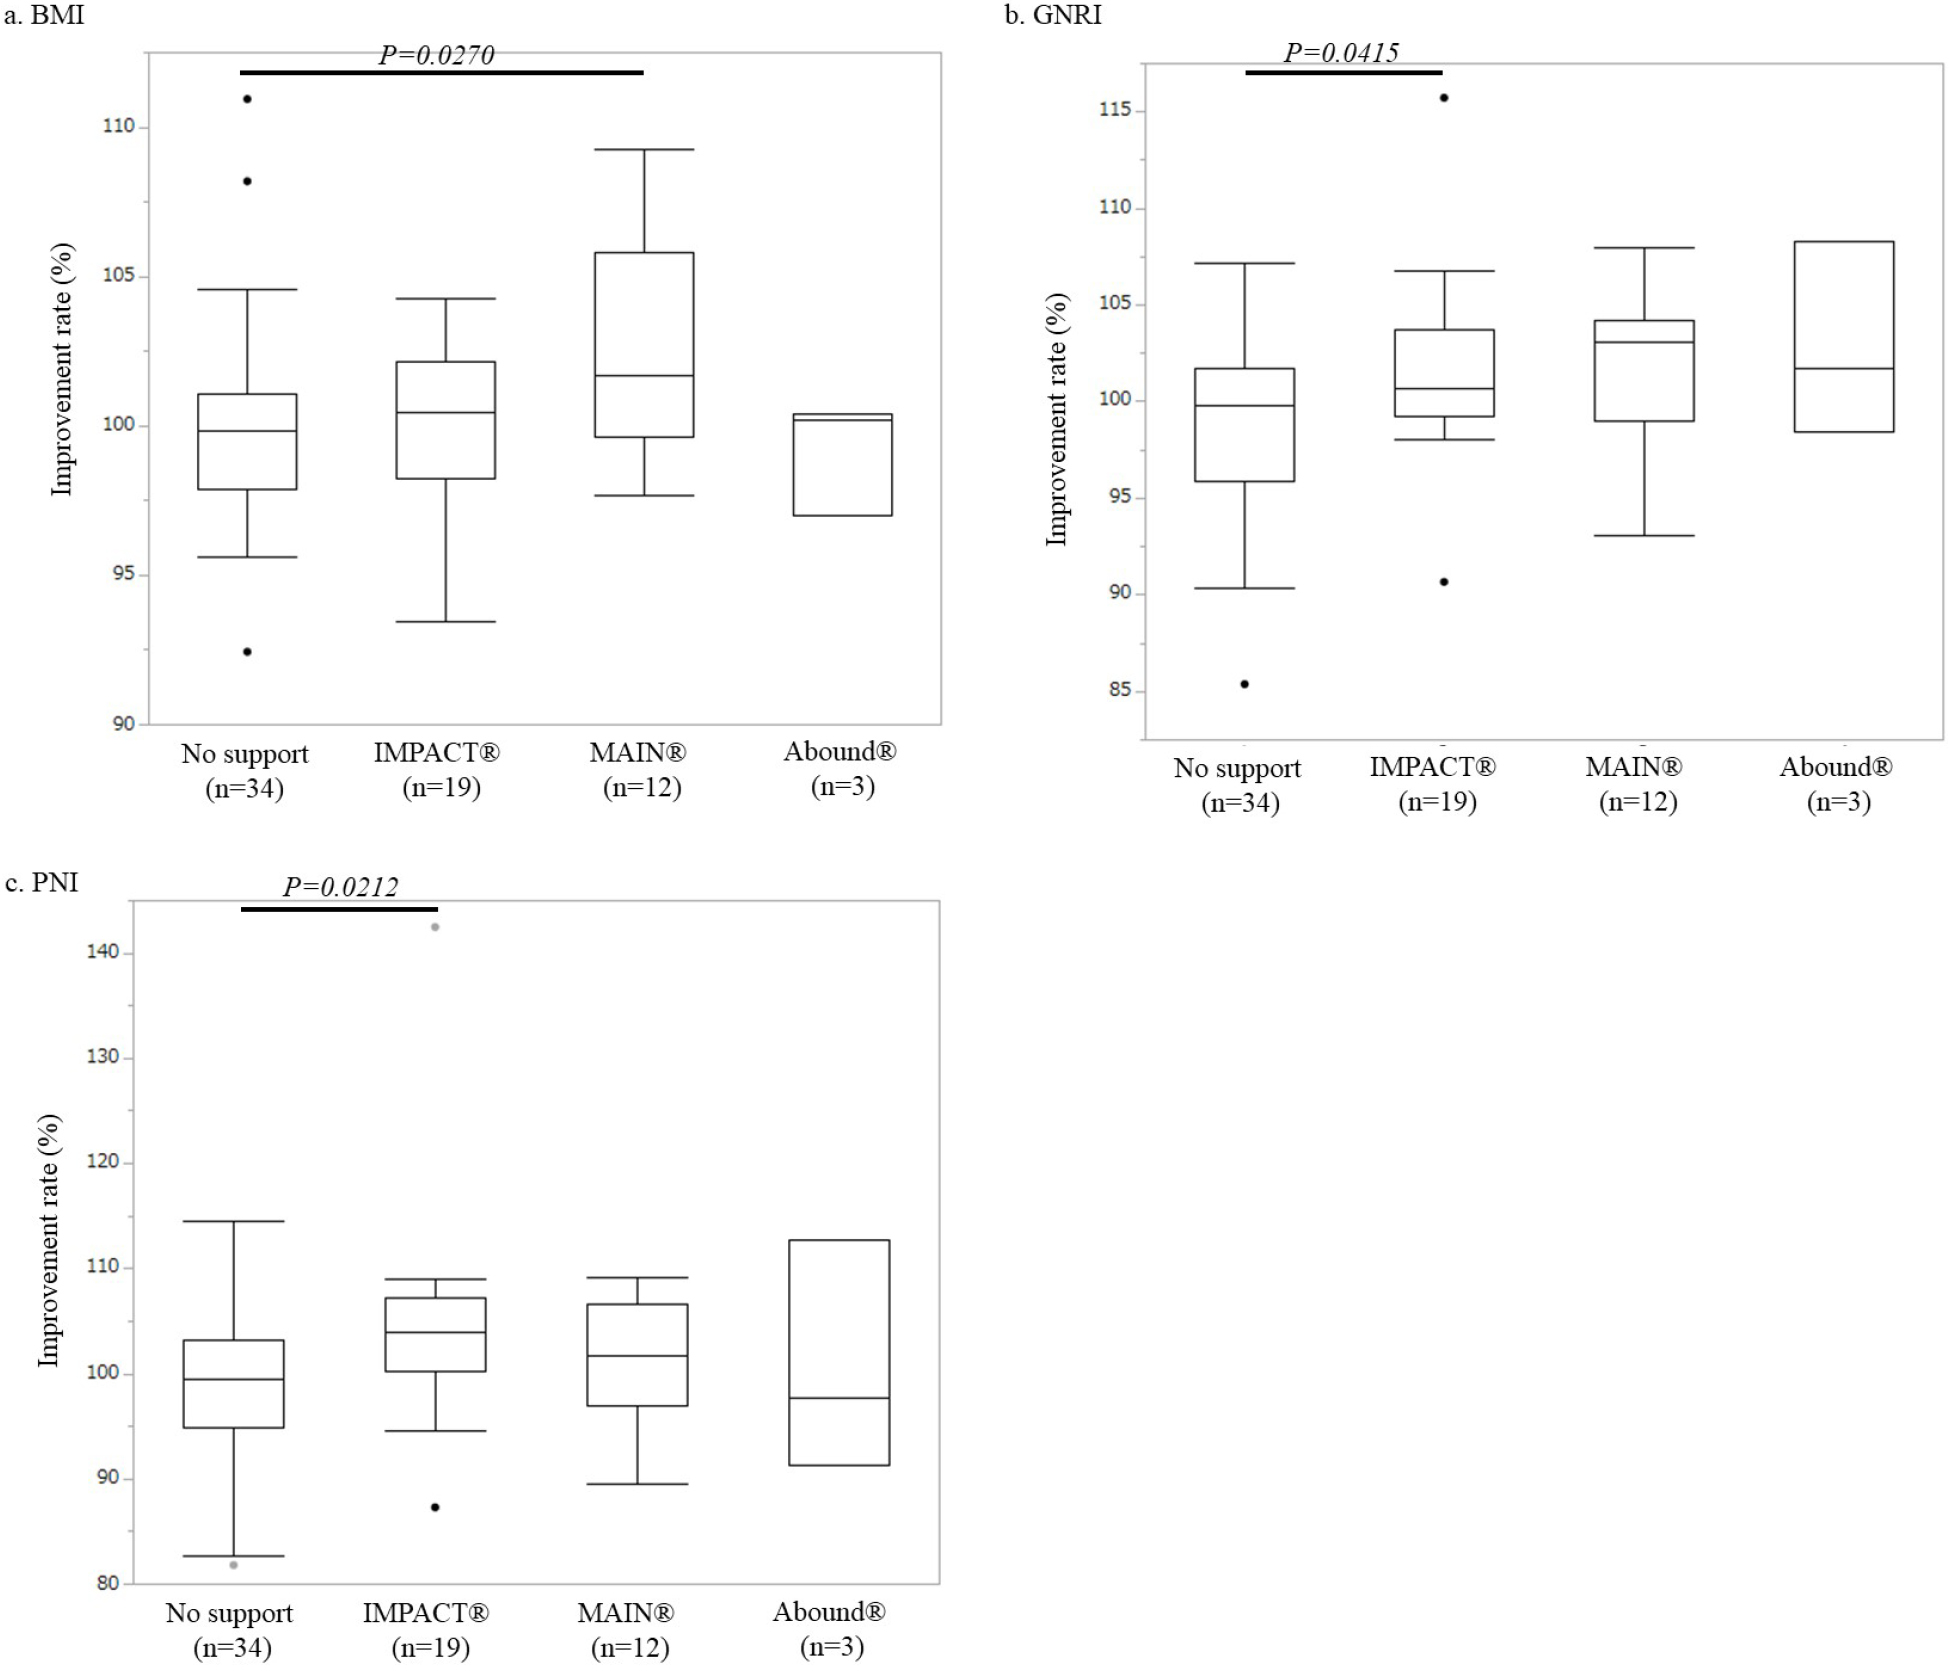
Figure 3. Box plot shows the improvement rate in the control group (n = 34) and each immunonutritional support group [the IMPACTⓇ support group (n = 19), the MEINⓇ support group (n = 12), and the AboundⓇ support group (n = 3)]. (a) BMI: The improvement rate was significantly higher in the MEINⓇ support group than in the control group (p = 0.0270). (b) GNRI: The improvement rate was significantly higher in the IMPACTⓇ support group than in the control group (p = 0.0415). (c) PNI: The improvement rate was significantly higher in the IMPACTⓇ support group than in the control group (p = 0.0212).
From: Impact of Preoperative Immunonutritional Support in Patients Undergoing Elective Thoracic Surgery