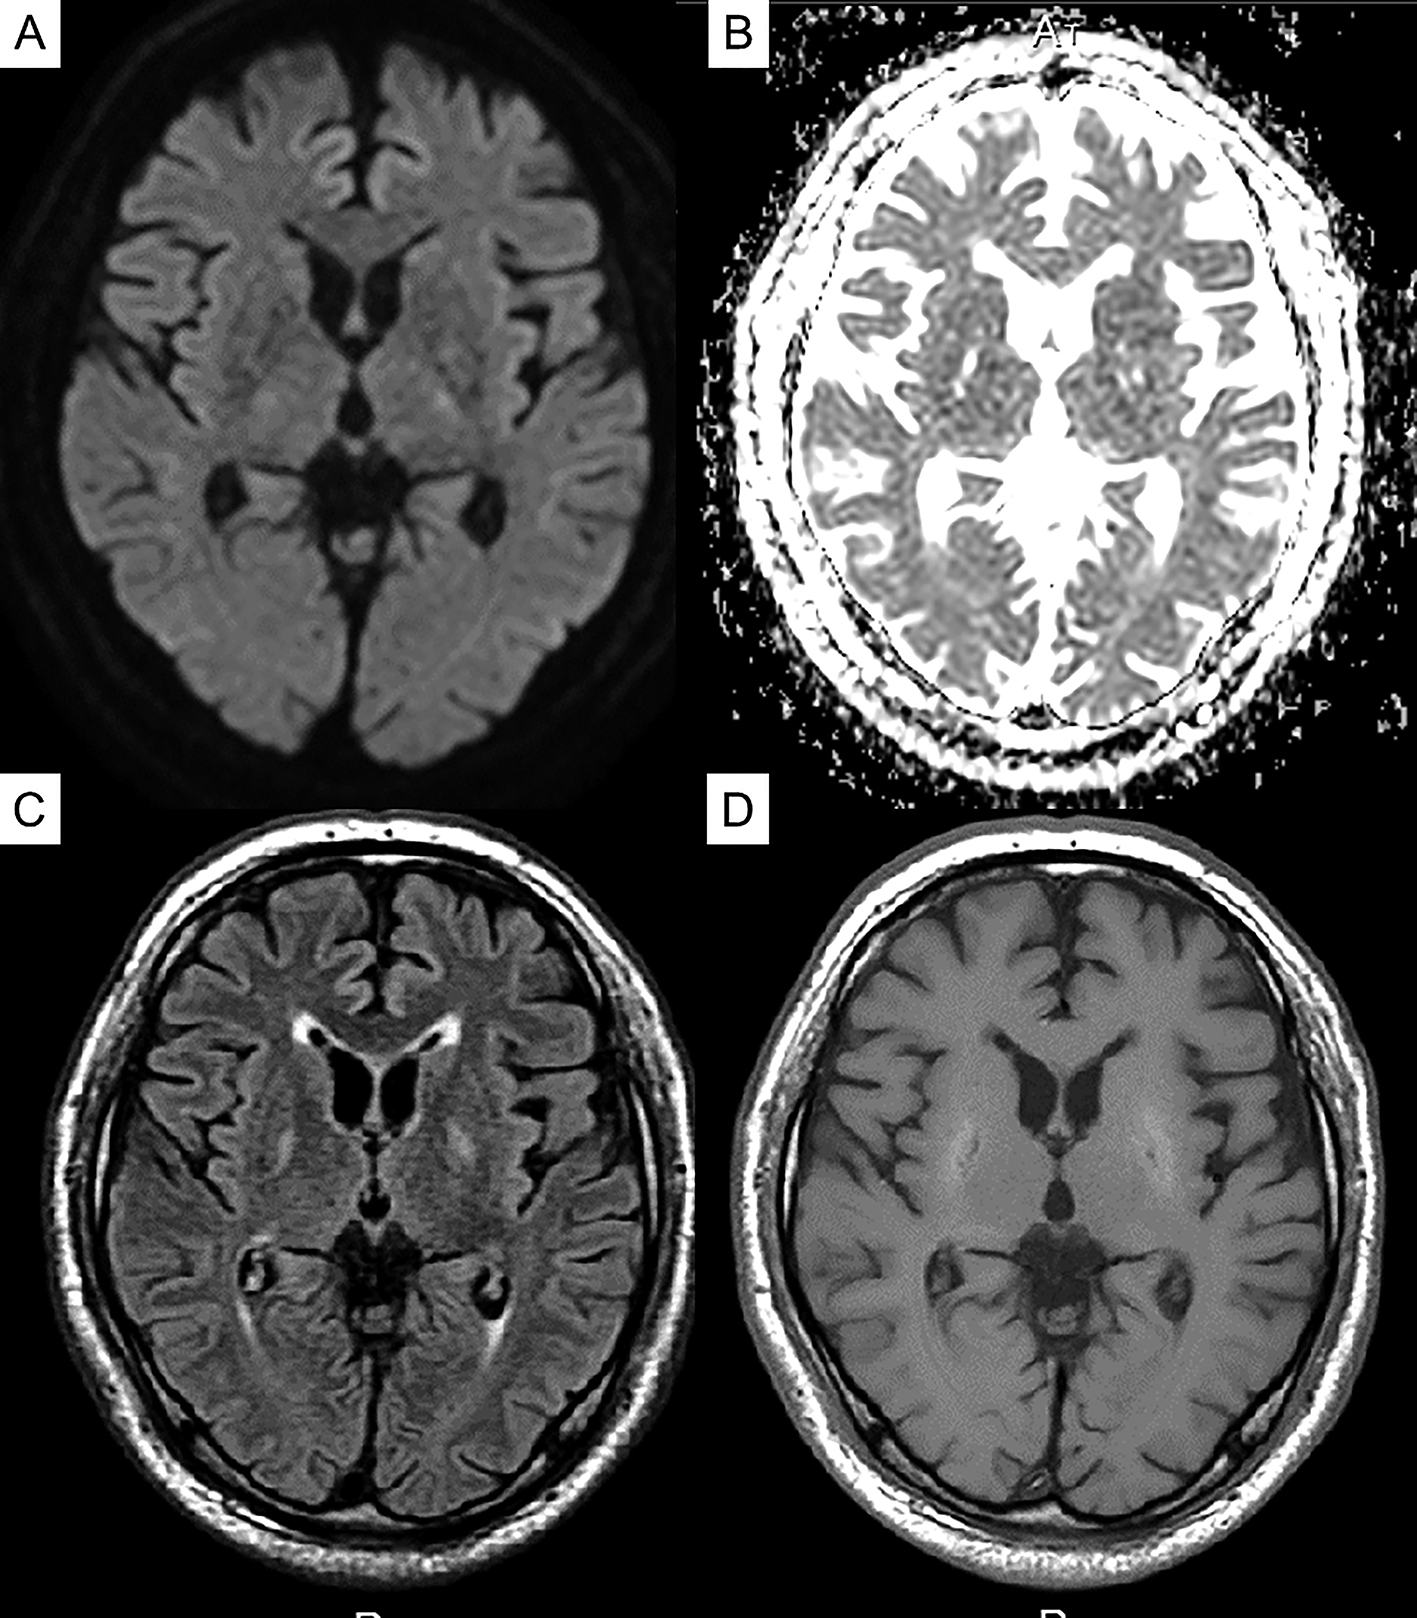
Figure 1. Axial brain magnetic resonance imaging (MRI) on admission. (A) Diffusion-weighted image revealing mild symmetrical restricted diffusion over both basal ganglia. (B) The lesion was hyperintense on the apparent diffusion coefficient map. (C) Fluid-attenuated inversion recovery image showing hyperintensity in the lentiform nuclei and head of the caudate nuclei with surrounding edema in the internal, external, and extreme capsule regions. (D) T1-weighted magnetic resonance image demonstrating slight low-signal changes.
From: Diabetic Uremic Syndrome Presenting Reversible Parkinsonism with Bilateral Basal Ganglia Lesions: A Case Report
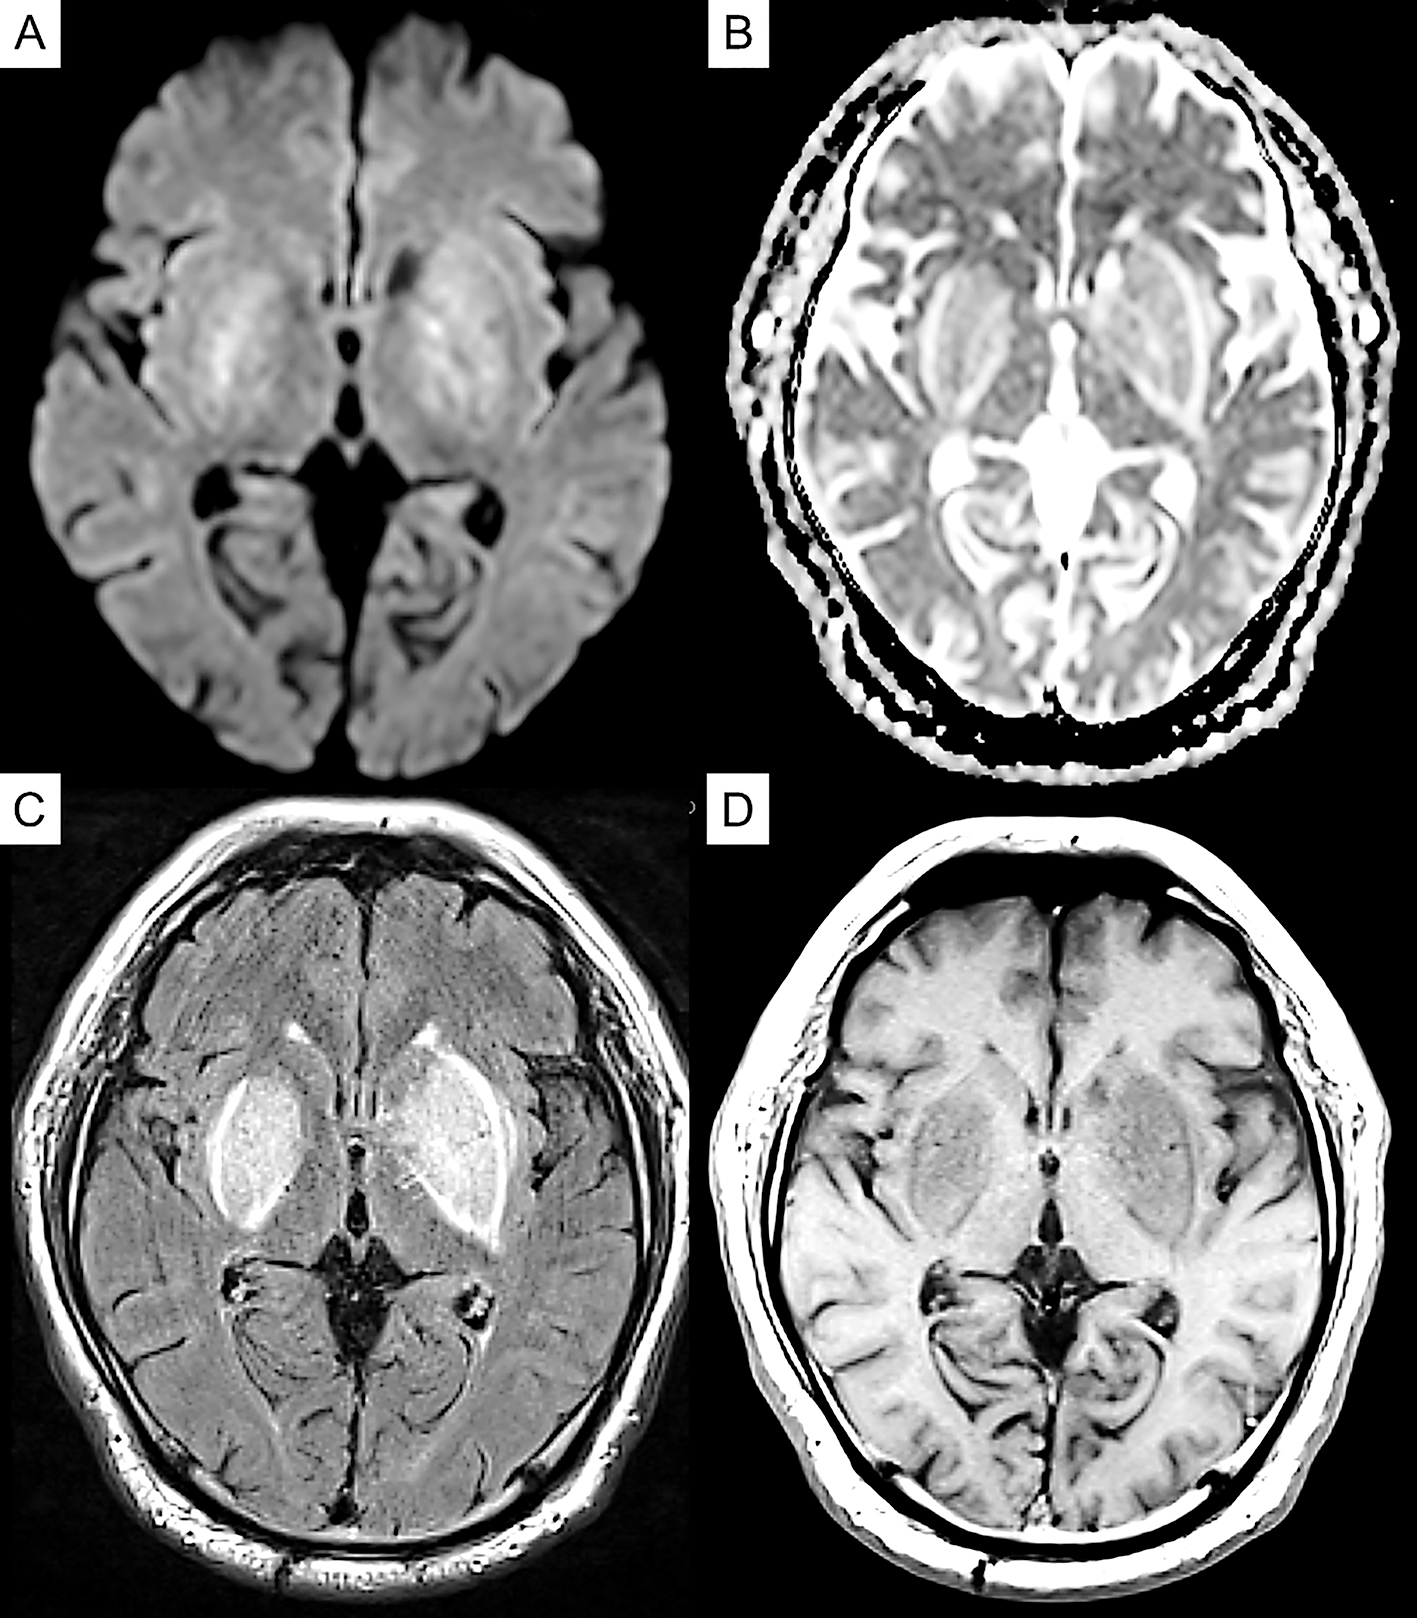
Figure 3. Follow-up magnetic resonance imaging (MRI) obtained on day 30 after admission. (A) Diffusion-weighted image. (B) Apparent diffusion coefficient (ADC) map. (C) Fluid-attenuated inversion recovery (FLAIR) image. (D) T1-weighted image. FLAIR revealing a slightly high signal in both basal ganglia, which were significantly weaker than the initial MRI signal. FLAIR image and ADC map revealing a slit-like high intensity in the globus pallidus; the intensity of these same areas was decreased on T1-weighted images.
From: Diabetic Uremic Syndrome Presenting Reversible Parkinsonism with Bilateral Basal Ganglia Lesions: A Case Report