Figure 1. Waterfall plot of the maximum decline in PSA during second-line treatment for patients with castration-resistant prostate cancer treated with androgen receptor pathway inhibitor (ARPI), docetaxel (DTX), and radium-223 (Ra-223).

From: Anticancer Effect of Second-line Treatment for Castration-Resistant Prostate Cancer Following First-line Treatment with Androgen Receptor Pathway Inhibitors

Figure 2. Kaplan-Meier survival curve for patients treated with androgen receptor pathway inhibitor (ARPI), docetaxel (DTX), and radium-223 (Ra-223) as second-line treatment in terms of progression-free survival (A), propensity score-matched progression-free survival (B), and overall survival (C).

From: Anticancer Effect of Second-line Treatment for Castration-Resistant Prostate Cancer Following First-line Treatment with Androgen Receptor Pathway Inhibitors

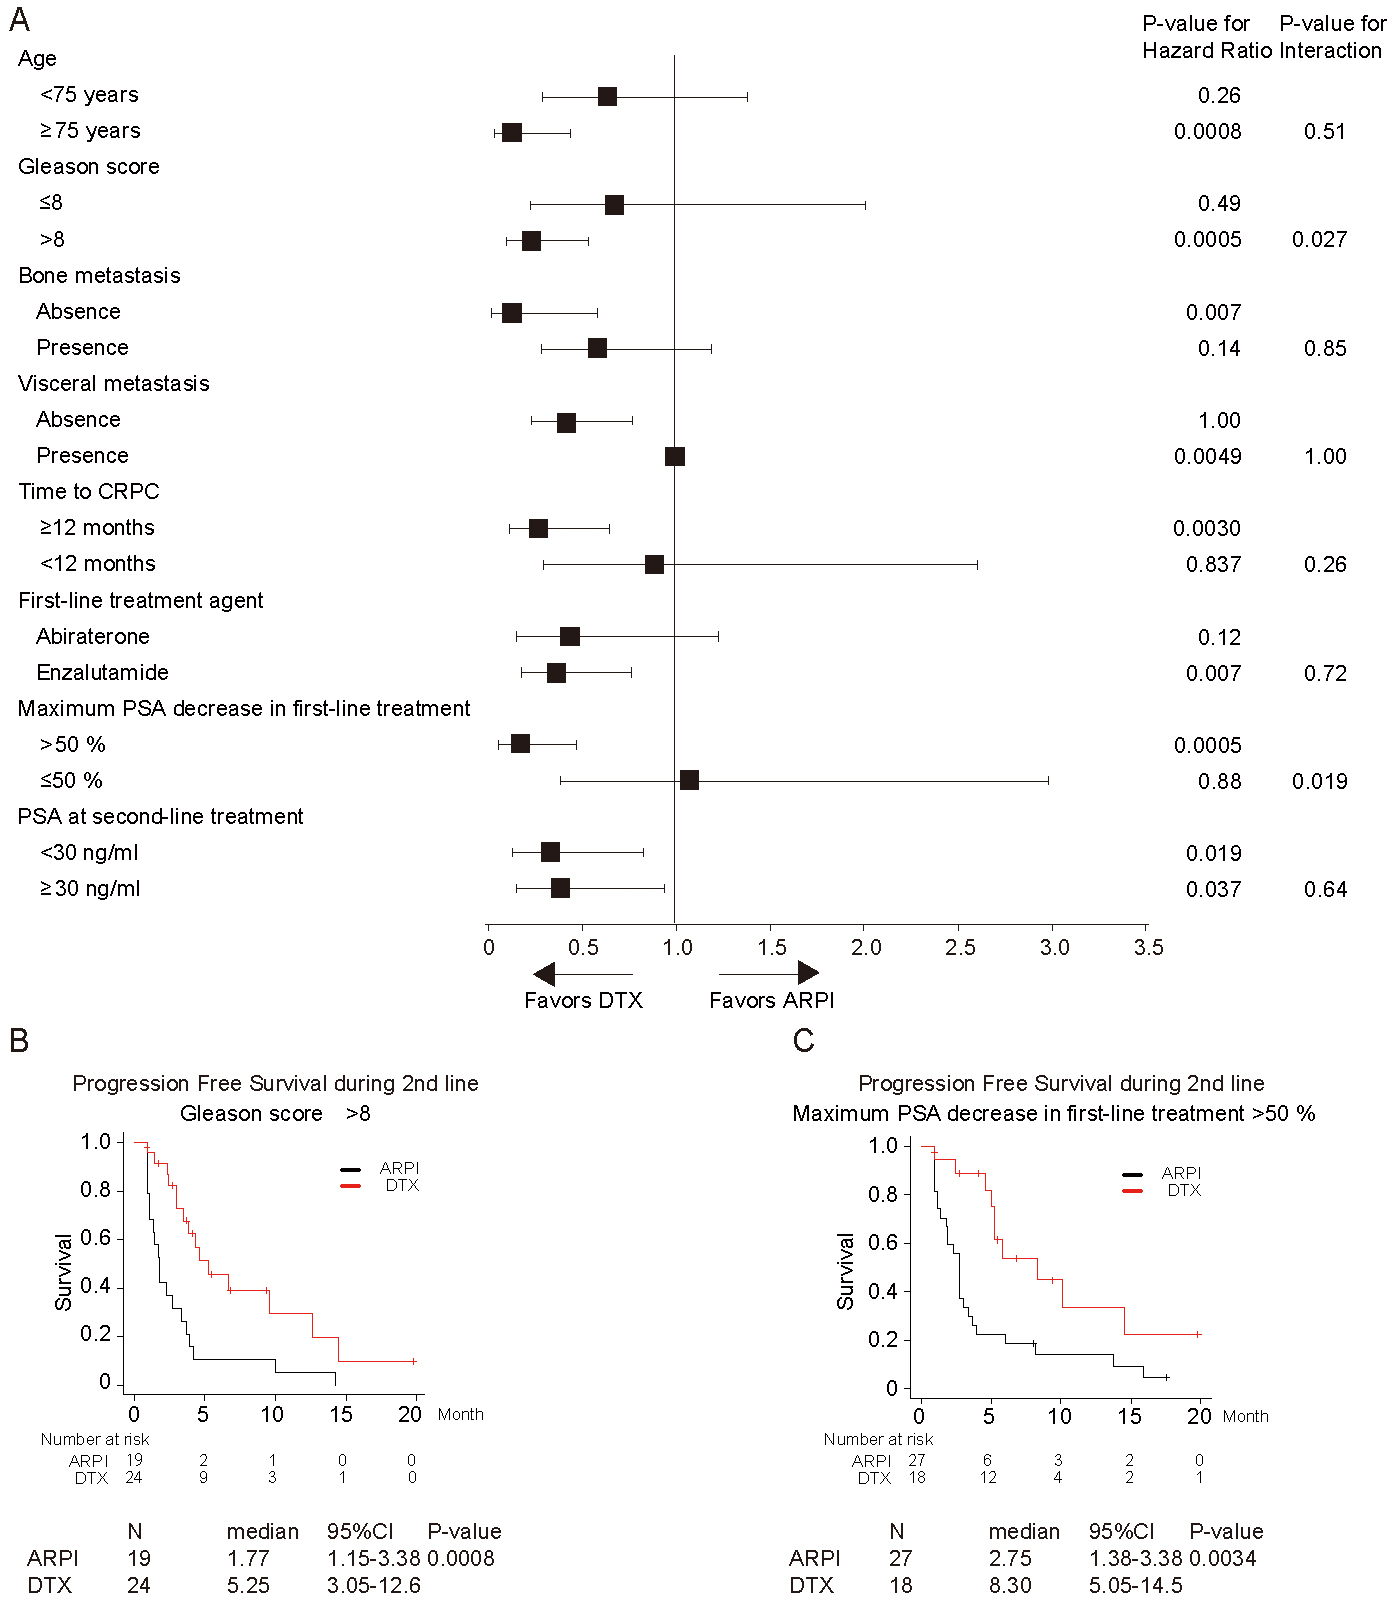
Figure 3. Subgroup analysis of progression-free survival for patients treated with androgen receptor pathway inhibitor (ARPI), docetaxel (DTX). The hazard rate (■) with 95% CIs is plotted in forest plot (A). P-values for hazard ration and interaction test are shown stratified by age, Gleason score, bone metastasis, visceral metastasis, time to castration-resistant prostate cancer (CRPC), first-line treatment agent, maximum PSA decrease in first-line treatment, and PSA at second-line treatment. Kaplan-Meier survival curves of progression-free survival in patients with castration-resistant prostate cancer stratified by Gleason score (> 8) (B) and maximum PSA decrease in first-line treatment (C).

From: Anticancer Effect of Second-line Treatment for Castration-Resistant Prostate Cancer Following First-line Treatment with Androgen Receptor Pathway Inhibitors

PAGE TOP