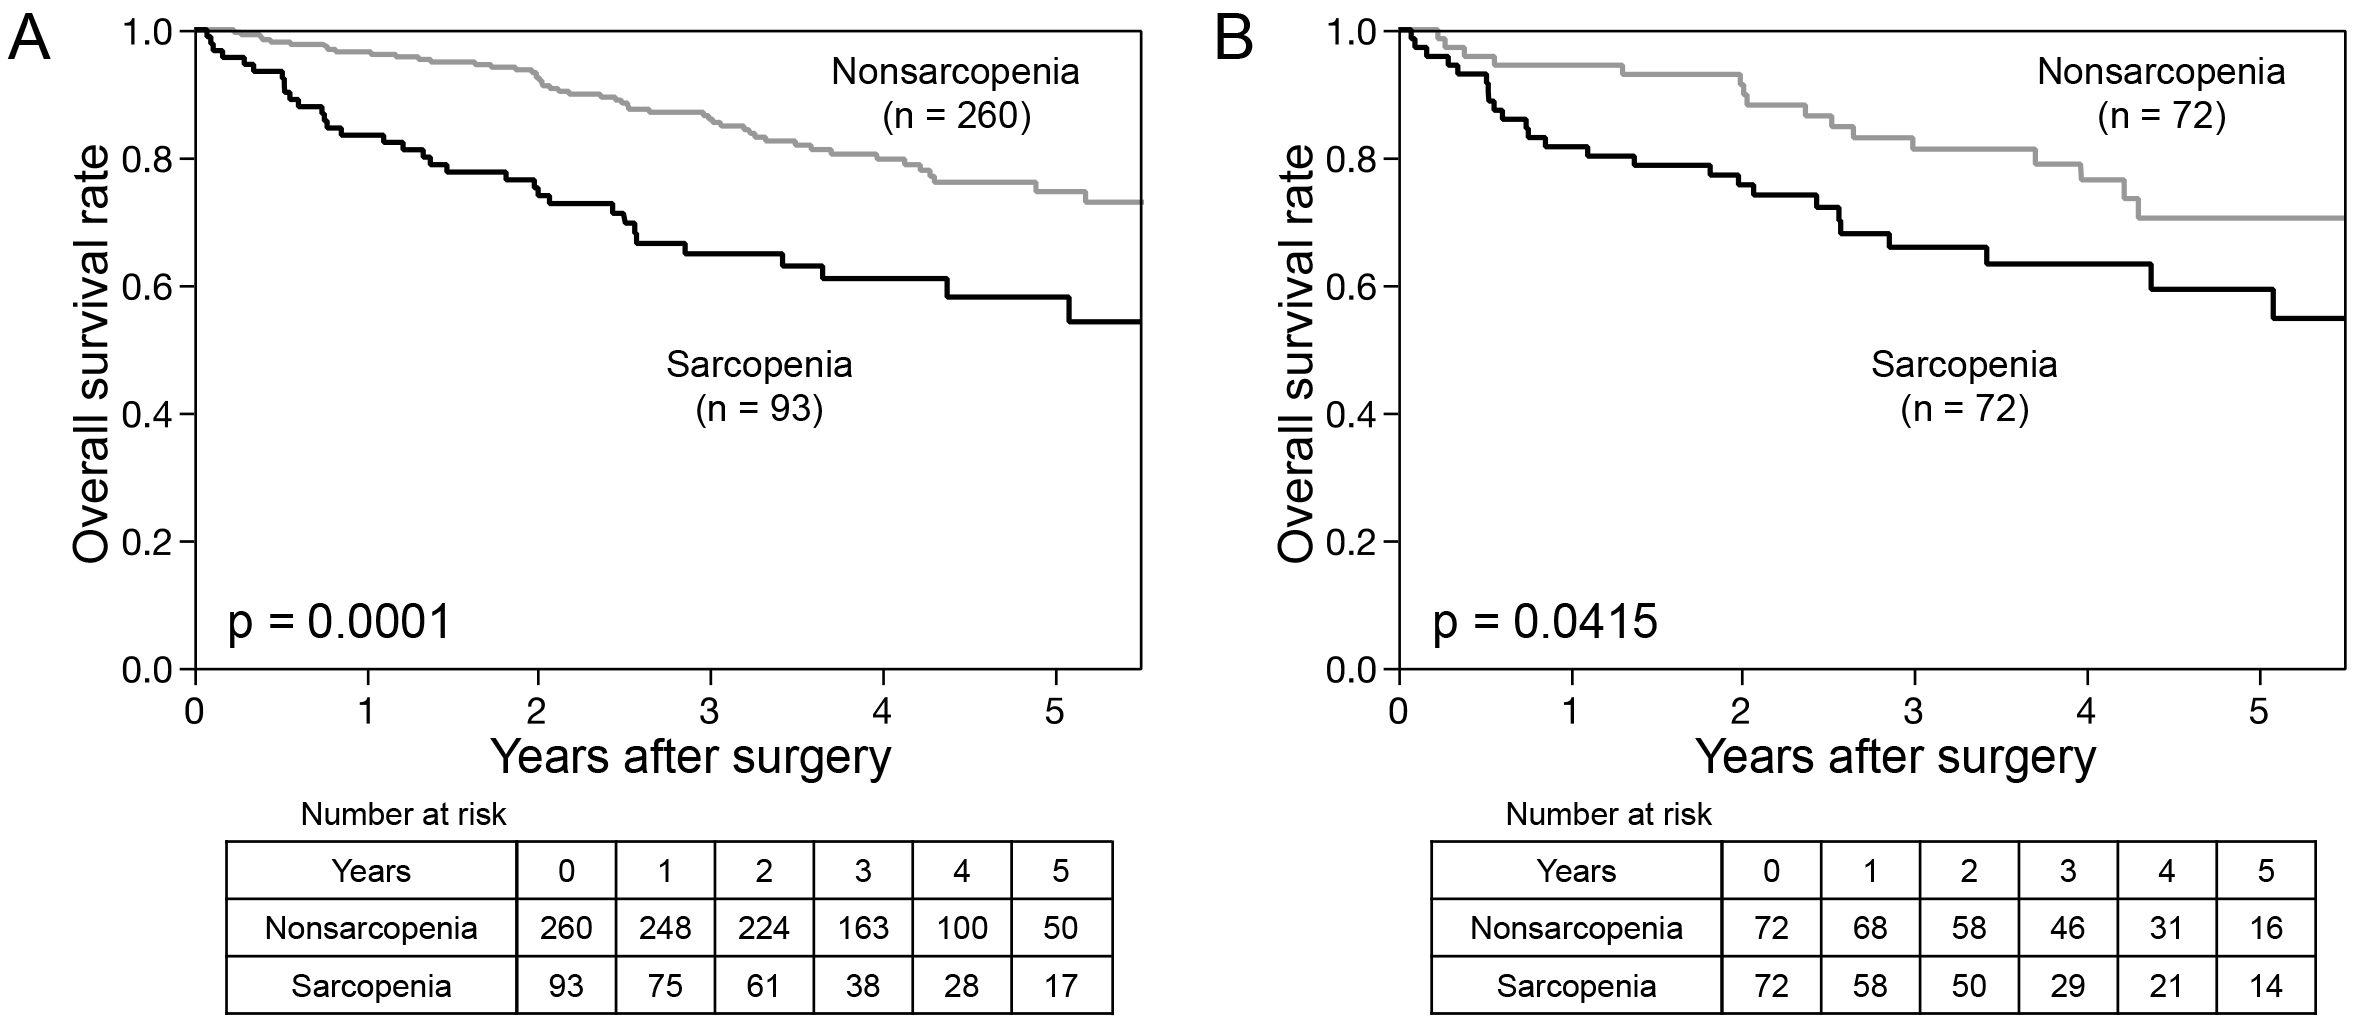
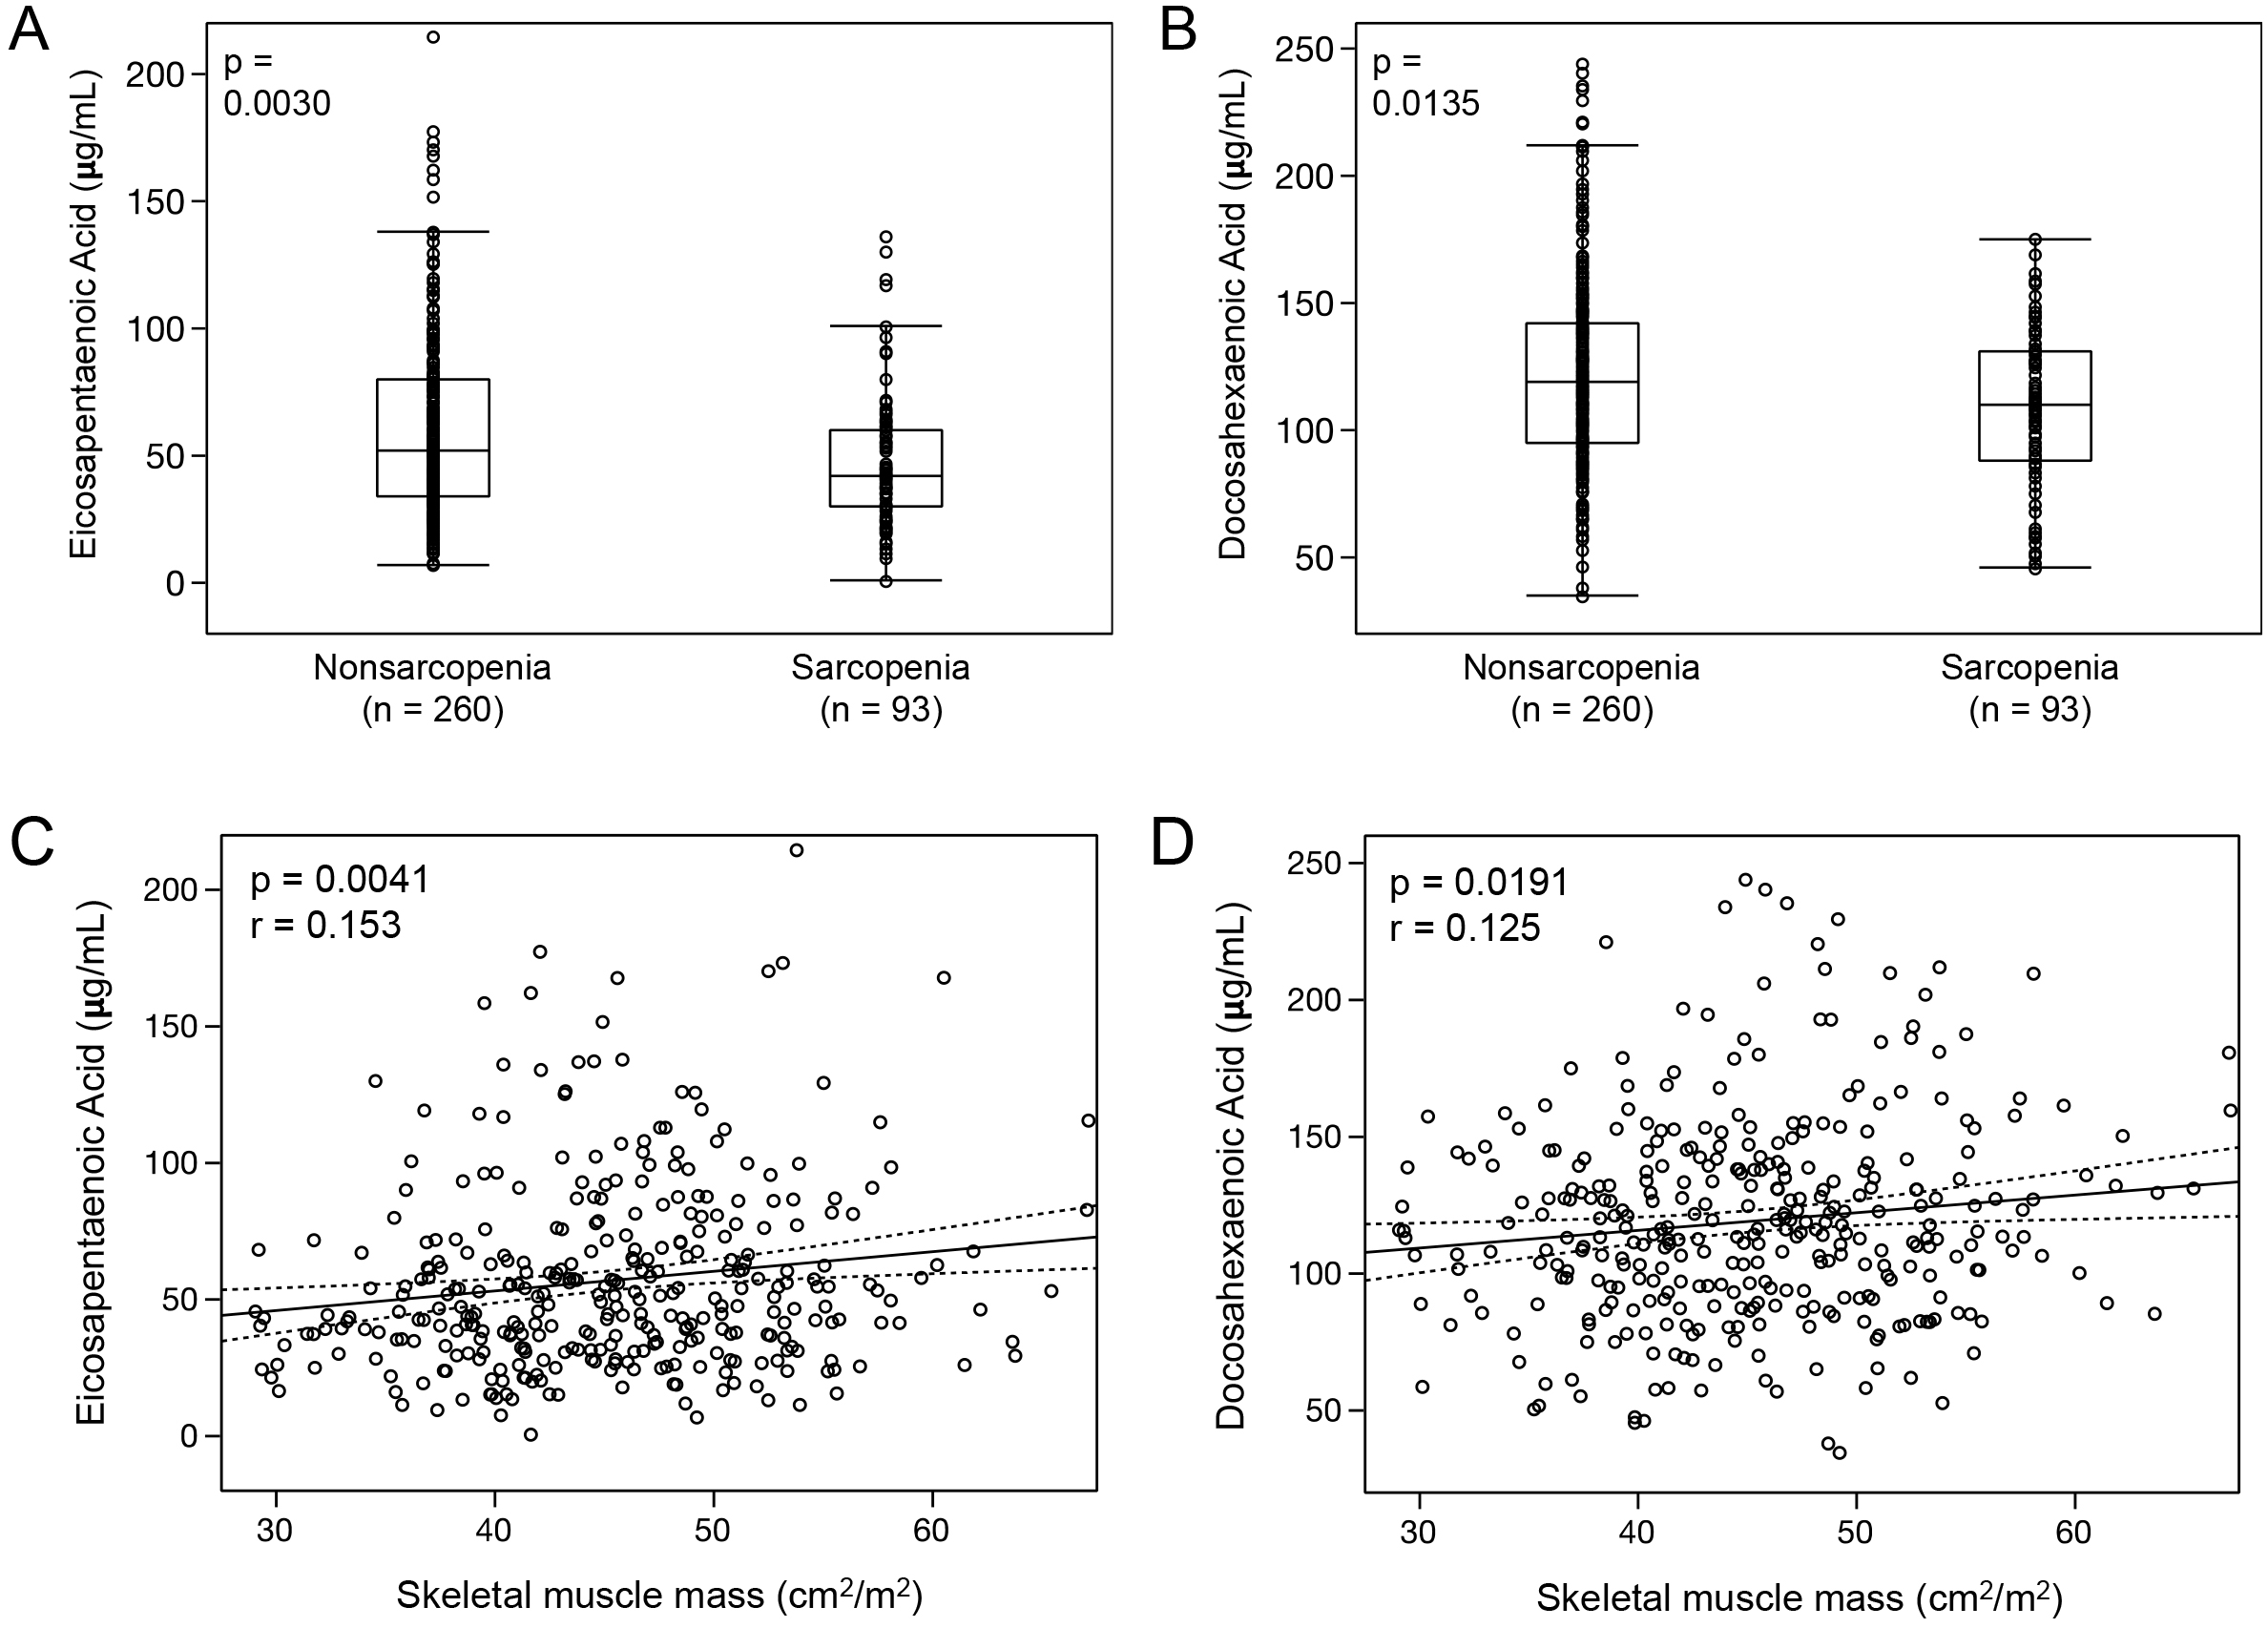
Figure 2. Distributions of eicosapentaenoic acid and docosahexaenoic acid on the basis of skeletal muscle mass as a categorical (A and B) or continuous (C and D) variable.
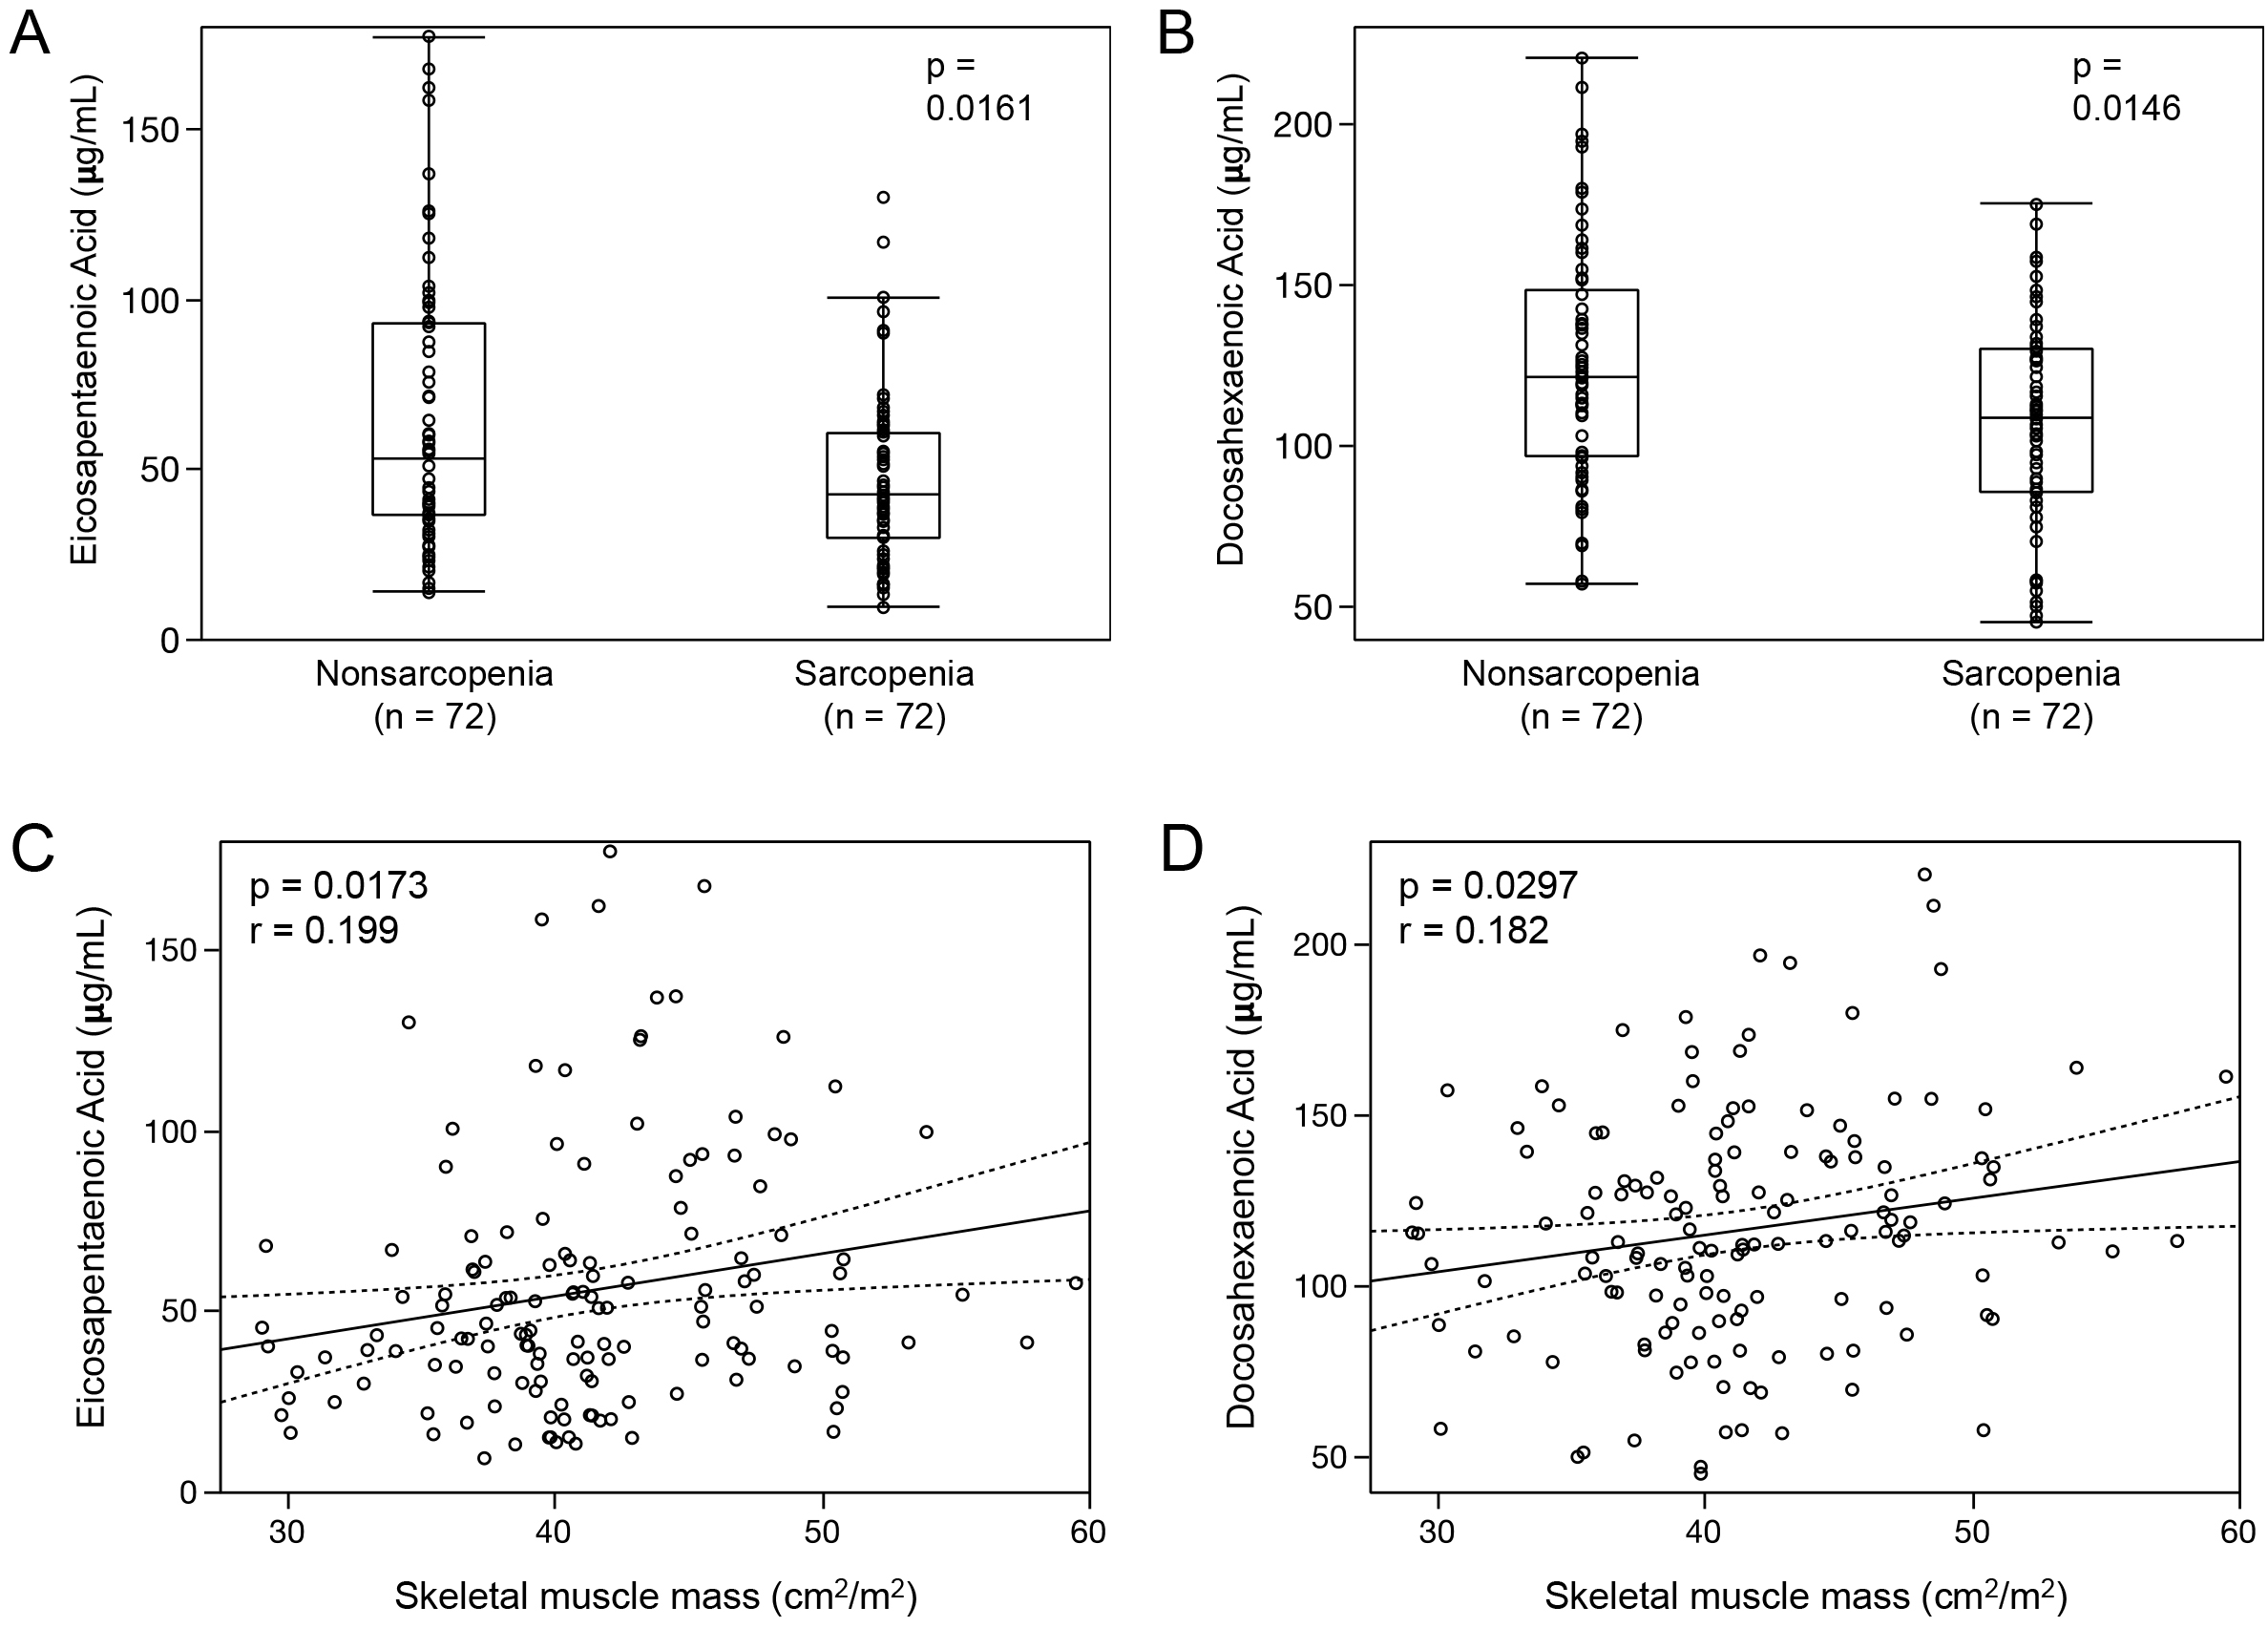
Figure 3. Distributions of eicosapentaenoic acid and docosahexaenoic acid on the basis of skeletal muscle mass as a categorical (A and B) or continuous (C and D) variable after propensity score matching analysis.