Figure 1. Timing of IR development.
IR occurred during Tmab administration in 15 cases; just as administration was being completed or immediately after completion of Tmab administration in eight cases; about one hour after completion of Pmab-Tmab administration in two cases. The symbols indicate the symptoms experienced by patients: chills are indicated by white circles; chills and vomiting by red circles; chills, fever, and vomiting by black circles; chills, fever, and fatigue by a blue circle; fever by white squares; fever and chills by red squares; fever and vomiting by a black square; hypertension and vomiting by a blue square; nausea and vomiting by white triangles; cough, chills, fever, and vomiting by a red triangle; and vomiting, diarrhea, and fever by a black triangle. Pmab, pertuzumab; Tmab, trastuzumab.
From: Exploring Predictive Risk Factors of Infusion Reactions with First Pertuzumab Administration in HER2-positive Breast Cancer Patients: A Single Institution Experience
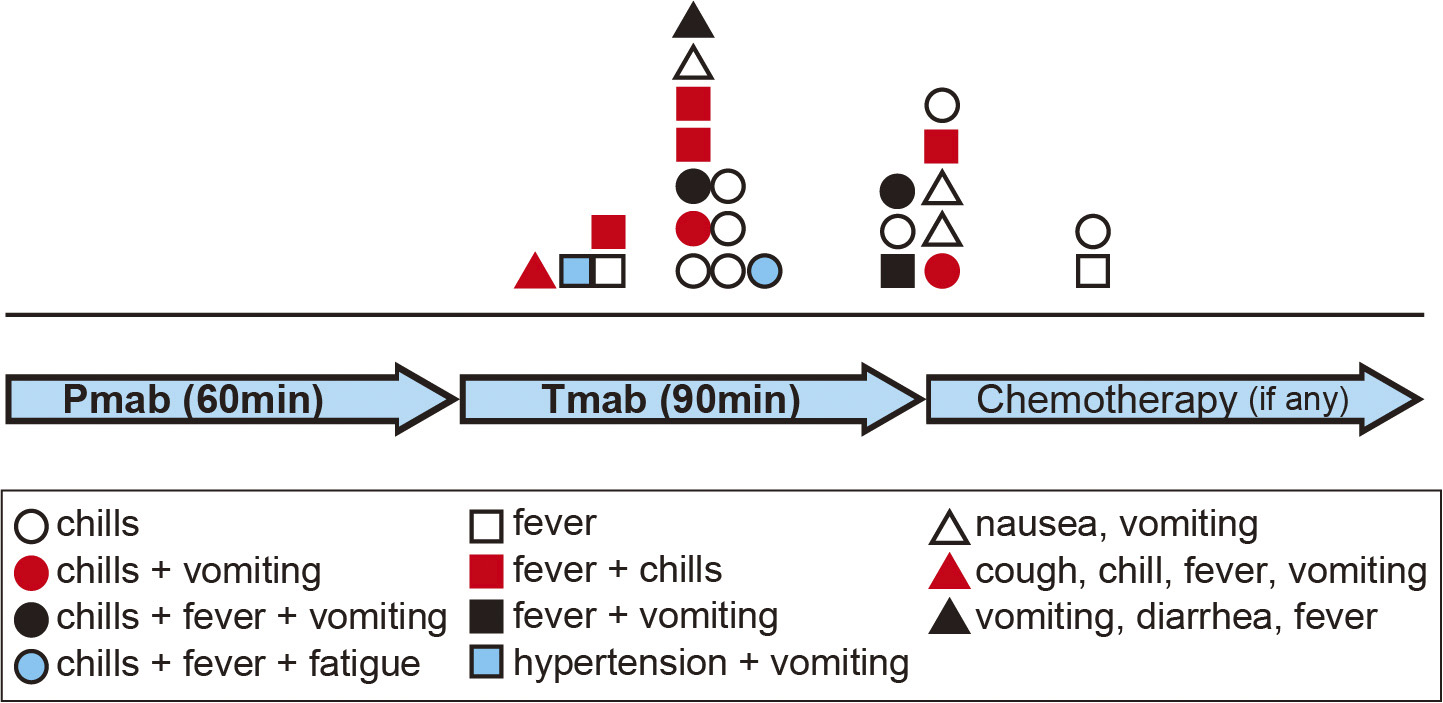
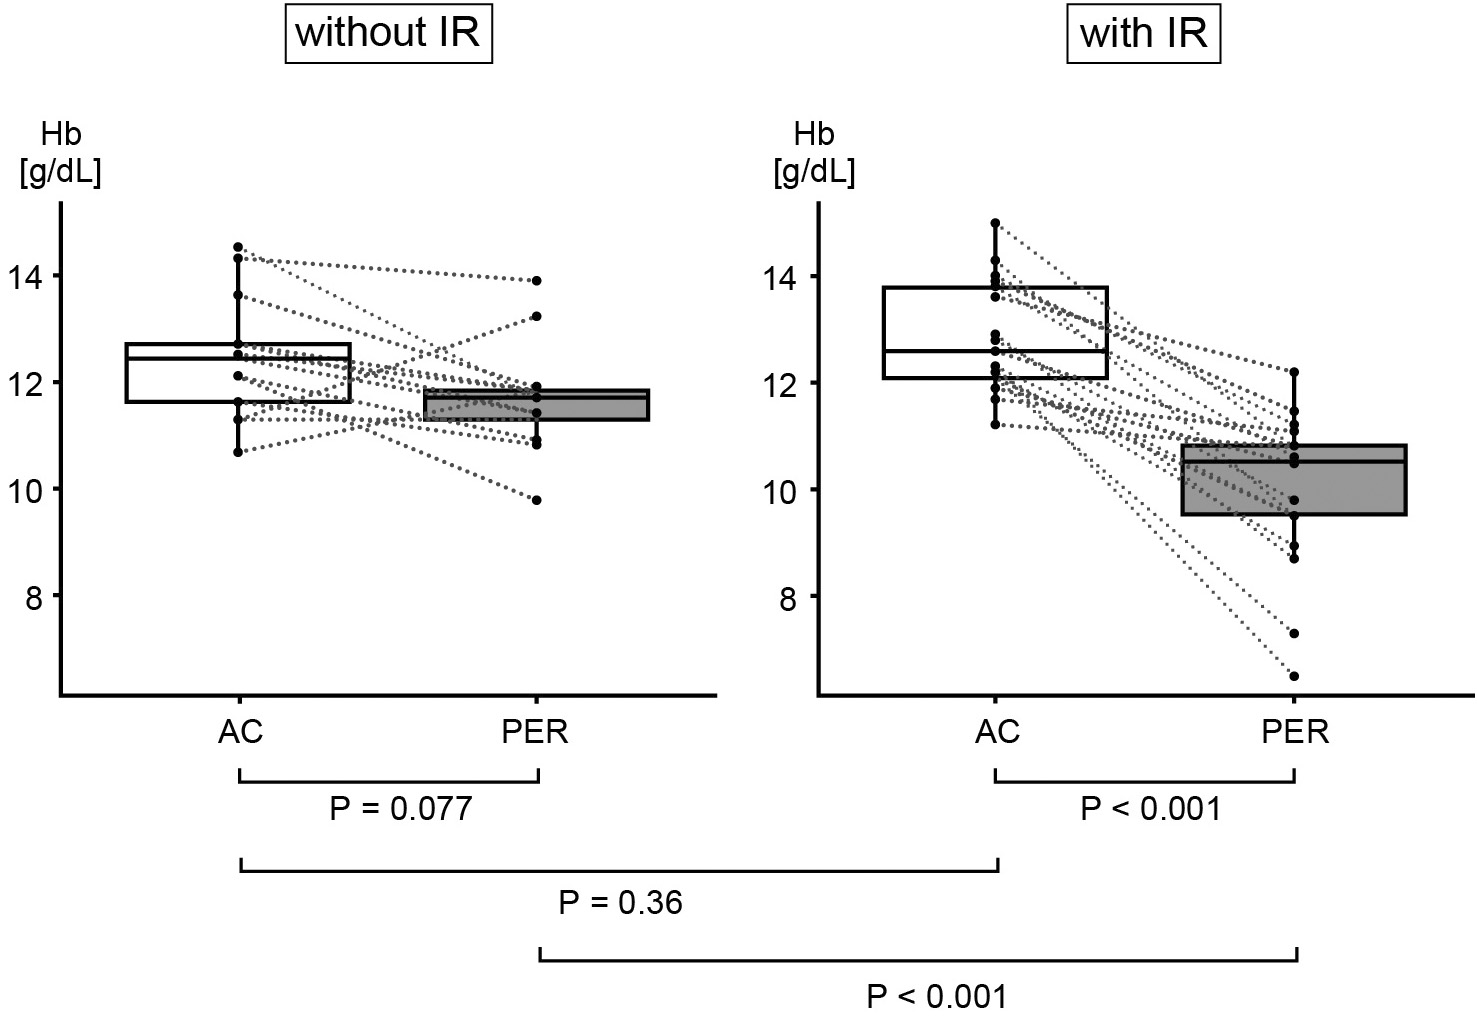
Figure 2. Changes in hemoglobin levels between the first dose of anthracycline and that of pertuzumab in patients who had received anthracycline treatment within the previous three months.
At the point of starting AC treatment, no significant difference in Hb level was found between the groups with and without IR (median 12.6 g/dL vs. 12.4 g/dL, P = 0.36). In the group with IR, Hb significantly decreased after completing the AC treatment (median 12.6 g/dL vs. 10.5 g/dL, P < 0.001). Hb tended to decline slightly after AC treatment in the IR-free group, but not significantly (median 12.4 g/dL vs. 11.7 g/dL, P = 0.077).
Bars in the boxes represent median values.
AC, anthracycline-cyclophosphamide; Hb, hemoglobin; IR, infusion reaction; PER, pertuzumab.
From: Exploring Predictive Risk Factors of Infusion Reactions with First Pertuzumab Administration in HER2-positive Breast Cancer Patients: A Single Institution Experience