Figure 1. (a) Chart to classify infectious medical waste and non-infectious waste in Japan, (b) RMW disposal flow, (c) Photos of RMW containers (20 L cuboid, 20 L cubic, 40 L, and 50 L volume capacities).

From: Motivation to Decrease Discharge Cost Results in Improper Discharge of Regulated Medical Wastes from Small Clinics: Inspectional and Statistical Evidence in the Tokyo Metropolitan Area

Figure 2. (a-f) Improper discharges of RMW containers [(a) Improper sealing, (b) Container deformation, (c) Container contamination, (d) Container damaging, (e) Overflow, (f) Needle penetration], and (g) Locations of surveyed medical institutions.

From: Motivation to Decrease Discharge Cost Results in Improper Discharge of Regulated Medical Wastes from Small Clinics: Inspectional and Statistical Evidence in the Tokyo Metropolitan Area

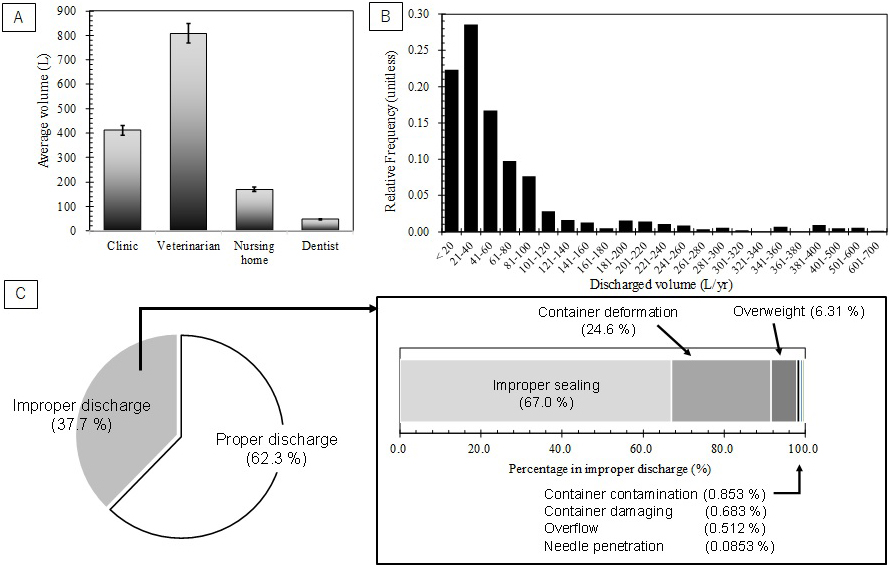
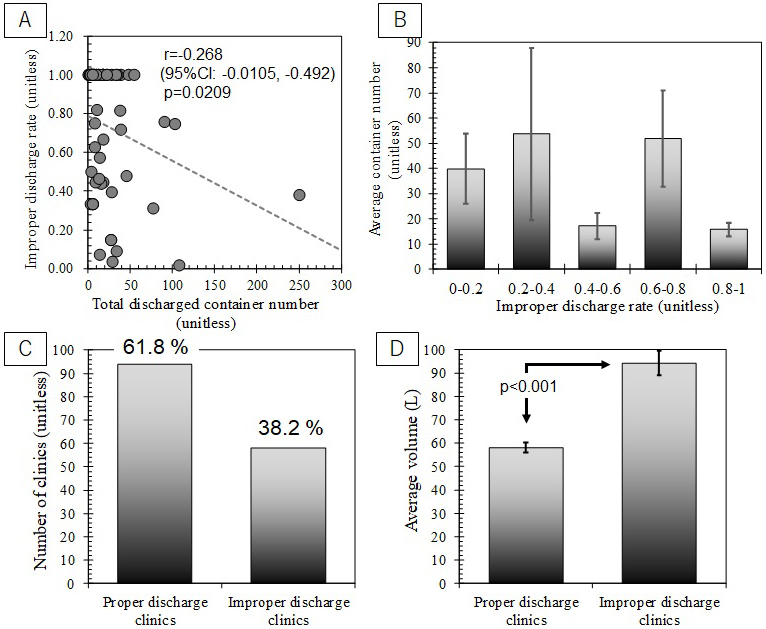
Figure 3. (a) Average discharged container volumes from small-scale medical institutions (clinic, veterinarian, nursing home, and dentist), (b) Relative frequency distribution of average waste volumes, and (c) Inspection results of RMW containers (Proper discharge, improper sealing, container deformation, overweight, container contamination, container damaging, overflow, and needle penetration).

From: Motivation to Decrease Discharge Cost Results in Improper Discharge of Regulated Medical Wastes from Small Clinics: Inspectional and Statistical Evidence in the Tokyo Metropolitan Area

Figure 4. Comparison of “proper discharge” and “improper discharge” containers: (a and d) Improper sealing, (b and e) Container deformation, (c and f) Overweight (Note: [a, b, and c] Container number basis, [d, e, and f] Container number basis, Error bar is standard error, and p value of Welch’s t-test for statistical difference between proper and improper discharges).

From: Motivation to Decrease Discharge Cost Results in Improper Discharge of Regulated Medical Wastes from Small Clinics: Inspectional and Statistical Evidence in the Tokyo Metropolitan Area

Figure 5. Average compressive force to seal RMW containers in groups of gender, age, and container volume capacity (Note: Error bar is standard error and p value of Welch’s t-test in which significant difference between two categories was identified).

From: Motivation to Decrease Discharge Cost Results in Improper Discharge of Regulated Medical Wastes from Small Clinics: Inspectional and Statistical Evidence in the Tokyo Metropolitan Area

Figure 6. (a) Comparison between total discharged container numbers and improper discharge rate in each medical institution, (b) Average number of discharged containers from medical institutions with different improper discharge rates (c) The numbers of “proper discharge” and “improper discharge” medical institutions, and (d) Average waste volume discharged from “proper discharge” and “improper discharge” medical institutions (Note: p value of t-test for statistical significance of the correlation).

From: Motivation to Decrease Discharge Cost Results in Improper Discharge of Regulated Medical Wastes from Small Clinics: Inspectional and Statistical Evidence in the Tokyo Metropolitan Area

PAGE TOP