Figure 1. Target patients and periods of this study
A. Percentage of patients according to age, divided into Period 1 (January 1, 2020, to June 30, 2021), 2 (July 1, 2021, to December 31, 2021), and 3 (January 1, 2022, to June 30, 2022). B. Percentage of patients according to region, divided into Periods 1, 2, and 3. C. Percentage of outpatients and inpatients divided into Periods 1, 2, and 3. D. Domestic SARS-CoV2 vaccination rates in individuals of all ages, and E. those aged 65 years and older from January 2021 to February 2023 according to the number of vaccinations (data obtained from a government digital agency (13) have been modified).
From: Post-Coronavirus Disease 2019 Syndrome in Japan: An Observational Study Using a Medical Database
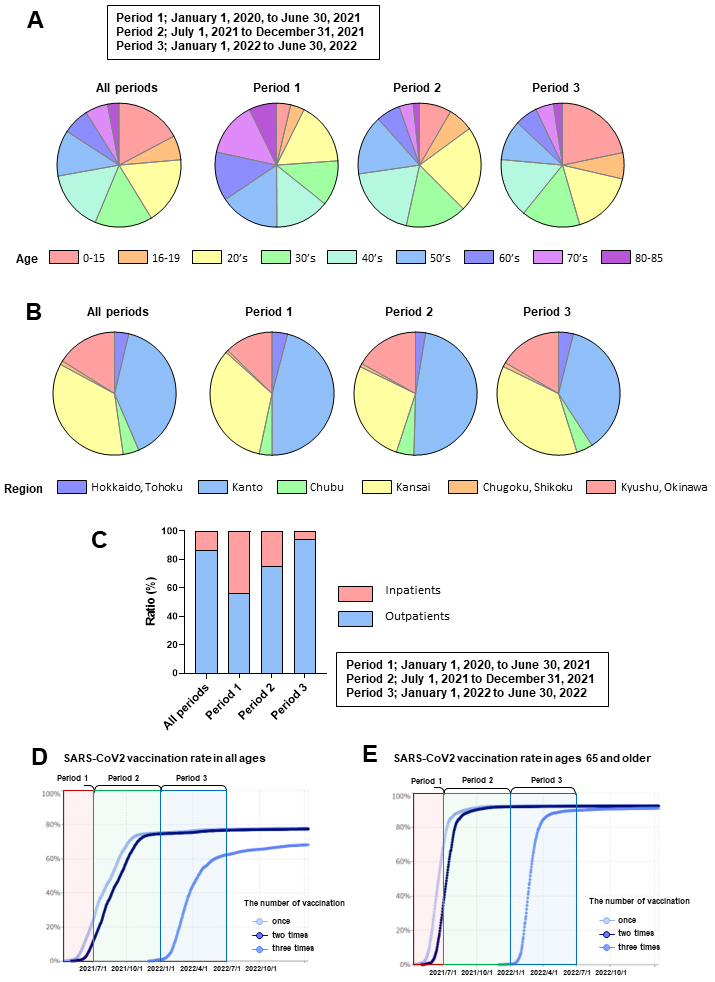
Figure 2. Incidence of acute and post-COVID-19 symptoms in epidemic periods
A. Number of headaches, malaise/fatigue, depression, disuse syndrome, taste disorder, olfactory disorder, and alopecia cases in acute (within two weeks of diagnosis) and post-COVID-19 (2-12 weeks after diagnosis). The numbers are displayed at the tip of the bars. B. Incidence of acute and post-COVID-19 symptoms in three observation periods, along with major epidemic strain and vaccination status. The p-value was calculated using the chi-squared or Fisher’s exact tests and then compared with a corrected significance level using Bonferroni’s method (α′). Asterisks and a dagger indicate that the p-value between the two groups was less than α′ using different original significance level (α); **** α = 0.0001, *** α = 0.001, ** α = 0.01, * α = 0.05, and † α = 0.1. ns represents no significance.
From: Post-Coronavirus Disease 2019 Syndrome in Japan: An Observational Study Using a Medical Database
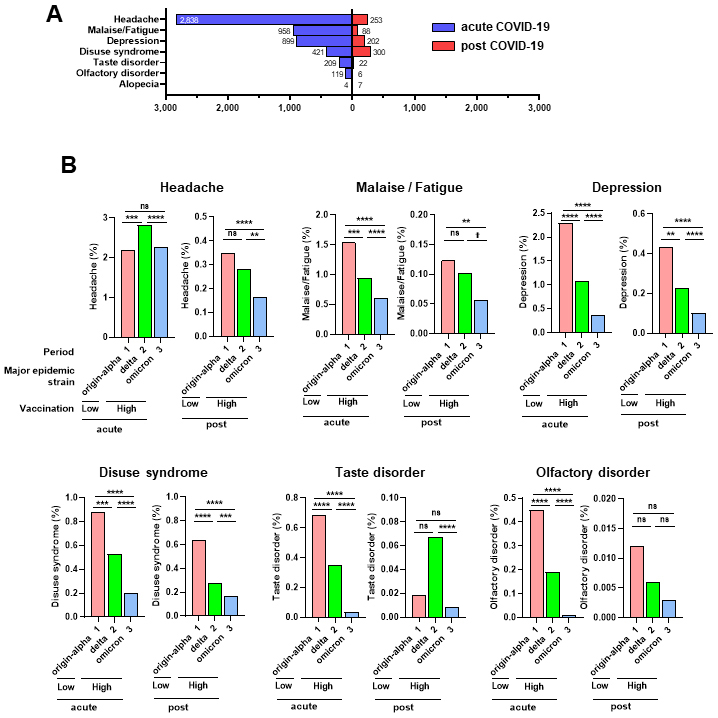
Figure 3. Incidence of acute COVID-19 symptoms according to age
The incidence of acute COVID-19 symptoms in patients with COVID-19 aged 0-19, 20-59, and 60-85 years in all three observation periods. The p-value between the two groups was calculated using the chi-squared or Fisher’s exact tests and then compared with a corrected significance level using Bonferroni’s method (α′). Asterisks indicate that the p-value was less than α′ using different original significance level (α); **** α = 0.0001, *** α = 0.001, ** α = 0.01, and * α = 0.05. ns indicates no significant difference.
From: Post-Coronavirus Disease 2019 Syndrome in Japan: An Observational Study Using a Medical Database
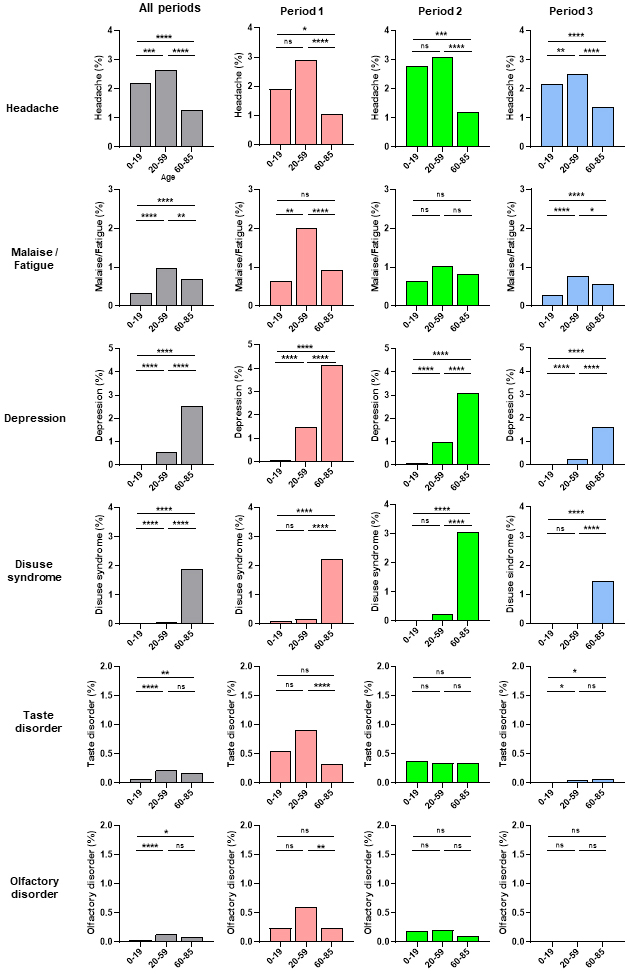
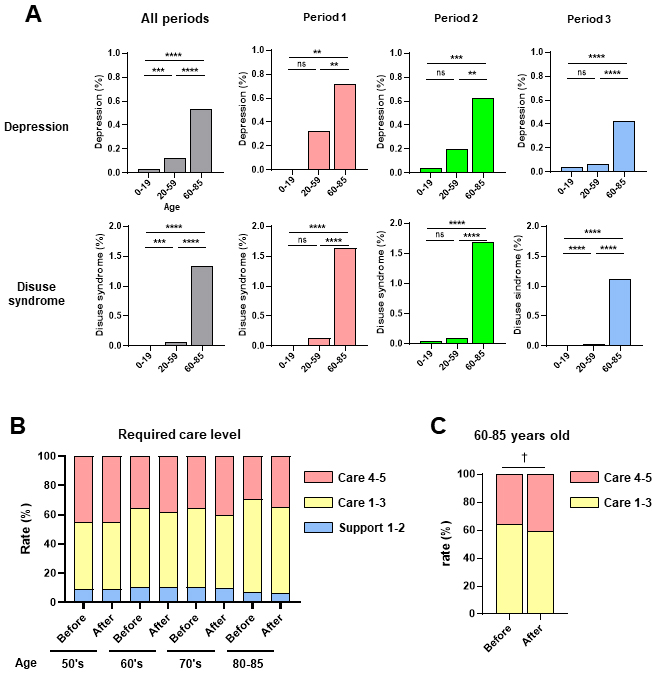
Figure 4. Incidence of post-COVID-19 symptoms and changes in required care before and after COVID-19.
A. Incidence of post-COVID-19 symptoms of depression and disuse syndrome in patients with COVID-19 aged 0-19, 20-59, and 60-85 years in three observation periods. The p-value between the two groups was calculated using the chi-squared or Fisher’s exact tests and then compared with a corrected significance level using Bonferroni’s method (α′). Asterisks indicate that the p-value was less than α′ using different original significance level (α); **** α = 0.0001, *** α = 0.001, and ** α = 0.01. ns represents no significance. B. Changes in nursing care requirements according to age before and after COVID-19 for support levels 1-2, care levels 1-3, and care levels 4-5. C. Changes in nursing care requirements of ages 60-85 years before and after COVID-19 for care levels 1-3, and care levels 4-5. The p-value between the two groups was calculated using the chi-squared test and then compared with a corrected significance level using Bonferroni’s method (α′). A dagger indicates that the p-value was less than α′ using a different original significance level (α); † α = 0.1. represents tendency.
From: Post-Coronavirus Disease 2019 Syndrome in Japan: An Observational Study Using a Medical Database